
Developing flood maps is complex and time consuming. Explore this page to learn more about:
Looking for a flood map? Explore free ready-to-use maps to deepen your understanding of flooding. You can also access the flood mapping resources in your province or territory.
Looking for data? Explore our data related to flood mapping.
Flood mapping process
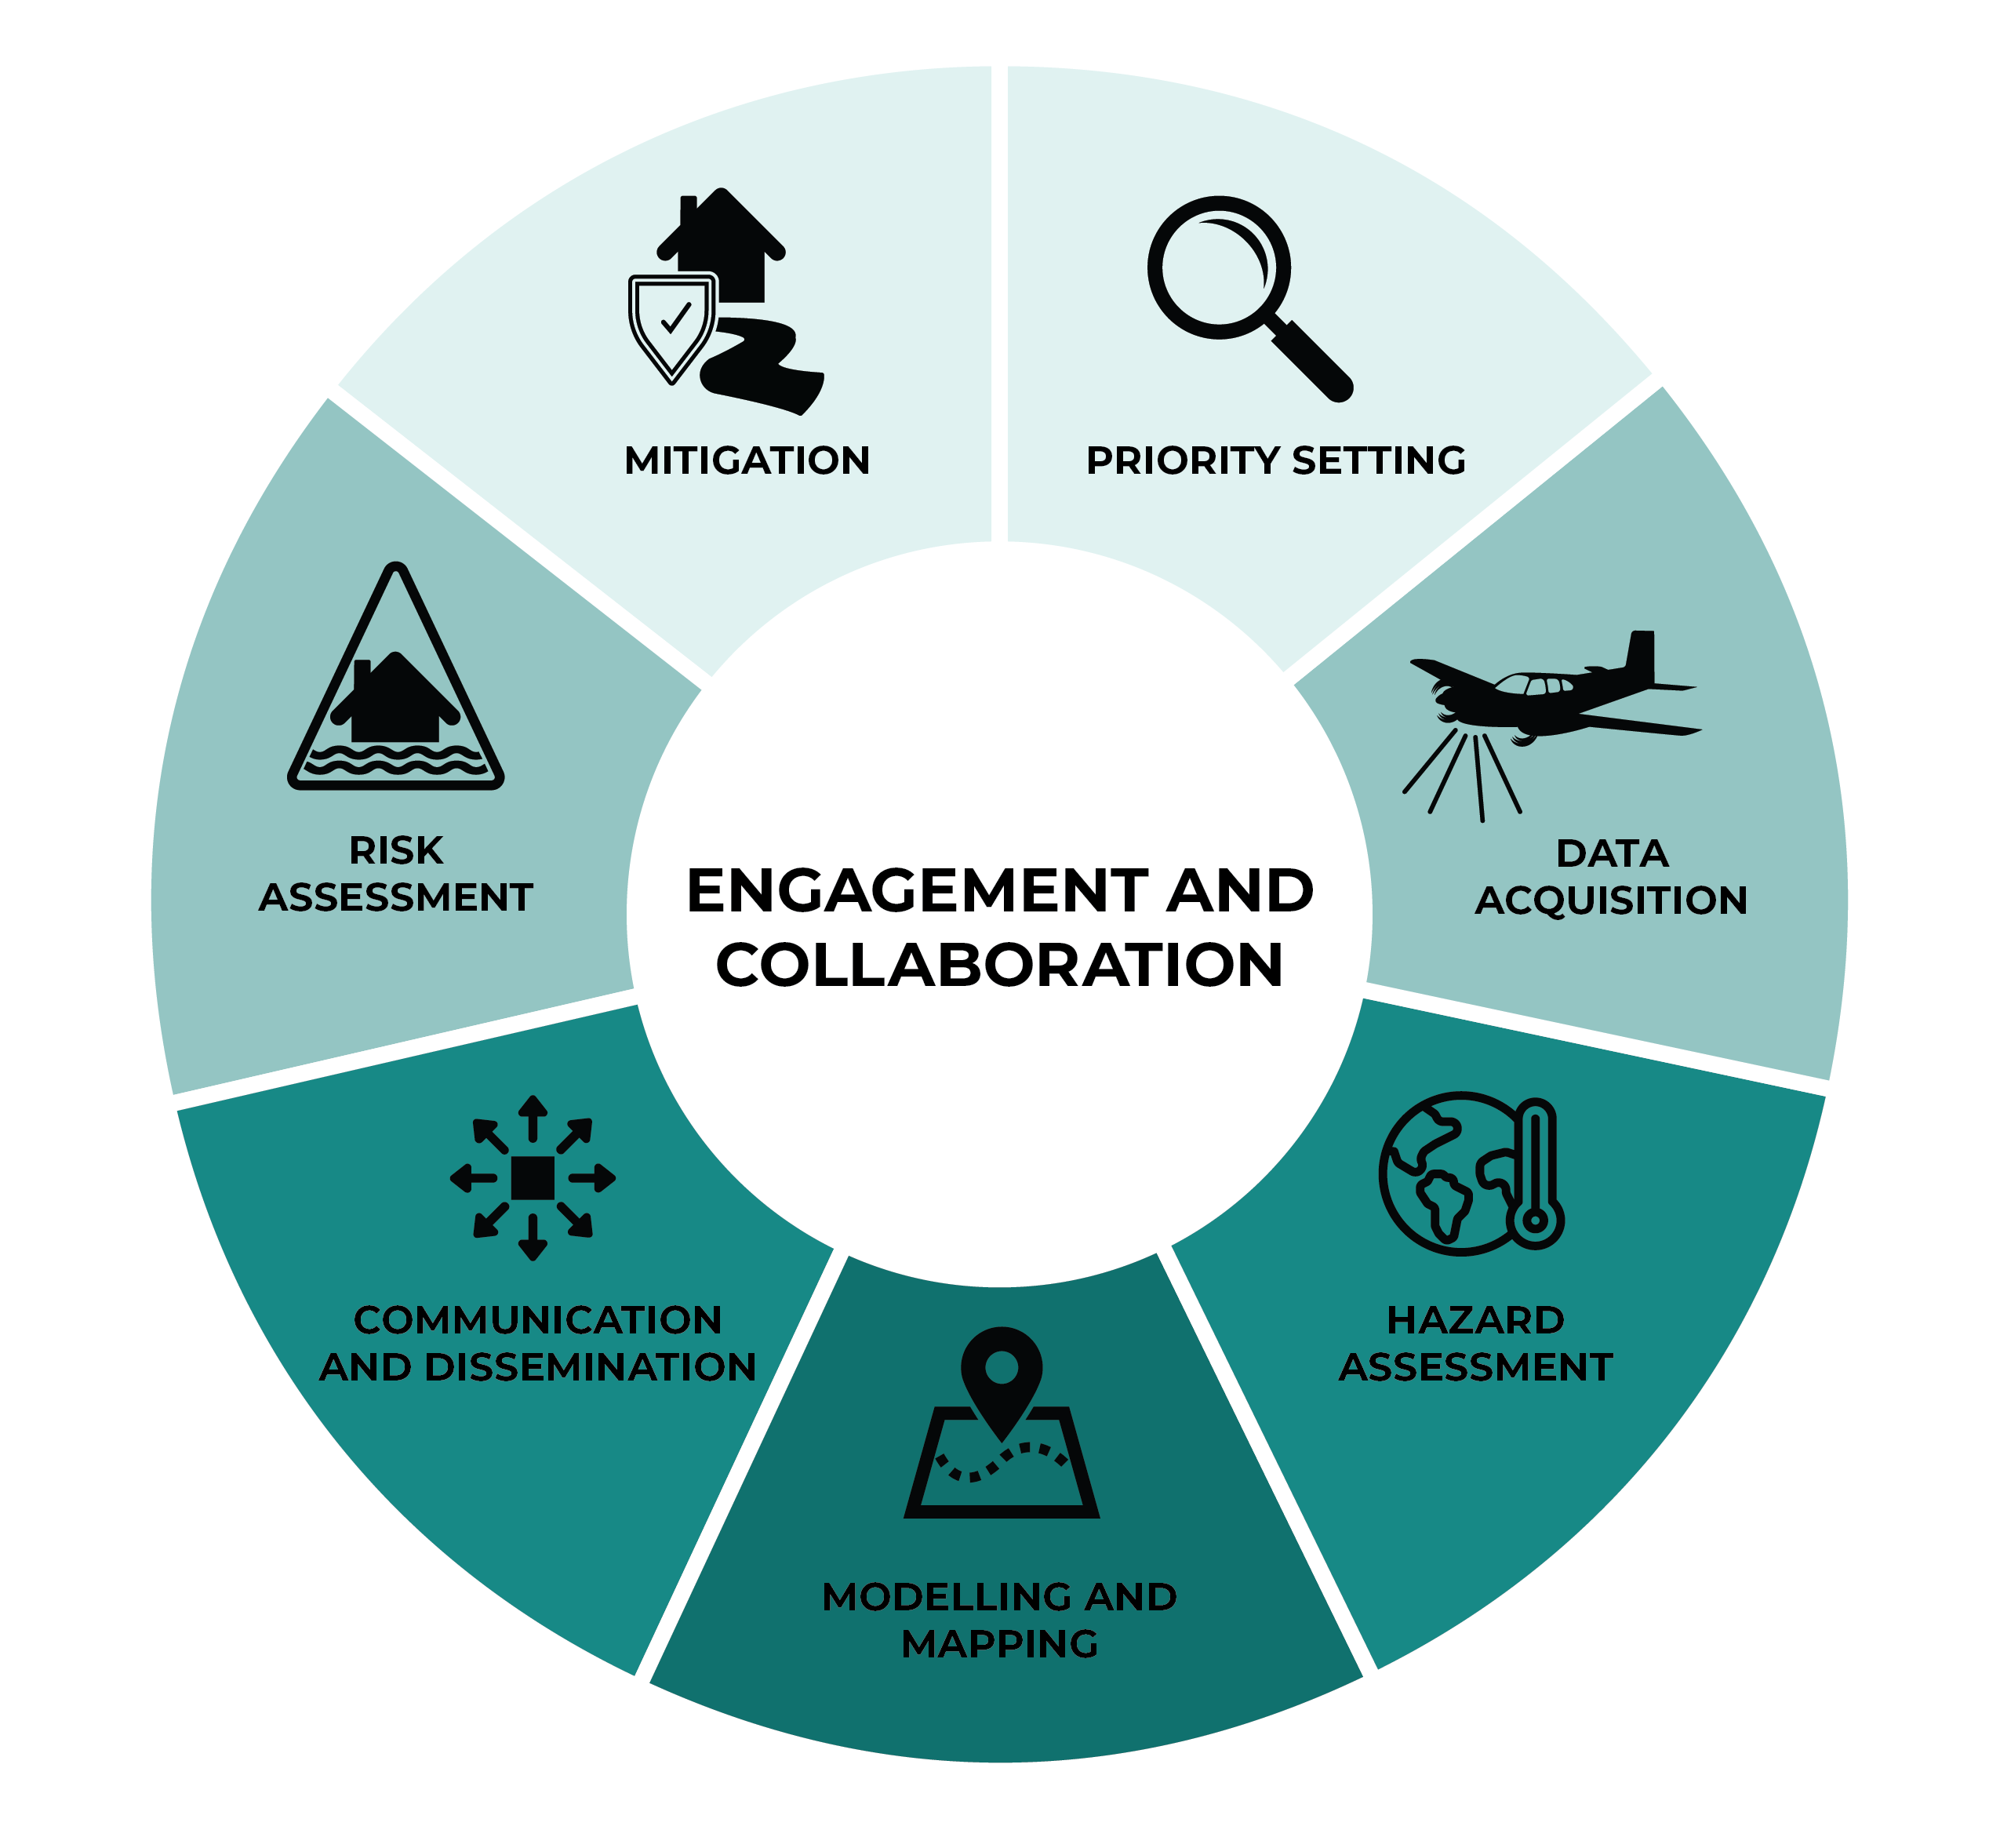
The creation of a flood hazard/risk map requires several steps and the expertise of many people. Steps in flood map creation range from community engagement and data acquisition to producing the map. The diagram below demonstrates the different steps of the process to create a flood map.
For guidance on each of these steps, visit the Federal Flood Mapping Guidelines Series.
-
Priority Setting
Identify and prioritize areas at high risk of flooding that require up-to-date flood maps.
-
Data Acquisition
Gather information such as meteorological, historical and land elevation data, to help predict where the water will flow in case of flooding. This information will be used for hydrologic and hydraulic modelling.
-
Hazard Assessment
Analyze historic precipitation and flow data to understand future floods. Consider climate change, meteorology and other factors that contribute to potential flooding.
Modelling and Mapping
Delineate flood levels and predict flooding scenarios by running hydrologic and hydraulic models based on acquired data. Hydrologic modelling estimates a range of potential flood flows, and hydraulic modelling calculates water levels along rivers for those flows.
-
Communication and Dissemination
Produce and disseminate maps based on modelling for easier interpretation.
-
Risk assessment
Use maps and other information to identify flood risk zones.
-
Mitigation
Implement land-use restrictions and invest in measures to reduce impacts of flooding.
-
Engagement and Collaboration
Inform and gather feedback from community members and stakeholders throughout entire process.
Types of flood maps
Flood maps identify the areas covered by water during real or potential flood events. They can identify the probability of floods and its impact on structures, people, and assets.
Under the broad definition of “flood map”, different types of geospatial, hydraulic, and hydrologic information can be presented to meet specific assessment requirements. The following different types of flood maps are used in Canada:
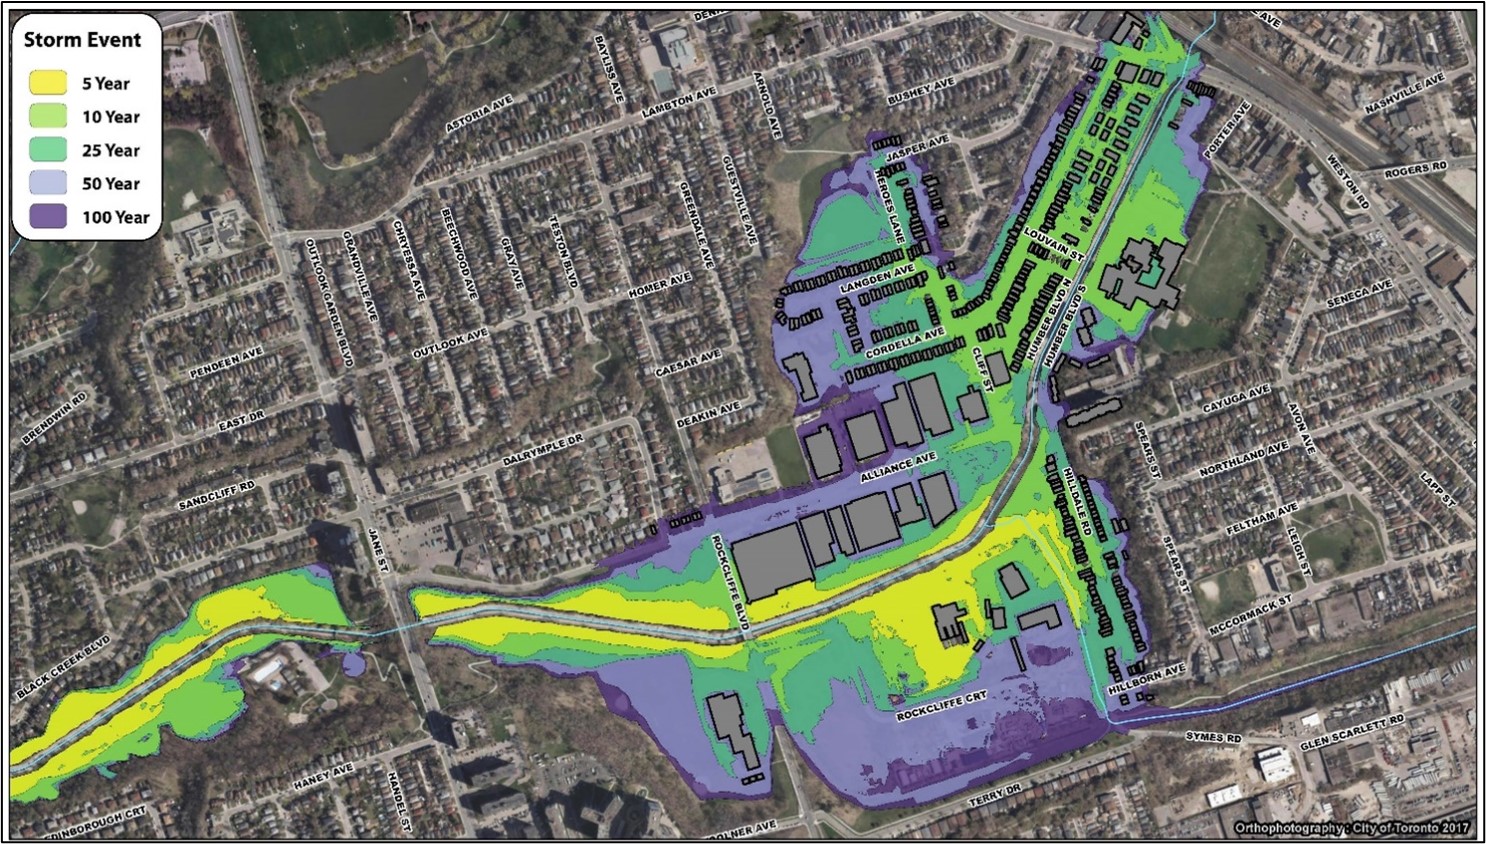
Inundation Maps
Show the floodwater extent of real or potential flood events. They are used to inform emergency preparedness plans for communities in flood zones and flood hazard zones. (Image source: Toronto and Region Conservation Authority)
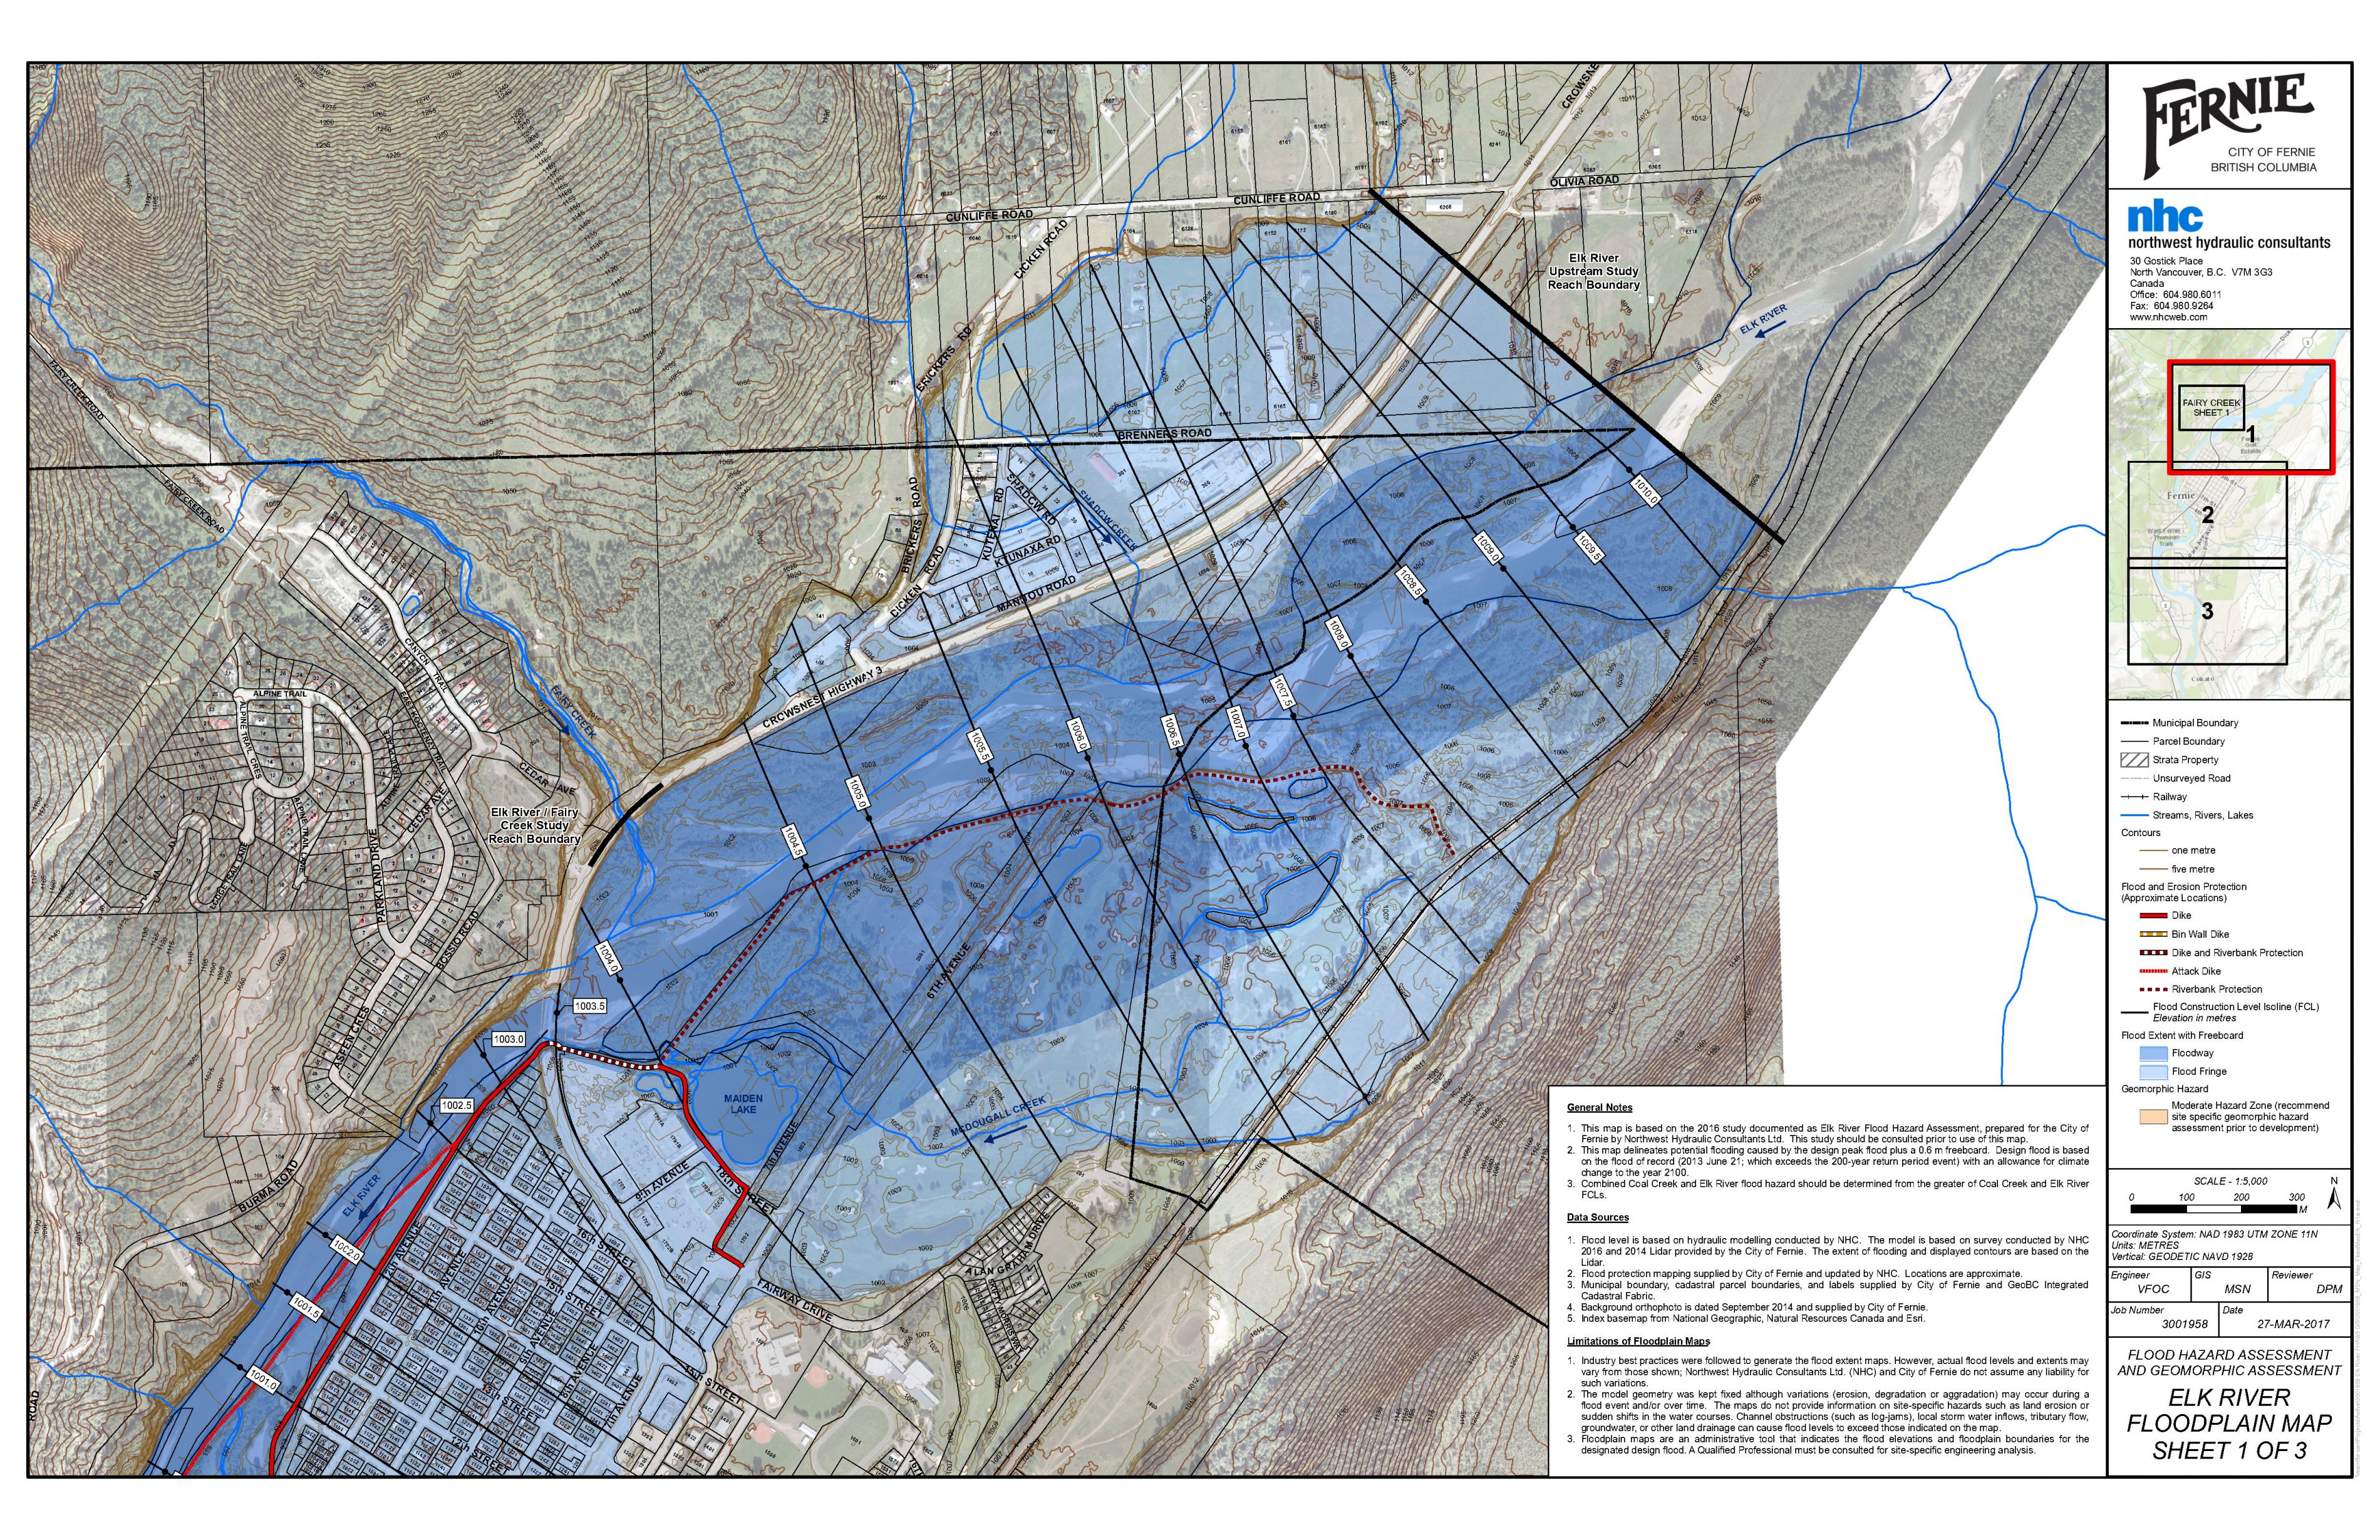
Flood Hazard Maps
Show the results of hydrologic and hydraulic investigations, including areas of potential flooding in different scenarios. Flood hazard maps are engineering maps, often used as regulatory maps for land use planning related to flood mitigation. (Image source: City of Fernie)
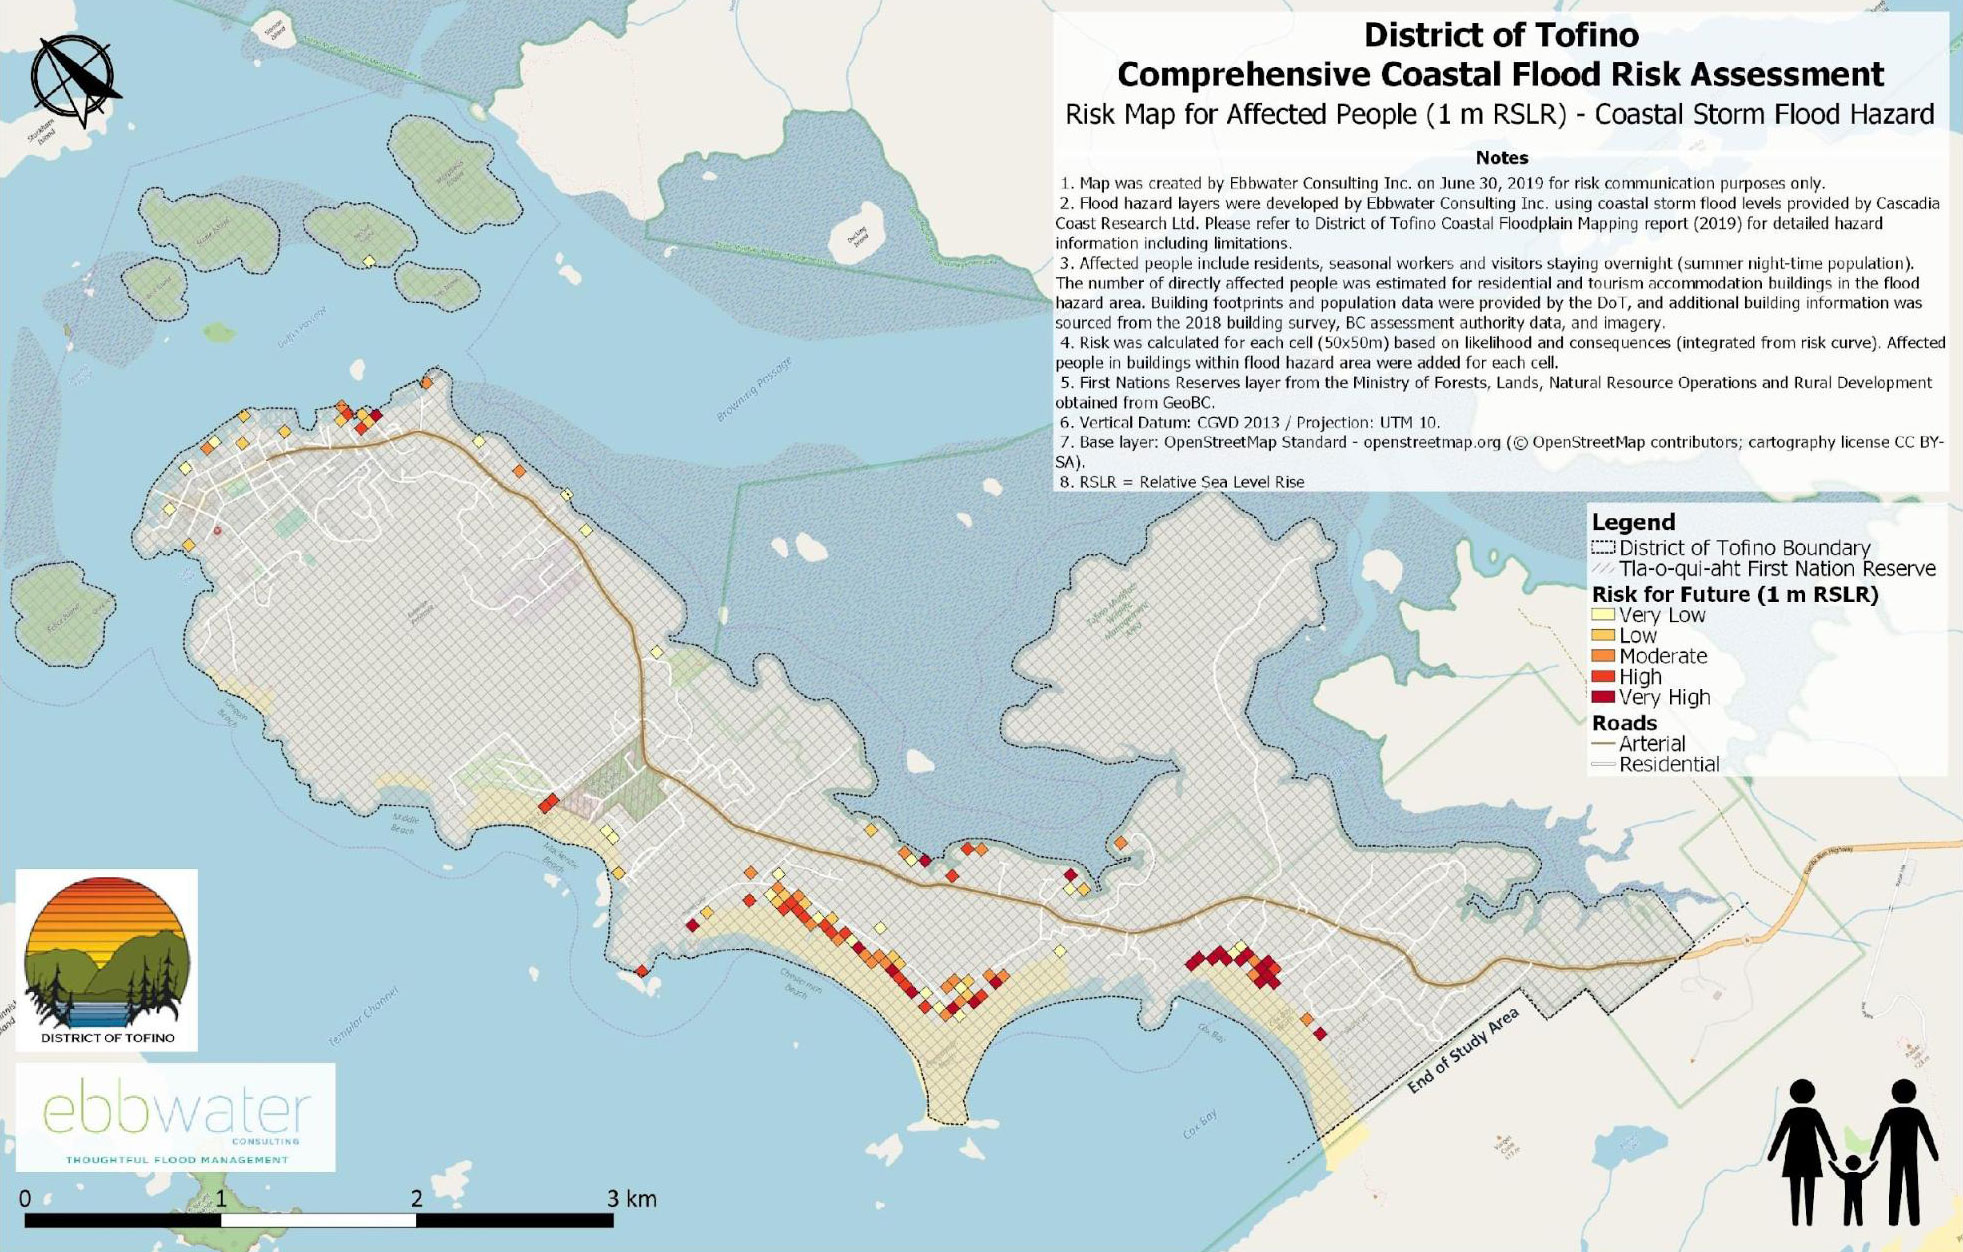
Flood Risk Maps
Demonstrate potential adverse consequences (such as social, economic, environmental or cultural) that communities may face during a flood scenario.(Image source: District of Tofino [Murphy et al., 2020])
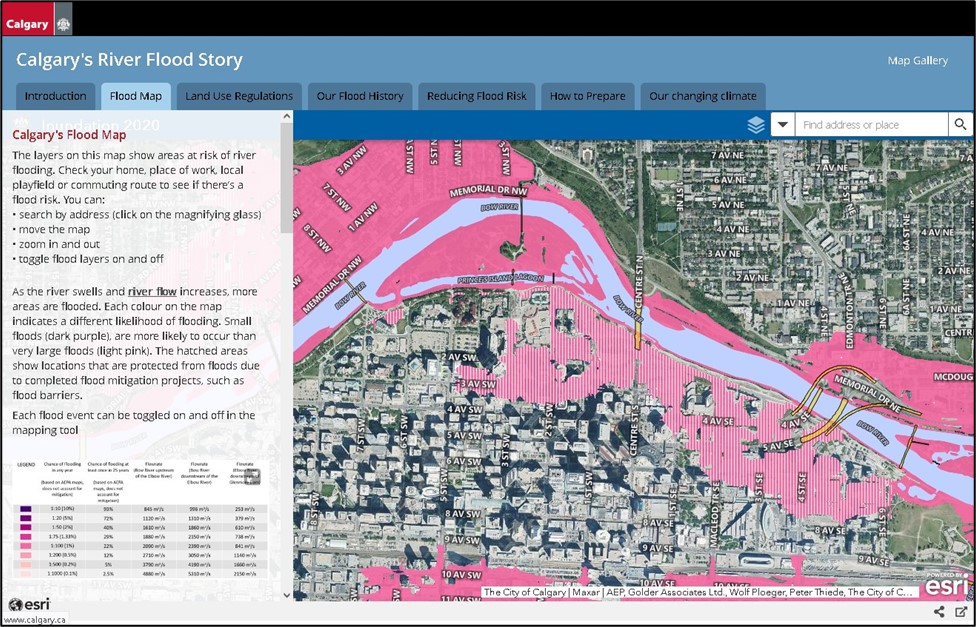
Flood Awareness Maps
Communication maps that provide more context alongside flood hazard/risk maps. They may show the history of flooding in their communities, or potential for future flooding. (Image source: City of Calgary)
More details on the requirements for various types of flood maps as well as guidelines for the associated digital geospatial data are available in the Federal Geomatics Guidelines for Flood Mapping.
Science of flood mapping
The Government of Canada is dedicated to science and research that can support and advance flood mapping and risk assessment. Learn more about the science of flood mapping.
For more information:
- See how remote sensing is used for flood delineation and mapping
- Read about hydrology
- Discover facts about floods in Canada
- Watch how to monitor floods using satellite imagery
- Listen to a podcast about using satellites to monitor floods
- Understand what elevation data is and what it can do
Find out more
- Discover the data related to flood mapping
- Read about Canada’s flood mapping roles
- Look at the details of the Flood Hazard Identification and Mapping Program
- Learn how to Get Flood Ready
Reach out to us
For more information, please email geoinfo@nrcan-rncan.gc.ca