
Minerals and the economy
Canada is recognized as a leading mining nation. Our minerals sector, which includes exploration, mining and related support activities, primary processing, and downstream product manufacturing, is a mainstay of the economy that supports jobs and economic activity in every province and territory.
Learn what Canada is doing to advance the economy through minerals
 Critical minerals
Canada is primed to capitalize on the rising global demand for critical minerals and materials that will power the clean energy transition and advanced manufacturing. Canada is a key global producer of copper, nickel and cobalt and hosts advanced mineral projects for rare earth elements, lithium, graphite and vanadium.
Canada plans to leverage its mining prowess and strong environmental, social and governance credentials. The intent is to create competitive supply chains for critical minerals and value-added products, processes and technologies. These range from zero-emission vehicles (including Li-ion batteries, permanent magnets and specialty alloys) to wind turbines and hydrogen fuel cells, to information and communication technologies (including semi-conductors).
Learn more about critical minerals in Canada and consult the interactive map of critical minerals sites in Canada
 Greenhouse gas emissions and advanced green technologies
Developing Canada's minerals sector in clean and sustainable ways will ensure that it can continue to contribute to the Canadian economy for years to come.
Greenhouse gas emissions
Canadian mines have relatively low intensities of greenhouse gas emissions across a range of commodities. Canada’s carbon competitiveness stems from a host of advantages, including access to clean energy sources and significant investments in research, development and adoption of green technologies.
Canadian mines and processing facilities continue to invest to lower their emissions through electrification of equipment and vehicle fleets and through the development of new technologies. This includes mines in remote off-grid locations that have few alternative energy sources. Some of these remote sites have installed wind turbines to reduce their dependency on diesel fuel.
Advanced green technologies
The Green Mining Initiative, led by Natural Resources Canada (NRCan), aims to improve the minerals sector's environmental performance and create green technology opportunities. NRCan works in close partnership with provincial and territorial governments, industry, academia, non-governmental organizations and other interested stakeholders, such as the Canada Mining Innovation Council.
Learn more about green mining innovation.
 Mineral production
Canada is the global leader in potash production and ranks among the top five global producers of diamonds, gemstones, gold, indium, niobium, platinum group metals, titanium concentrate and uranium.
Canada is also the world’s fourth-largest producer of primary aluminum.
Key facts
- Canada produced 60 minerals and metals at almost 200 mines and 6,500 sand, gravel and stone quarries.
- The value of Canada's mineral production reached $74.6 billion in 2022.
- Potash was the top-ranked commodity by value of production in Canada in 2022 with a value of $16.8 billion.
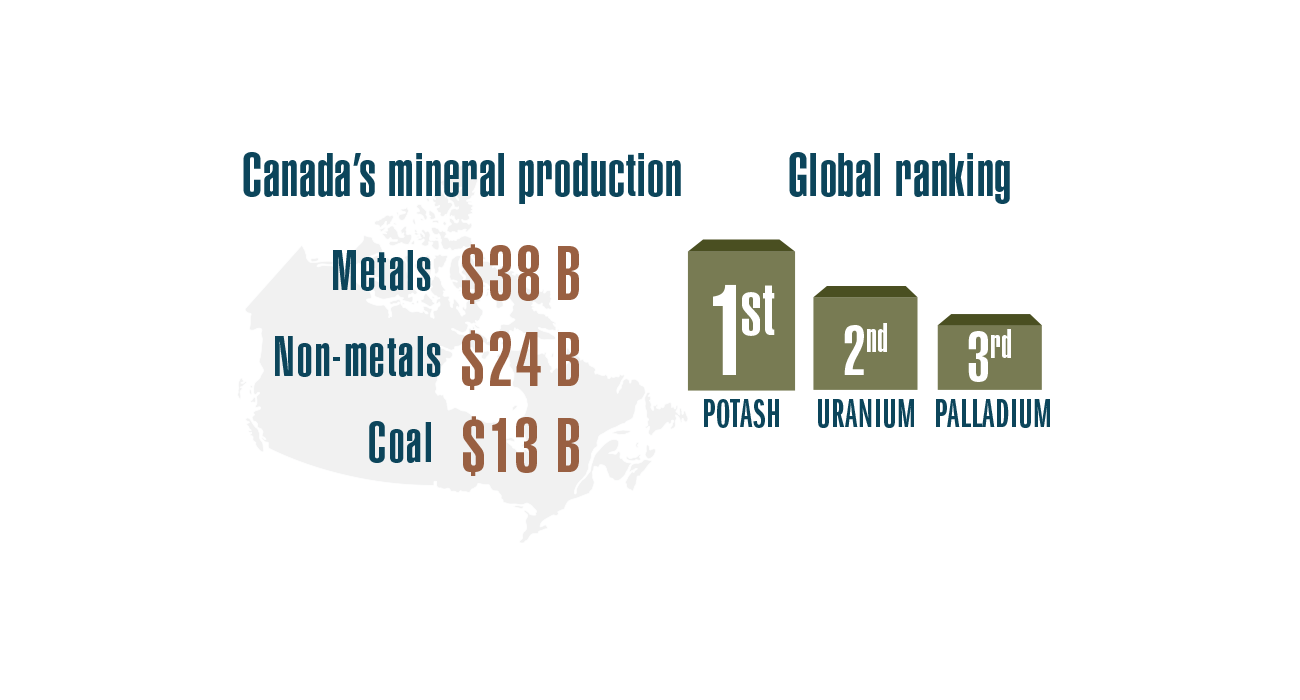
Text version
This graphic shows the value of Canada's mineral production: metals, $37.8 billion; non-metals, $24.2 billion; coal, $12.7 billion. It also shows Canada's global ranking for potash (first), uranium (second), and palladium (third).
Mineral production by commodity group
The 2022 value of Canadian mineral production was $62.0 billion, 20% higher than the 2021 value of $51.8 billion. Metals’ value of production increased by 1% from the previous year, while non-metals and coal went up by 52% and 85%, respectively.
Mineral production, by commodity group, 2013–2022 (p)
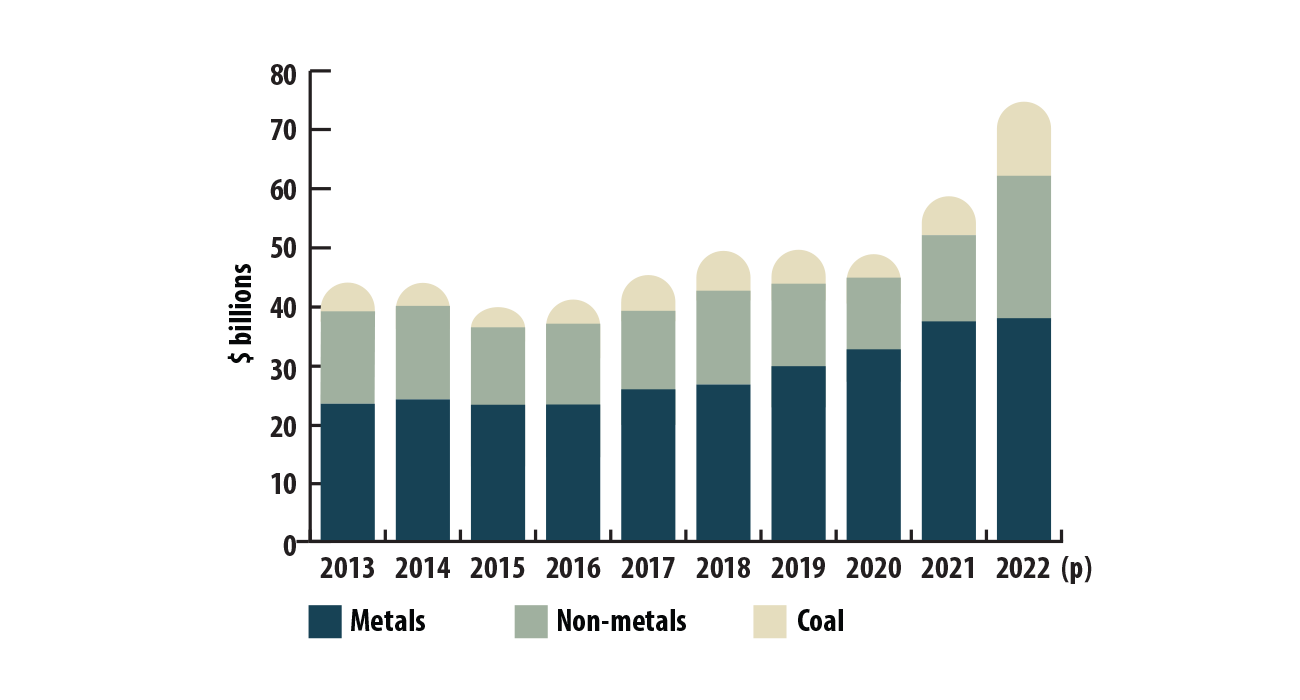
Text version
This bar graph shows the value of mineral production by commodity group for each year from 2013 to 2022 (p). See the table Mineral production, by commodity group, 2013–2022 (p) for the specific values for each region.
| Commodity group | 2013 | 2014 | 2015 | 2016 | 2017 | 2018 | 2019 | 2020 | 2021 | 2022 (p) |
|---|---|---|---|---|---|---|---|---|---|---|
| Metals | 23,497 | 24,225 | 23,198 | 23,302 | 25,738 | 27,059 | 29,695 | 32,513 | 37,355 | 37,814 |
| Non-metals | 15,477 | 15,779 | 16,520 | 13,724 | 13,304 | 15,531 | 8,437 | 8,323 | 7,574 | 11,526 |
| Coal | 4,887 | 3,897 | 3,126 | 4,009 | 6,281 | 6,459 | 5,625 | 3,957 | 6,829 | 12,655 |
| Total | 43,861 | 43,900 | 42,843 | 41,036 | 45,323 | 49,049 | 43,756 | 44,793 | 51,757 | 61,995 |
Canada's top five mineral products by value for 2022 were gold, coal, copper, iron ore concentrates, and potash. Their combined value was $45.5 billion, accounting for more than two thirds of the total value of mineral production.
Leading minerals, by value of production, 2022 (p)
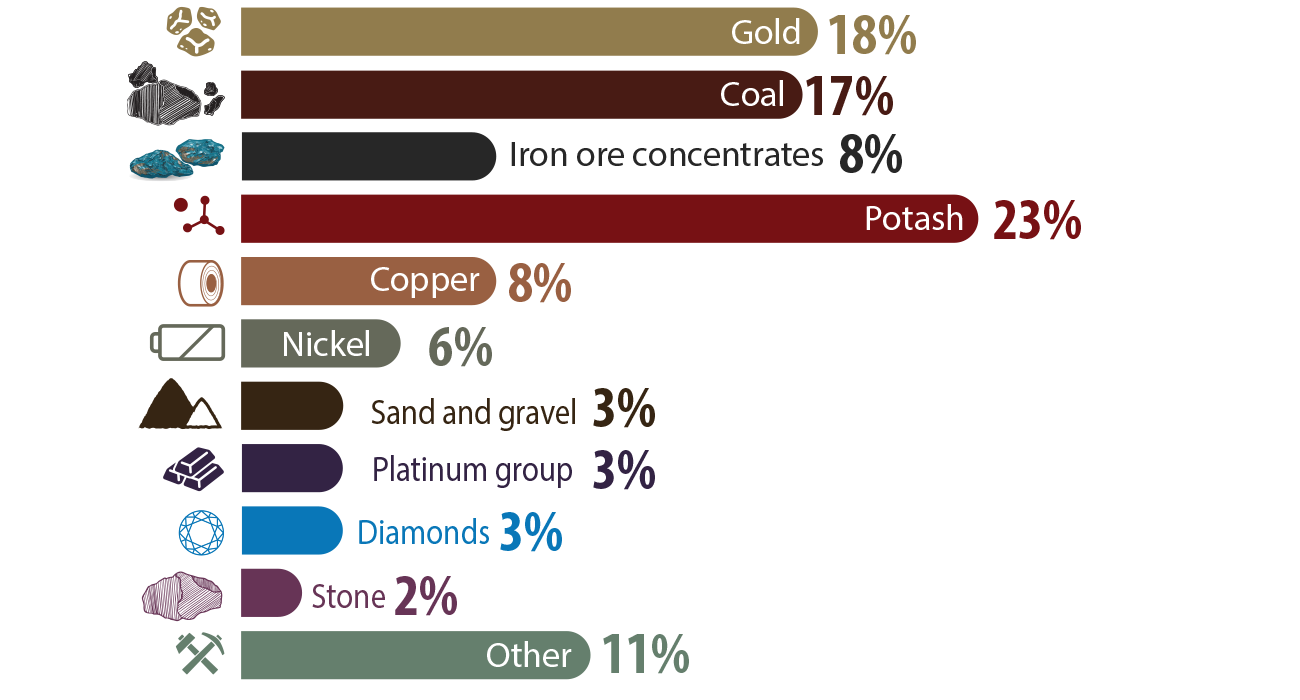
Text version
This bar graph shows the leading minerals by value of production as a percentage of the total for 2022. The top three commodities were potash (23%), gold (18%), and coal (17%).
Service suppliers
Canadian cities provide regional bases for supporting exploration, mining and allied industries through specialized equipment and service suppliers. Large urban areas, such as Toronto and Vancouver, are also recognized as global hubs for mining and mineral exploration, financing and legal services.
Thousands of firms in Canada are available to provide technical, legal, financial, accounting, environmental and other expertise to the exploration and mining industry.
Transportation plays a key enabling role for the minerals sector, not only in delivering mineral products to markets, but also in bringing equipment and supplies to mining operations. The transportation industries – such as rail – benefit from a vibrant mining sector because mining accounts for over half of Canada's rail-freight tonnage annually.
Learn more about Canadian mineral production.
Principal mineral areas, producing mines, and oil and gas fields in Canada
This map displays the significant metallic, non-metallic and industrial mineral mines; oil sands mines; and gas fields across Canada.
Learn more about the available mining and minerals maps.
 Mineral exploration
Mineral exploration is the search for materials in the Earth's crust where concentration and quantity allow for extraction and processing at a profit.
Key facts
- Preliminary figures for 2022 indicate that mining and mineral exploration companies spent $4.1 billion on exploration and deposit appraisal projects in Canada, compared with $3.8 billion in 2021.
- 2023 expenditures are expected to fall to $3.7 billion – a decrease of about 8%, based on reported spending intentions (si).
- Exploration and mining companies that have their headquarters in Canada accounted for the largest portion of worldwide non-ferrous exploration budgets, reaching 39% in 2022.
- Canada was among the world's top destinations for non-ferrous mineral exploration in 2022, attracting 21% of global exploration budgets.
The amount spent on mineral exploration and on deposit appraisal activity depends largely on market conditions and commodity prices. Over the last decade, mineral and metal prices fluctuated significantly, reaching a cyclical peak in 2011 that was driven by rapid growth in China and other emerging market economies. Prices subsequently decreased as supply outpaced demand.
Prices began to recover in the second half of 2016. That trend continued into the second half of 2019, but shifted for most metals in early 2020 because of the economic lockdowns caused by the COVID-19 pandemic.
Metal prices recovered late in 2020 as supply diminished and demand recovered. In 2021 and in the first half of 2022, the prices rose more quickly because of rising inflationary pressures and the Russia-Ukraine conflict. Since mid-2022, prices have generally declined.
Expenditures; by company type, and spending and price indices; 2014 to 2024
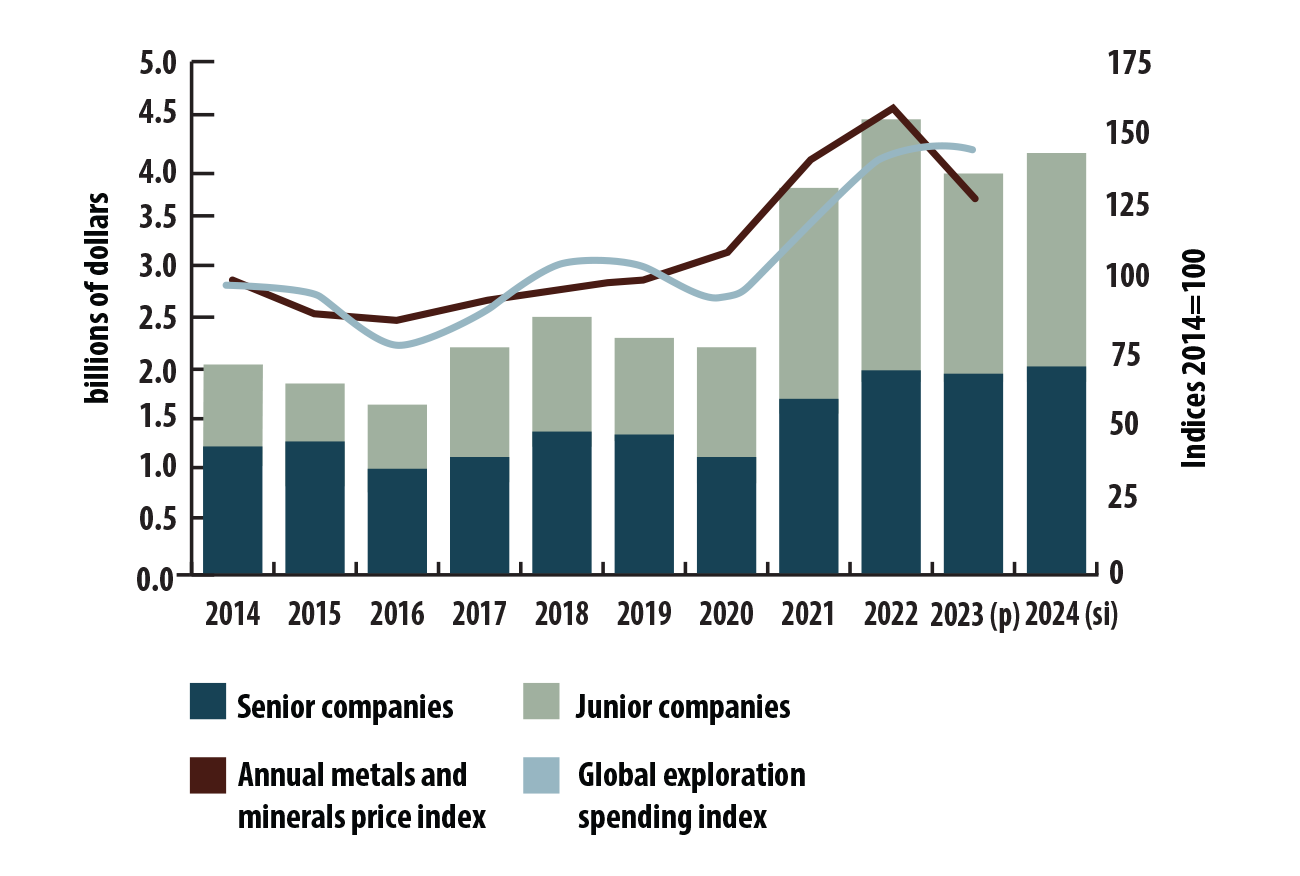
Text version
This bar chart shows exploration and deposit appraisal expenditures by type of company from 2014 to 2024. Each bar is divided into two segments: one for senior companies and one for junior companies. A line graph depicting the Bank of Canada’s metals and minerals price index is superimposed over the bar graph. A second line graph shows the global exploration spending index. The combined chart shows the strong correlation between metal and mineral prices and exploration and deposit appraisal spending.
Mineral exploration by commodity
Canada benefits from a diversified mineral endowment that includes traditional commodities, such as gold, base metals and diamonds. As well, Canada has commodities that are used in clean energy applications and advanced technologies, such as rare earth elements, graphite and lithium.
Precious metals, particularly gold, remained the leading target for exploration spending ($2.5 billion), which remained flat from the previous year and accounts for 61% of total spending in 2022.
Exploration and deposit appraisal percentage of expenditures, by mineral commodity group, 2012 and 2021 (p)
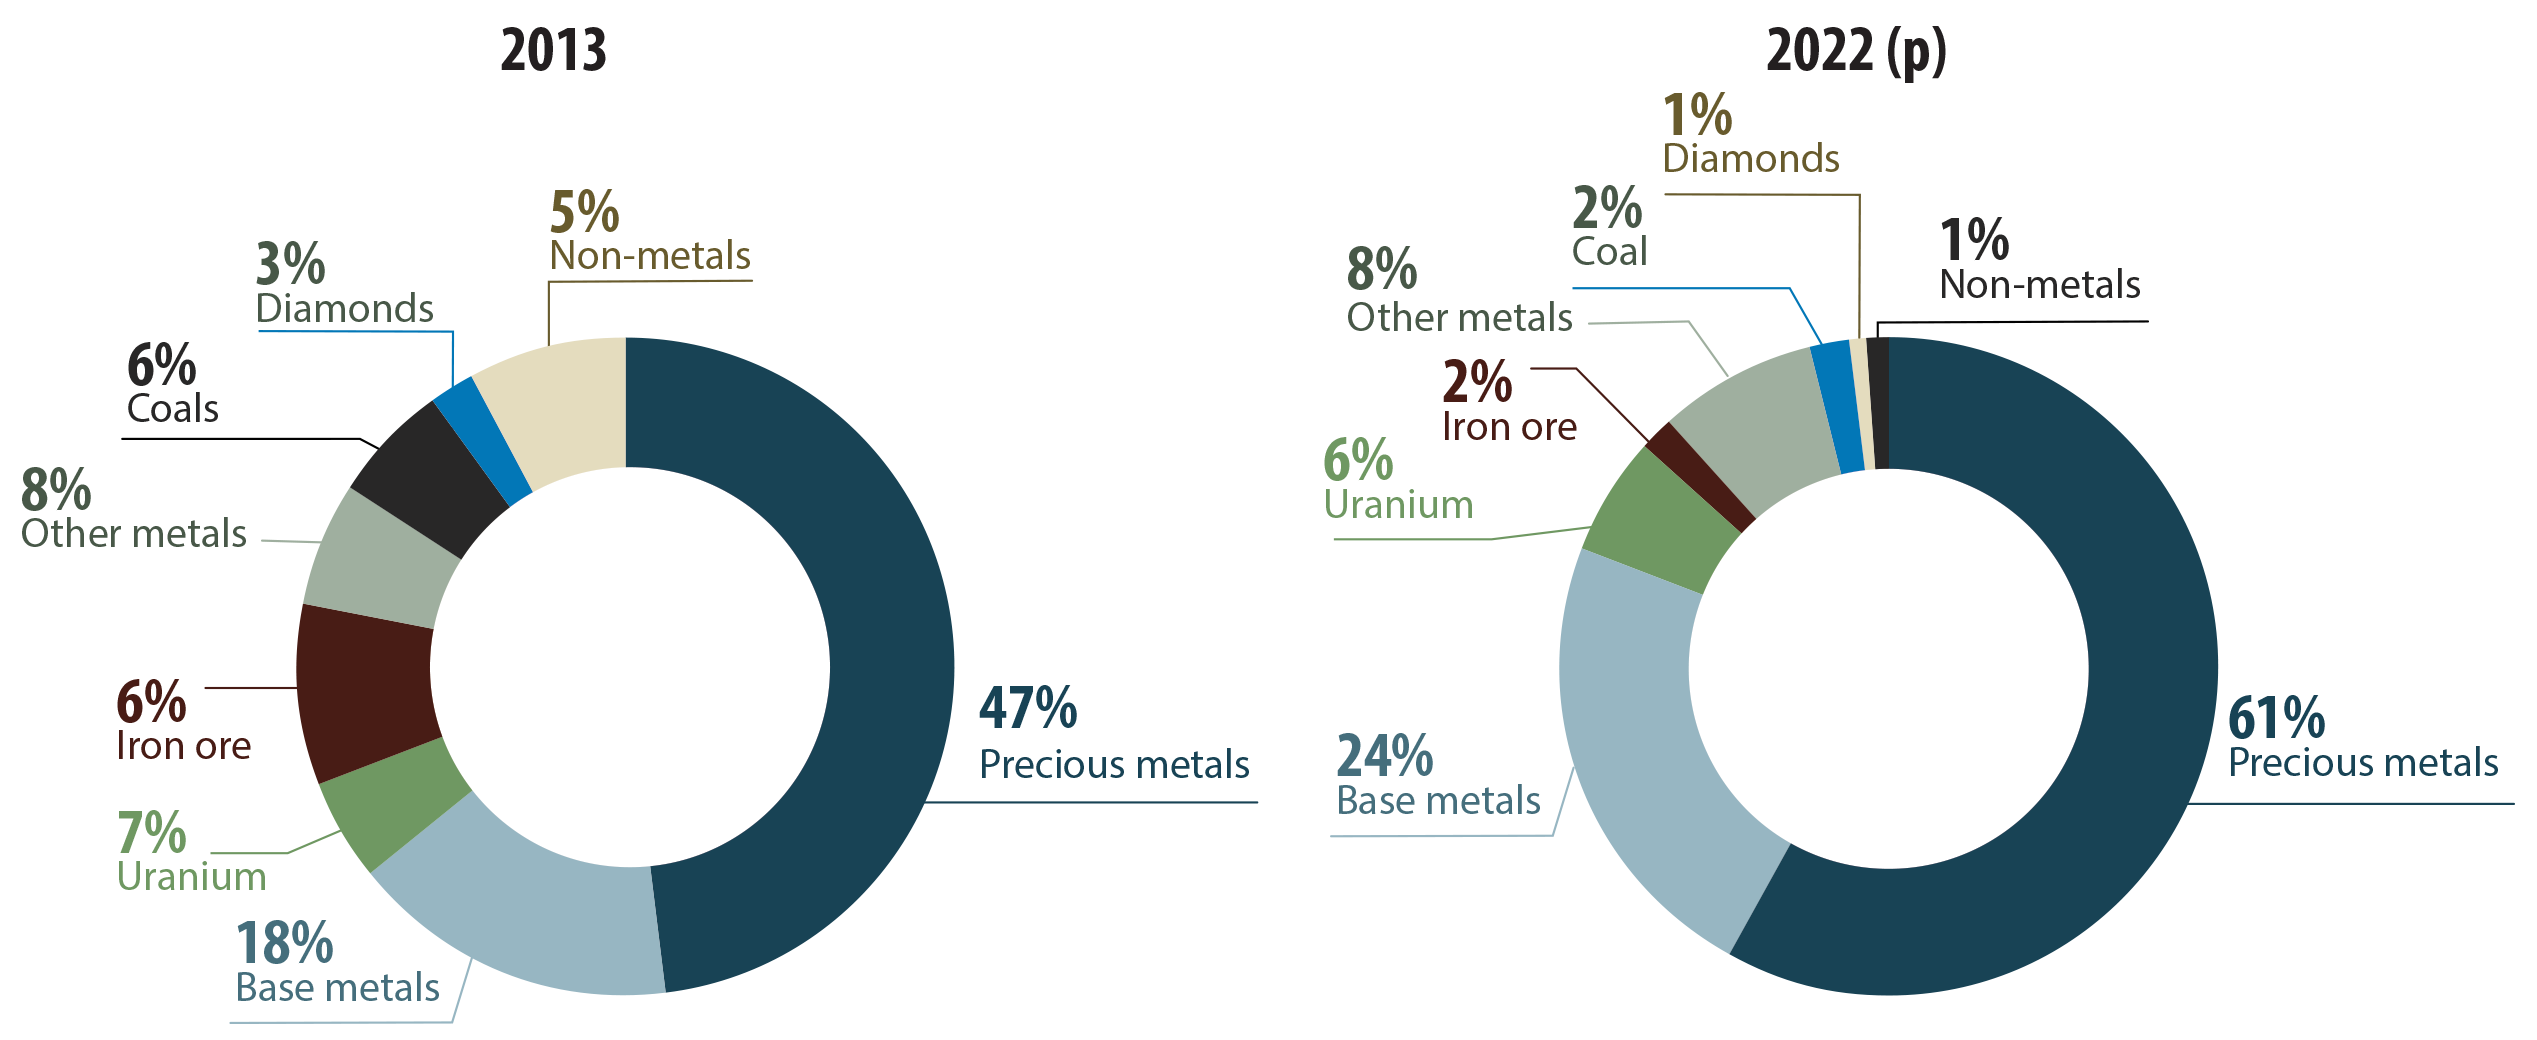
Text version
This set of two circular charts shows exploration and deposit appraisal expenditures by mineral commodity group for 2013 and 2022. In 2013, precious metals accounted for 47% of spending, base metals 18% and uranium 7%. In 2022, precious metals accounted for 61% of the spending, base metals 24% and uranium 6%. See the table Exploration and deposit appraisal expenditures, by mineral commodity group, 2013–2023 (si) for specific values by commodity group for individual years.
| Commodity group | 2013 | 2014 | 2015 | 2016 | 2017 | 2018 | 2019 | 2020 | 2021 | 2022 (p) | 2023 (si) |
|---|---|---|---|---|---|---|---|---|---|---|---|
| Precious metals | 1,103.6 | 849.4 | 857.5 | 952.6 | 1,430.5 | 1,522.8 | 1,297.9 | 1,480.2 | 2,474.6 | 2,463.8 | 2,043.0 |
| Base metals | 419.3 | 420.0 | 382.0 | 236.7 | 322.2 | 376.6 | 425.4 | 385.4 | 798.2 | 995.7 | 925.7 |
| Iron ore | 130.7 | 69.1 | 28.1 | 22.5 | 9.1 | 18.4 | 17.1 | 30.6 | 97.6 | 21.6 | 75.8 |
| Uranium | 167.4 | 184.4 | 170.2 | 163.9 | 137.4 | 169.7 | 162.3 | 66.8 | 122.2 | 232.2 | 281.0 |
| Diamonds | 72.9 | 109.9 | 119.3 | 77.7 | 83.2 | 108.8 | 127.0 | 64.0 | 51.8 | 36.7 | 22.5 |
| Other metals | 191.9 | 125.3 | 68.7 | 48.0 | 89.0 | 140.7 | 105.9 | 33.1 | 112.6 | 210.6 | 290.1 |
| Non-metals | 116.5 | 136.0 | 124.8 | 81.2 | 58.4 | 78.6 | 58.7 | 35.1 | 65.3 | 57.2 | 51.6 |
| Coal | 149.8 | 123.4 | 91.8 | 46.2 | 55.7 | 69.5 | 92.2 | 96.2 | 56.1 | 49.1 | 58.9 |
| Total | 2,352.1 | 2,017.5 | 1,842.4 | 1,628.8 | 2,185.5 | 2,485.2 | 2,286.5 | 2,191.4 | 3,778.4 | 4,067.0 | 3,748.6 |
Mineral exploration by province and territory
In 2022, Ontario was the leading jurisdiction in terms of spending on mineral exploration, followed by British Columbia and Quebec. These three jurisdictions accounted for 68% of total exploration and deposit appraisal expenditures.
Exploration and deposit appraisal expenditures, by province and territory, 2021–2023 (si)
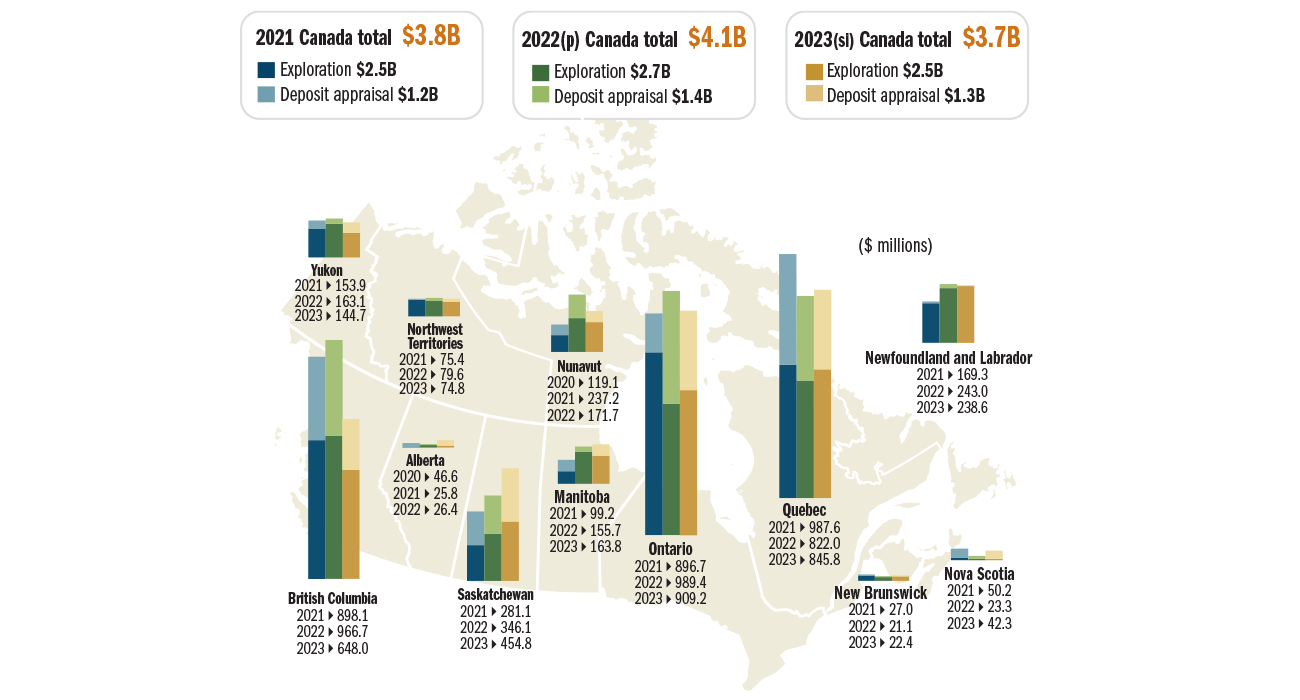
Text version
The bar graphs superimposed on this map of Canada show the amount of exploration and deposit appraisal expenditures for each province and territory for the years 2021, 2022, and 2023. Each bar is subdivided into two segments: one for exploration and one for deposit appraisal. The top spending jurisdictions in 2022 were Ontario ($989.4 million), British Columbia ($966.7 million), and Quebec ($822.0 million).
Mineral exploration by company type
Two types of companies work in mineral exploration:
- Senior companies normally derive recurring operating revenues from mining or other business segments. These are not necessarily mining companies.
- Junior companies have no internally generated revenue (i.e. they do not have an operating mine) and rely mostly on equity markets to raise the capital necessary to conduct their exploration programs.
Junior mining companies tend to specialize in early-stage exploration activities, while senior companies are more likely to bring mines into production.
Junior companies play a critical role in the discovery and advancement of mineral projects in Canada, projects that represent the next generation of Canadian mines. In 2022, junior mining companies spent $2.3 billion on exploration and deposit appraisal activities, a 10% increase over 2021. Senior company expenditures increased 5% from 2021.
Exploration and deposit appraisal share of expenditures, by junior and senior companies, 2013–2023 (si)
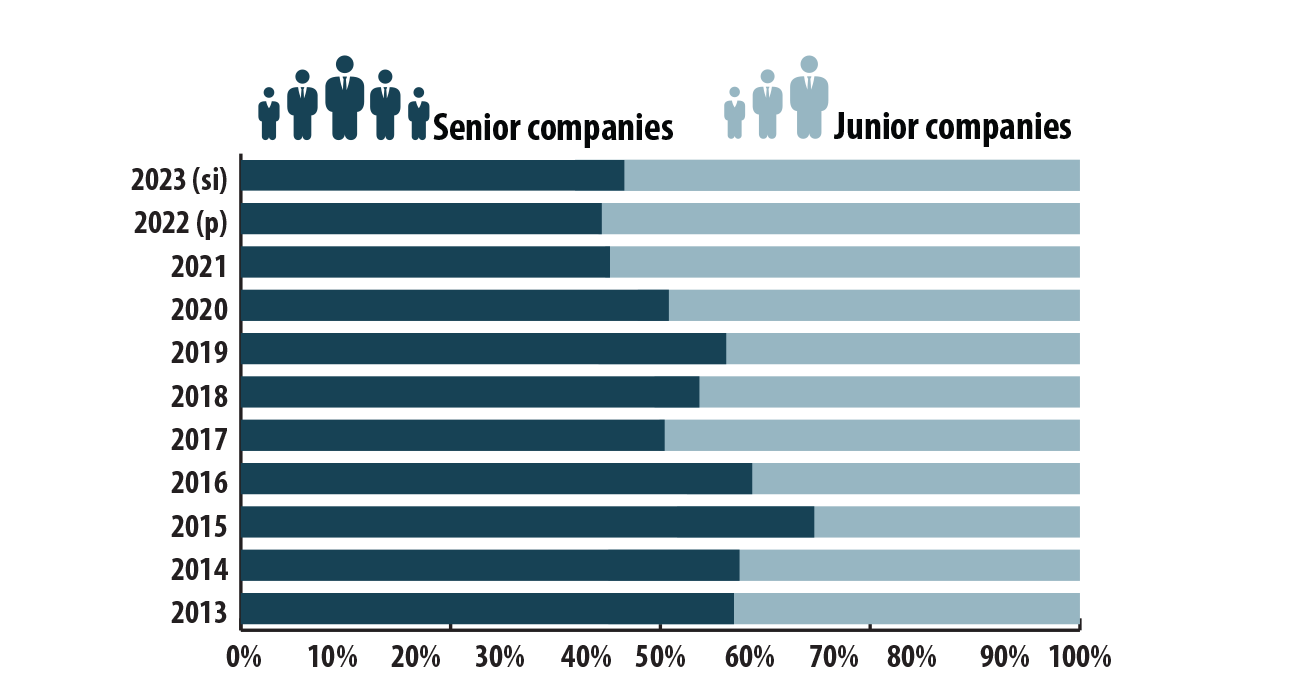
Text version
This bar graph shows the percentage distribution of exploration and deposit appraisal spending for junior and senior companies from 2013 to 2023 (si). Junior businesses accounted for 41% of spending in 2013 and increased in percentage at 57% in 2022. See the table Exploration and deposit appraisal expenditures, by junior and senior companies, 2013–2023 (si) for specific values by junior and senior companies for individual years
| Company type | 2013 | 2014 | 2015 | 2016 | 2017 | 2018 | 2019 | 2020 | 2021 | 2022 (p) | 2023 (si) |
|---|---|---|---|---|---|---|---|---|---|---|---|
| Senior companies | 1,388 | 1,203 | 1,265 | 996 | 1,109 | 1,364 | 1,329 | 1,122 | 1,673 | 1,760 | 1,717 |
| Junior companies | 964 | 814 | 578 | 633 | 1,076 | 1,121 | 957 | 1,070 | 2,106 | 2,307 | 2,031 |
| Total | 2,352 | 2,017 | 1,842 | 1,629 | 2,186 | 2,485 | 2,286 | 2,191 | 3,778 | 4,067 | 3,749 |
Learn more about Canadian mineral exploration.
 Canadian mining assets
Canadian exploration and mining companies are active across the globe. The extent of their presence can be determined by examining the value and location of Canadian mining assets.
In 2021, the total value of Canadian mining assets increased by 4% from the previous year, with the portion located in Canada increasing by 3%. Outside of Canada, the value of Canadian mining assets increased by 4%.
Key facts
- Canadian mining assets totalled $285.8 billion in 2021.
- Canadian mining assets abroad totalled $195.9 billion in 2021.
- In 2021, assets located abroad accounted for 69% of total assets.
Canada's presence abroad
In 2021, 68% of the value of Canadian mining assets abroad were in the Americas, where the value of assets increased by 5% from the previous year. In total, $196 billion in assets were in 97 foreign countries in 2021. The top 10 countries are presented in the following table.
| Ranking | Country | Percentage |
|---|---|---|
| 1 | United States | 21.1% |
| 2 | Chile | 12.7% |
| 3 | Panama | 7.7% |
| 4 | Brazil | 5.6% |
| 5 | Peru | 5.1% |
| 6 | Mexico | 5.0% |
| 7 | Zambia | 4.8% |
| 8 | Argentina | 4.4% |
| 9 | Mali | 3.9% |
| 10 | Democratic Republic of the Congo | 3.6% |
Canadian mining assets, 2020–2021 (p)
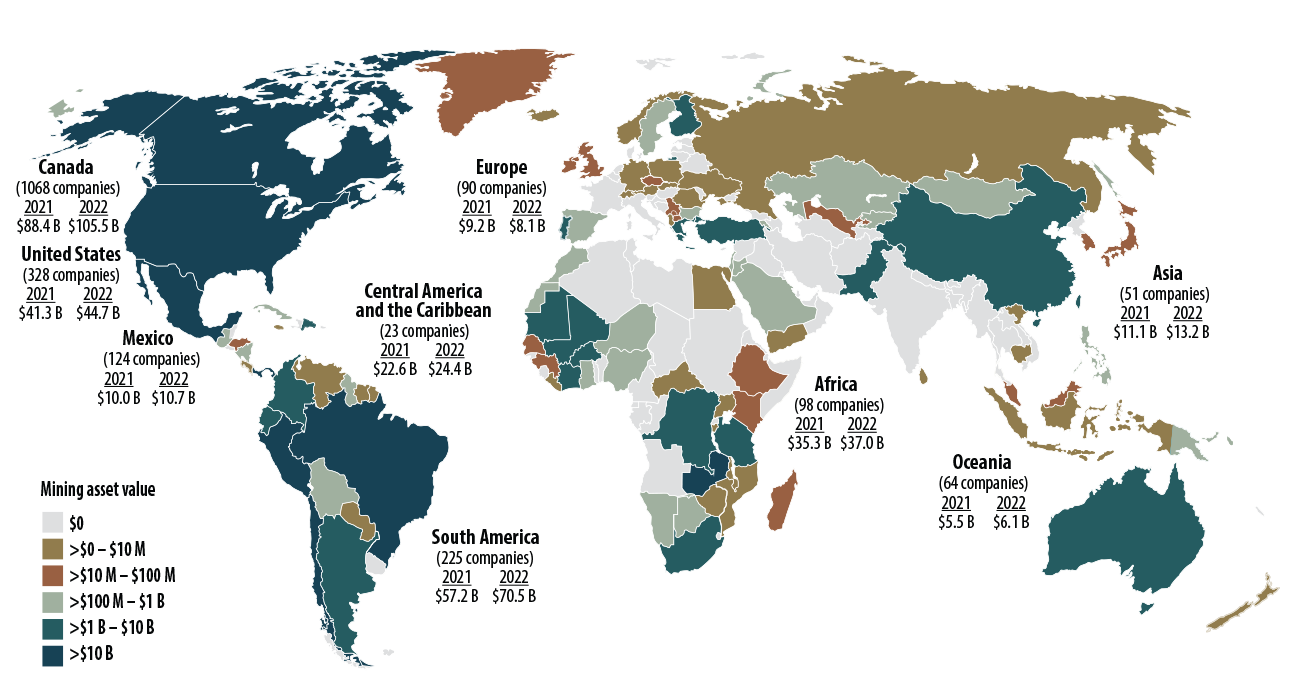
Text version
The countries on this map of the world are colour-coded to indicate a range of values for Canadian mining assets. For example, countries in light green have Canadian mining assets in the range of $100 million to $1 billion. The asset values are listed for each continent and individually for Canada, the United States and Mexico. See the table Canadian mining assets, by global region, 2020–2021 (p) for the specific values for each region.
| Region | 2020 | 2021 (p) | Change ($ billions) | Change (%) |
|---|---|---|---|---|
| Africa | 36.3 | 37.1 | 0.8 | 2.1 |
| Americas (except Canada) | 126.5 | 133.1 | 6.6 | 5.2 |
| Asia | 12.3 | 11.1 | -1.3 | -10.2 |
| Europe | 9.2 | 9.2 | 0.0 | 0.0 |
| Oceania | 5.4 | 5.5 | 0.1 | 1.9 |
| Canadian mining assets abroad | 189.7 | 195.9 | 6.2 | 3.3 |
| Canada | 85.1 | 89.9 | 4.8 | 5.6 |
| Total Canadian mining assets | 274.8 | 285.8 | 11.0 | 4.0 |
Learn more about the global presence of Canadian mining companies.
 Indigenous partnerships and participation
NRCan’s Lands and Minerals sector is committed to promoting Indigenous partnerships and participation in mineral exploration and mining activities by sharing information to support informed decision-making and promoting community capacity building.
Indigenous representation in the minerals sector has increased in the last decade, especially in the mining industry.
Key facts
- More than 17,300 Indigenous Peoples are employed in the minerals and metals sector.
- Indigenous people account for 11% of the upstream mining industry's labour force.
- Since 2000, 524 agreements between exploration and mining companies and Indigenous communities and governments have been signed.
Learn more about our tools and information products on Indigenous participation in exploration and mining.
Indigenous employment
Based on the 2021 census, over 17,300 Indigenous people were employed in Canada's mining and mineral processing industries. About half of the Indigenous employment was in the upstream mining subsector, where Indigenous Peoples accounted for 11% of the industry's labour force, more than double the all-industry average representation of 4%.
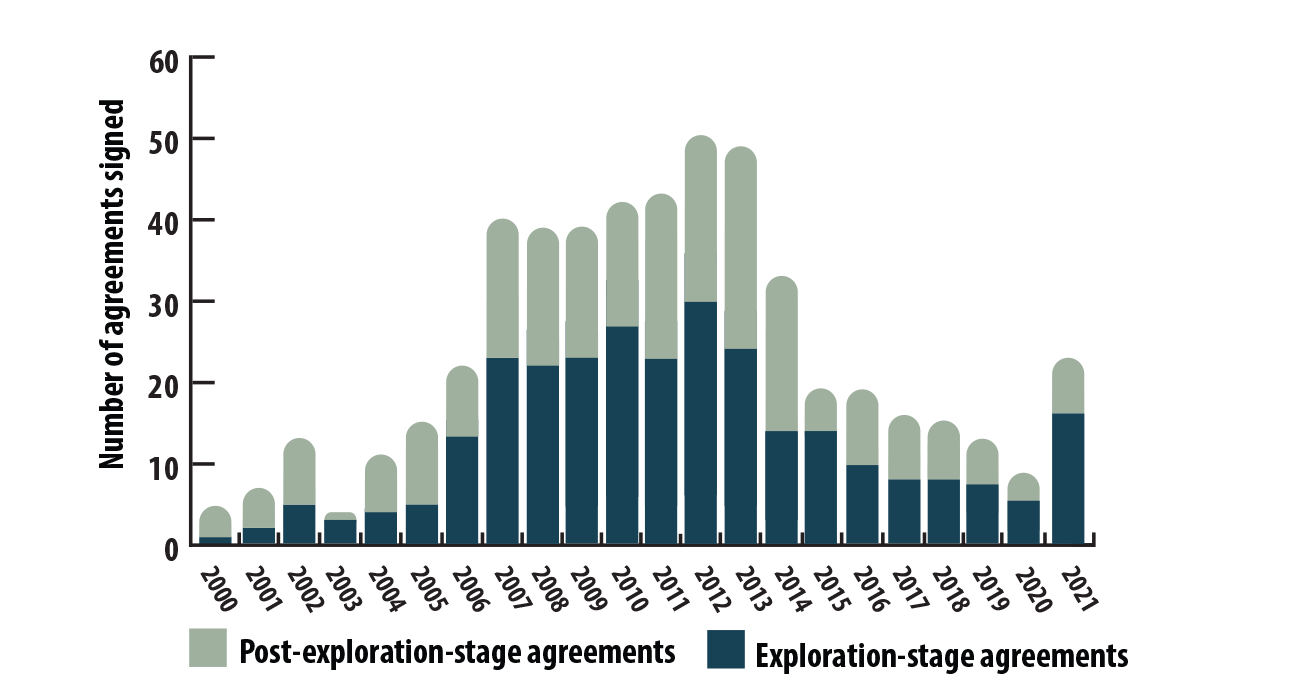
Agreements between companies and Indigenous peoples
Agreements between mineral exploration and mining companies and Indigenous communities or governments have helped secure benefits for many Indigenous communities and businesses and improved certainty for exploration and mining companies. Fostering the relationship between industry and Indigenous businesses builds the capacity for Indigenous businesses to capitalize on economic opportunities happening in or near their communities. It also allows industry to create reliable, local supply chains and the social licence to operate in a community.
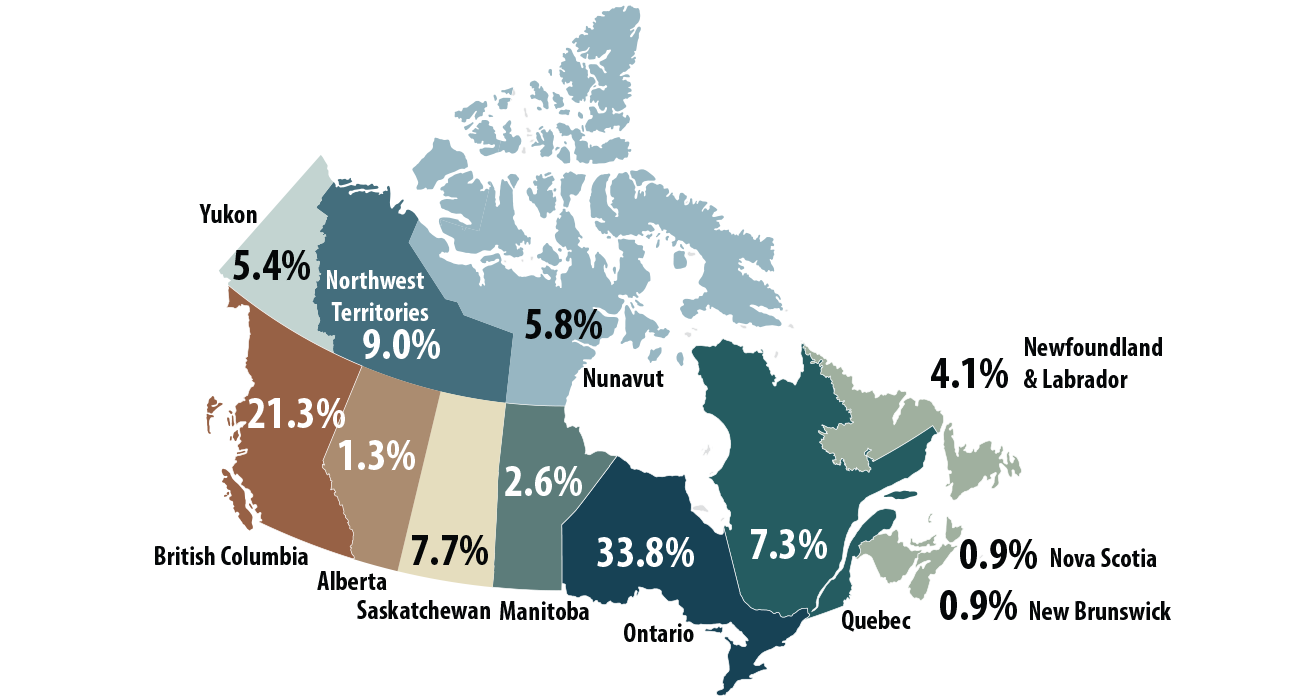
More than 586 agreements (active and expired agreements at the exploration, development and post-development stages) for 385 exploration and mining projects, have been signed since 1974. Approximately 465 of these agreements were still active in 2021. More than half of the active agreements are in Ontario (157) and British Columbia (99). Furthermore, there has been an increase in agreements for exploration, development and post-development stages:
- 51 prior to 2000
- 524 between 2000 and 2021
The increase is due to both a higher level of exploration and mining activity and a growing focus on building mutual understanding between Indigenous communities and the mining industry. However, for the past few years, there have been fewer agreements for exploration, development and post-development stages with the reduced number of projects.
Agreements signed by exploration and mining companies and Indigenous communities or governments, 2000–2021
Text version
This bar graph shows the number of agreements signed each year from 2000 to 2021 for exploration-stage and post-exploration-stage mining projects. It shows an increase in the number of agreements from 2000 to 2012. The number of agreements signed subsequently declined until 2018. In 2019, the number of agreements increased to 21, including 8 at the exploration stage and 13 at the post exploration stage. In 2020, the number of agreements signed decreased to 9, including 5 at the exploration stage and 4 at the post-exploration stage. In 2021, the number of agreements went up to 23, including 16 at the exploration stage and 7 at the post exploration stage.
Distribution of active agreements signed by exploration and mining companies and Indigenous communities or governments, by province and territory, 2021
Text version
This map of Canada shows the percentage of all active agreements between exploration and mining companies and Indigenous communities or governments in each province and territory in 2021.
| Province | Agreements | % |
|---|---|---|
| Ontario | 157 | 33.8% |
| British Columbia | 99 | 21.3% |
| Northwest Territories | 42 | 9.0% |
| Saskatchewan | 36 | 7.7% |
| Quebec | 34 | 7.3% |
| Nunavut | 27 | 5.8% |
| Yukon | 25 | 5.4% |
| Newfoundland & Labrador | 19 | 4.1% |
| Manitoba | 12 | 2.6% |
| Alberta | 6 | 1.3% |
| New Brunswick | 4 | 0.9% |
| Nova Scotia | 4 | 0.9% |
| Total | 465 | 100.0% |
 Nominal GDP in the minerals sector
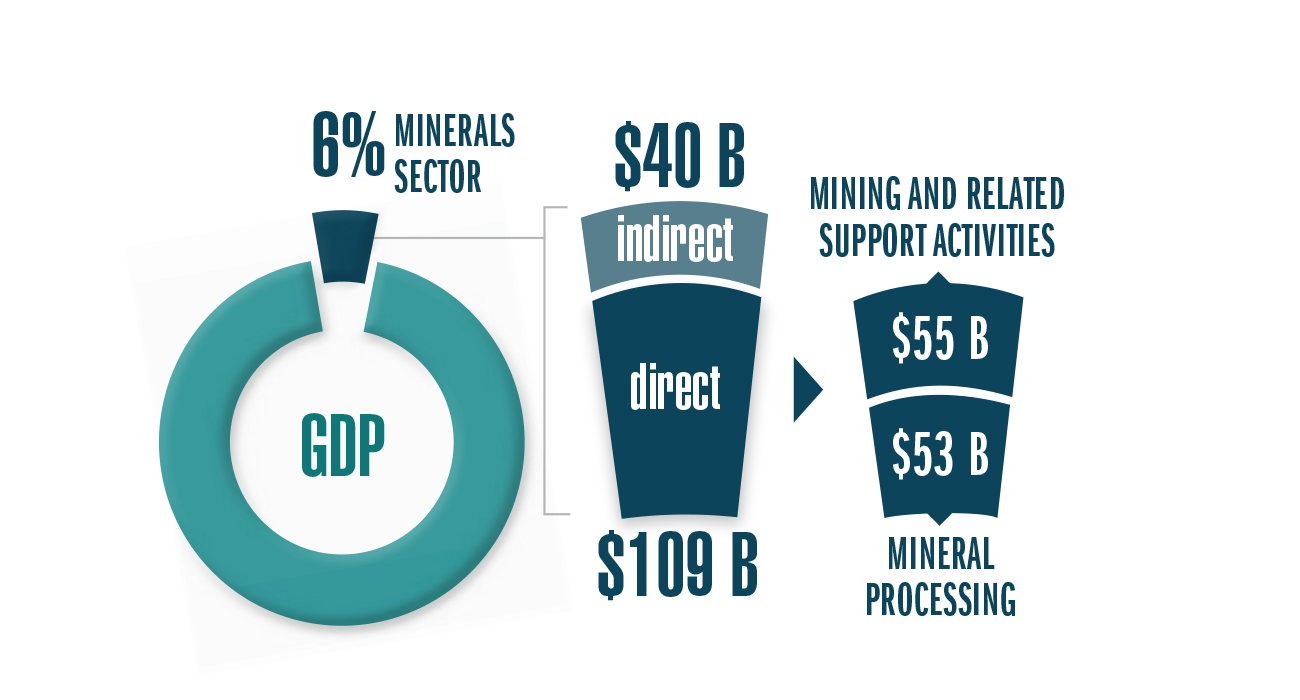
In 2022, the direct contribution of Canada's minerals and metals sector to Canada's gross domestic product (GDP) was $109 billion, which represented 6% of Canada's total GDP. The indirect effects from the minerals and metals sector added a further $40 billion to the GDP, for a total contribution of $149 billion.
Minerals sector contribution to Canada’s gross domestic product, 2022
Text version
This chart shows the direct and indirect contribution of the minerals and metals sector to Canada's gross domestic product (GDP) accounted for 6% of the total in 2022. Indirect GDP for the minerals sector was $40 billion, while direct was $109 billion. The direct value is further subdivided between mining and related support activities with $55 billion and minerals processing with $53 billion.
Minerals sector nominal gross domestic product, by subsector and product group, 2022
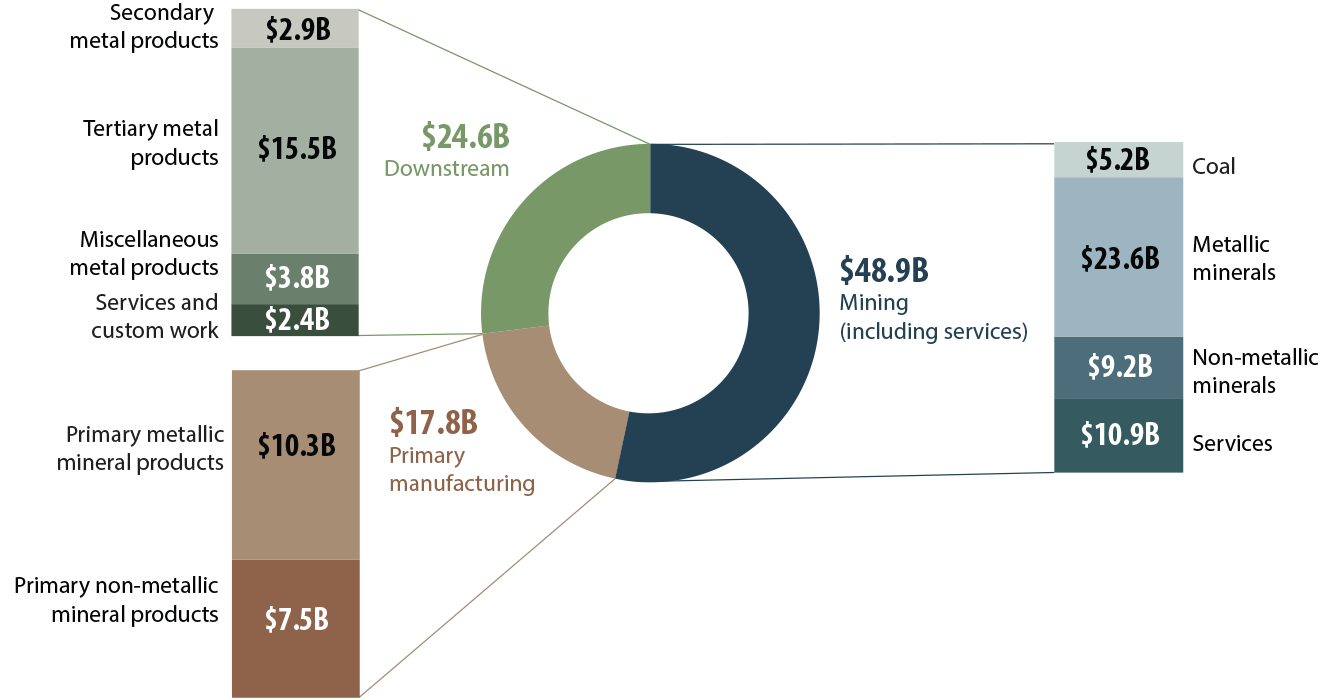
Text version
This chart shows the dollar value of direct GDP by subsector of the minerals sector for 2022. Stacked bars show a further breakdown by product group. Mining accounts for 51% of the values, followed by downstream manufacturing with 28% and primary processing with 21%.
 Employment in Canada's minerals sector
The minerals sector offers well-paid, high-quality jobs for Canadians across the country, including many in northern and remote locations.
In 2022, the minerals and metals sector directly employed 420,000 individuals and indirectly employed an additional 274,000, for a total of 694,000 individuals.
At $139,217, the average annual total compensation per job in the mining industry is almost twice the all-industry average of $72,641.
Minerals sector direct employment, by subsector and product group, 2022
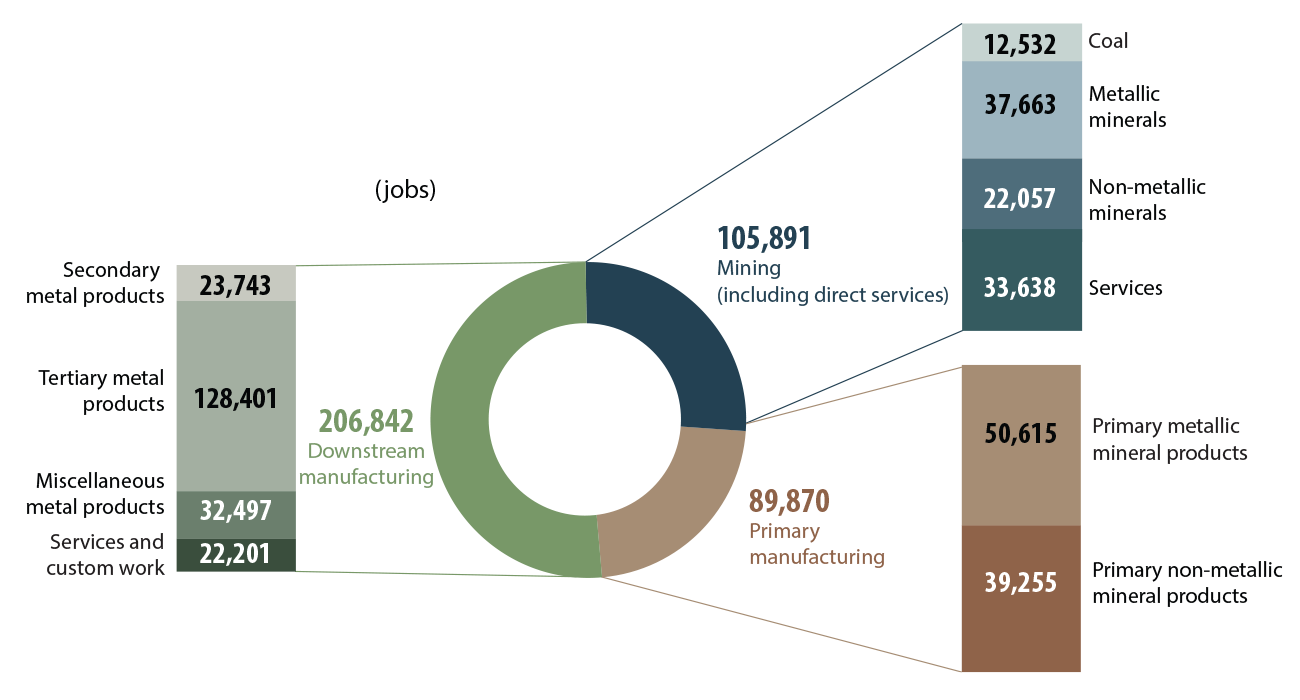
Text version
This chart shows the number of direct jobs in the subsectors of the minerals sector. Stacked bars show a further breakdown by product group for 2022. See the table Minerals sector employment, by subsector and product group, 2013–2022 for the specific values for each subsector and product.
- Employment by subsector, by product group and by year
- Employment by industry and by year
- Compensation per job, by industry and by year
Employment by subsector, by product group and by year
| Subsector/Commodity group | 2013 | 2014 | 2015 | 2016 | 2017 | 2018 | 2019 | 2020 | 2021 | 2022 |
|---|---|---|---|---|---|---|---|---|---|---|
| Metallic minerals | 37 | 36 | 32 | 36 | 36 | 38 | 38 | 36 | 38 | 41 |
| Non-metallic minerals | 21 | 21 | 22 | 22 | 23 | 24 | 24 | 23 | 24 | 25 |
| Coal | 9 | 7 | 6 | 7 | 7 | 7 | 10 | 8 | 9 | 13 |
| Total Extraction | 67 | 65 | 60 | 65 | 67 | 70 | 71 | 67 | 72 | 80 |
| Services | 37 | 31 | 29 | 29 | 29 | 29 | 33 | 31 | 34 | 38 |
| Primary metallic minerals products | 48 | 45 | 43 | 43 | 48 | 48 | 43 | 38 | 42 | 42 |
| Primary non-metallic minerals products | 46 | 46 | 48 | 45 | 46 | 46 | 48 | 43 | 49 | 51 |
| Total Primary manufacturing | 94 | 91 | 91 | 88 | 94 | 94 | 90 | 82 | 91 | 92 |
| Secondary metal products | 27 | 26 | 26 | 24 | 24 | 24 | 24 | 22 | 22 | 24 |
| Tertiary metal products | 127 | 131 | 127 | 124 | 125 | 130 | 134 | 120 | 126 | 130 |
| Miscellaneous metal products | 35 | 35 | 39 | 37 | 33 | 32 | 33 | 30 | 33 | 35 |
| Services and custom work | 21 | 22 | 22 | 22 | 21 | 22 | 21 | 19 | 20 | 21 |
| Total downstream manufacturing | 211 | 214 | 214 | 206 | 204 | 208 | 212 | 190 | 201 | 209 |
| Total minerals sector | 409 | 400 | 394 | 389 | 394 | 401 | 408 | 368 | 398 | 420 |
Employment by industry and by year
| Industry | 2013 | 2014 | 2015 | 2016 | 2017 | 2018 | 2019 | 2020 | 2021 | 2022 |
|---|---|---|---|---|---|---|---|---|---|---|
| Mining and quarrying (except oil and gas) | 71 | 69 | 63 | 68 | 71 | 74 | 75 | 71 | 74 | 76 |
| Mining-related support activities | 29 | 23 | 21 | 20 | 22 | 25 | 25 | 24 | 28 | 28 |
| Non-metallic mineral product manufacturing | 54 | 51 | 54 | 52 | 52 | 54 | 54 | 49 | 53 | 52 |
| Primary metal manufacturing | 65 | 63 | 63 | 61 | 63 | 62 | 61 | 57 | 65 | 69 |
| Fabricated metal product manufacturing | 164 | 167 | 161 | 159 | 158 | 163 | 169 | 149 | 163 | 172 |
| Total minerals sector | 382 | 373 | 363 | 361 | 366 | 378 | 384 | 350 | 383 | 398 |
Compensation per job, by industry and by year
| Industry | 2013 | 2014 | 2015 | 2016 | 2017 | 2018 | 2019 | 2020 | 2021 | 2022 |
|---|---|---|---|---|---|---|---|---|---|---|
| Mining and quarrying (except oil and gas) | 113,035 | 118,257 | 122,308 | 121,333 | 120,057 | 124,150 | 127,307 | 133,884 | 132,674 | 139,217 |
| Mining-related support activities | 104,501 | 109,160 | 110,040 | 105,336 | 107,369 | 111,141 | 112,216 | 119,233 | 122,654 | 129,165 |
| Non-metallic mineral product manufacturing | 68,292 | 71,765 | 74,899 | 74,166 | 76,426 | 79,133 | 80,253 | 85,884 | 87,863 | 93,187 |
| Primary metal manufacturing | 103,245 | 104,071 | 104,732 | 105,347 | 108,454 | 113,038 | 115,054 | 121,876 | 119,773 | 125,949 |
| Fabricated metal product manufacturing | 69,346 | 72,115 | 73,473 | 72,037 | 71,920 | 74,207 | 75,522 | 81,080 | 81,521 | 86,084 |
| Canadian all-industry average | 56,171 | 58,102 | 59,294 | 58,738 | 59,860 | 61,838 | 63,149 | 68,760 | 69,549 | 72,641 |
 Financing
The Toronto Stock Exchange (TSX) and TSX Venture Exchange (TSXV) are the world's primary listing venues for mining and mineral exploration companies, with more than 1,121 issuers in 2022, accounting for 40% of global listings.
In 2022, about 45% ($7.6 billion) of the world's total equity capital for these activities was raised by companies listed on the TSX or TSXV. This amount also accounted for 53% of the number of mining equity financings for mineral exploration and mining globally. Canada is number one globally in equity financing raised for mining and mineral exploration.
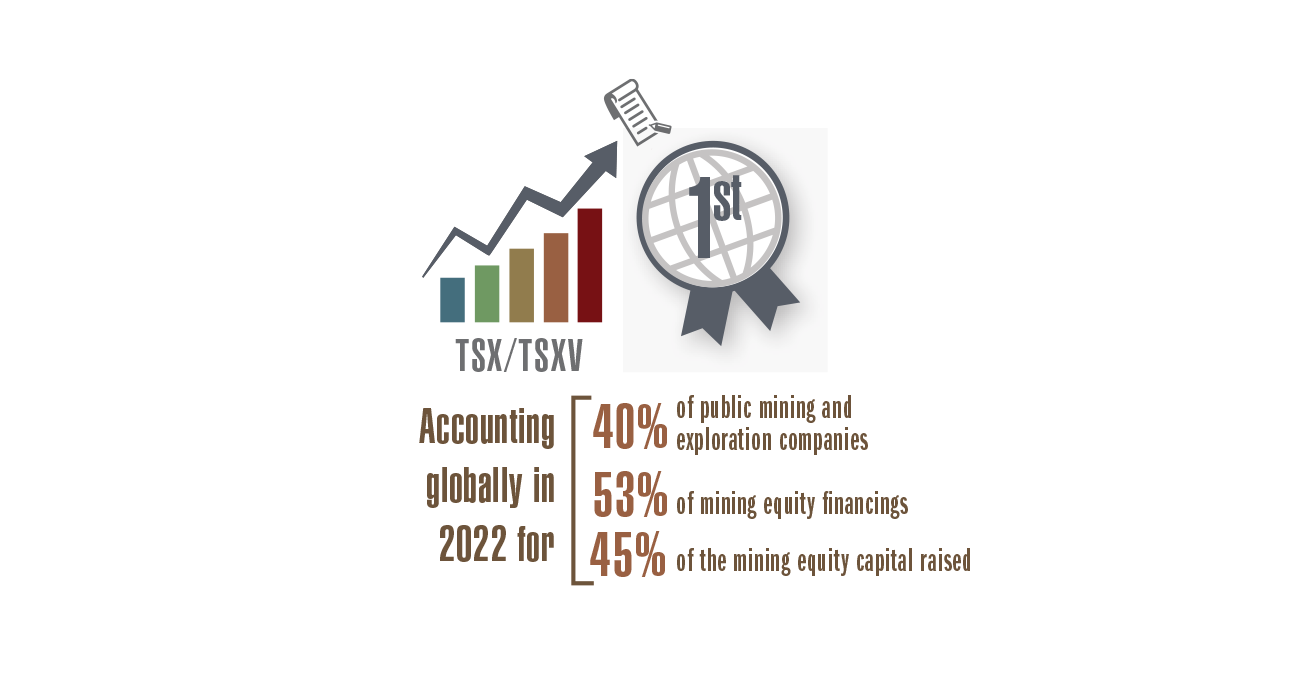
Text version
This graphic shows the Toronto Stock Exchange (TSX) and the TSX Venture Exchange (TSXV) as the world's primary listing venues for mining and mineral exploration companies. It also shows that these exchanges account for 40% of public exploration and mining companies, globally, and 53% of the financings, which raised 45% of the capital in 2022.
 Government revenues
In 2021, the mining and related support activities (mining and quarrying and support activities for mining) paid $5.4 billion in corporate income taxes and royalties. Mining taxes and royalties account for 71% of that amount, while the remainder is paid in the form of corporate income taxes to the federal, provincial and territorial governments.
Text version
This graphic illustrates the fact that Canadian governments receive taxes and royalties from the mining and select manufacturing sectors.
Read more on taxes relevant to the minerals and metals industries.
 Trade
Trade
In 2022, Canada's mineral imports and exports, which include ores, concentrates, and semi- and final-fabricated mineral products, recorded a balance of trade of over $31.1 billion.
| Trading partner | Domestic exports (excluding re-exports) |
Total exports |
Total imports |
Balance of trade |
|---|---|---|---|---|
| United States | 79.6 | 83.0 | 56.0 | 27.1 |
| United Kingdom | 12.9 | 13.1 | 0.9 | 12.2 |
| China | 10.5 | 10.6 | 16.2 | -5.7 |
| Japan | 6.9 | 6.9 | 1.8 | 5.1 |
| South Korea | 5.3 | 5.3 | 2.5 | 2.9 |
| Norway | 3.5 | 3.6 | 0.2 | 3.4 |
| Belgium | 3.3 | 3.3 | 0.7 | 2.6 |
| India | 3.1 | 3.1 | 2.1 | 1.0 |
| Switzerland | 3.0 | 3.0 | 0.9 | 2.1 |
| Brazil | 2.9 | 2.9 | 5.3 | -2.4 |
| Other countries | 22.1 | 22.9 | 40.2 | -17.3 |
| Total for Canada | 153.2 | 157.9 | 126.8 | 31.1 |
Exports
Valued at $153.2 billion in 2022, domestic mineral exports accounted for 26% of Canada's total merchandise exports.
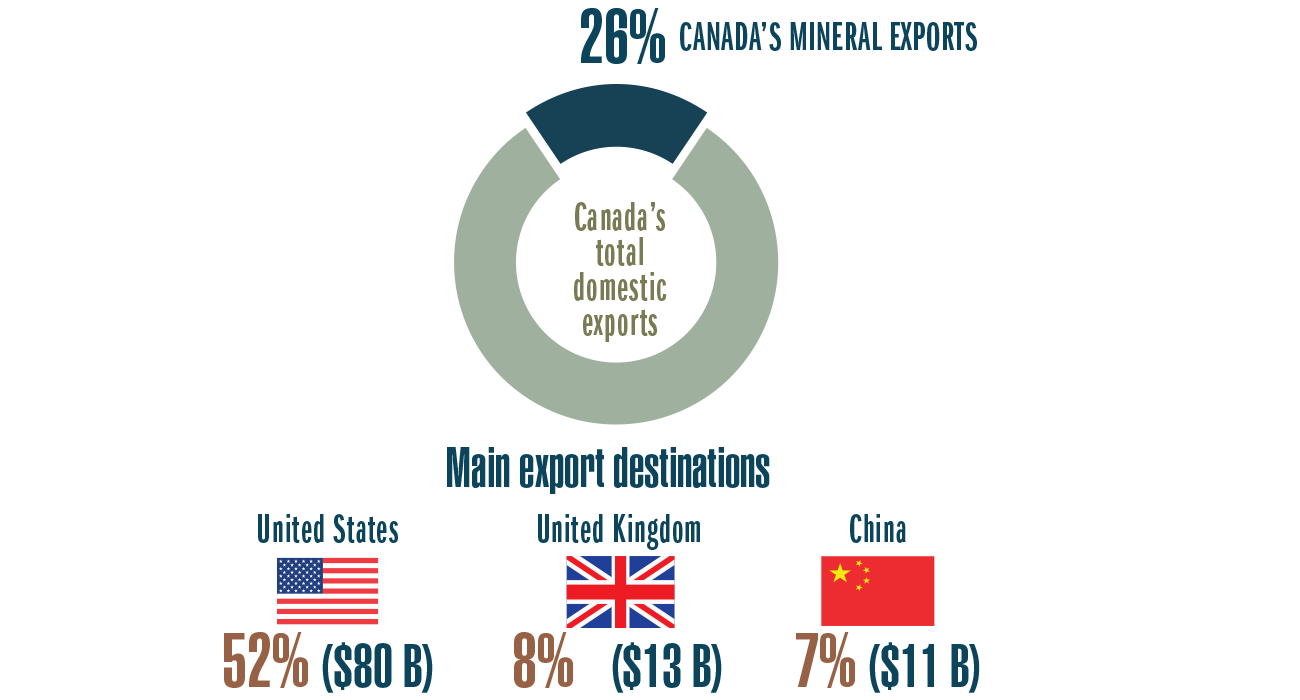
Text version
This graphic shows that domestic mineral exports account for 26% of total exports. It also shows Canada's main mineral export destinations as the United States, 52% ($80.0 billion); the United Kingdom, 8% ($12.9 billion), and China, 7% ($10.5 billion).
| Commodity | 2013 | 2014 | 2015 | 2016 | 2017 | 2018 | 2019 | 2020 | 2021 | 2022 |
|---|---|---|---|---|---|---|---|---|---|---|
| Gold | 17.7 | 17.9 | 17.6 | 18.4 | 18.6 | 17.3 | 22.3 | 23.6 | 21.4 | 22.3 |
| Iron and steel | 12.1 | 13.7 | 13.6 | 12.9 | 14.9 | 16.4 | 14.5 | 13.1 | 20.0 | 22.9 |
| Aluminum | 8.7 | 9.8 | 10.5 | 10.7 | 12.7 | 13.0 | 11.0 | 11.1 | 15.2 | 18.2 |
| Iron ore | 4.6 | 4.4 | 3.6 | 3.8 | 4.6 | 5.3 | 6.6 | 7.6 | 10.1 | 8.8 |
| Copper | 6.1 | 7.0 | 6.9 | 6.2 | 7.2 | 7.6 | 7.0 | 7.4 | 9.9 | 9.4 |
| Coal | 5.8 | 4.5 | 3.8 | 4.7 | 7.1 | 7.9 | 7.5 | 4.9 | 8.0 | 14.5 |
| Potash and potassium compounds | 5.8 | 5.2 | 6.9 | 4.7 | 5.1 | 6.4 | 6.6 | 6.1 | 7.1 | 16.4 |
| Nickel | 4.7 | 5.4 | 5.4 | 4.2 | 3.8 | 4.2 | 4.1 | 3.9 | 4.7 | 7.0 |
| Platinum group metals | 0.4 | 0.6 | 1.2 | 1.2 | 0.8 | 1.2 | 1.6 | 2.7 | 3.7 | 3.0 |
| Zinc | 1.5 | 1.6 | 1.7 | 1.8 | 2.1 | 2.6 | 2.3 | 2.0 | 2.3 | 2.4 |
| All other minerals | 19.3 | 19.4 | 20.8 | 20.1 | 20.5 | 22.4 | 22.5 | 20.3 | 24.5 | 28.1 |
| Grand Total | 86.9 | 89.5 | 91.9 | 88.6 | 97.3 | 104.3 | 106.0 | 102.6 | 127.0 | 153.2 |
Learn more about Canada's mineral imports and exports.
 Minerals sector investment
In 2022, the minerals sector invested $17.7 billion in new capital construction and in machinery and equipment, accounting for 6% of the Canadian total.
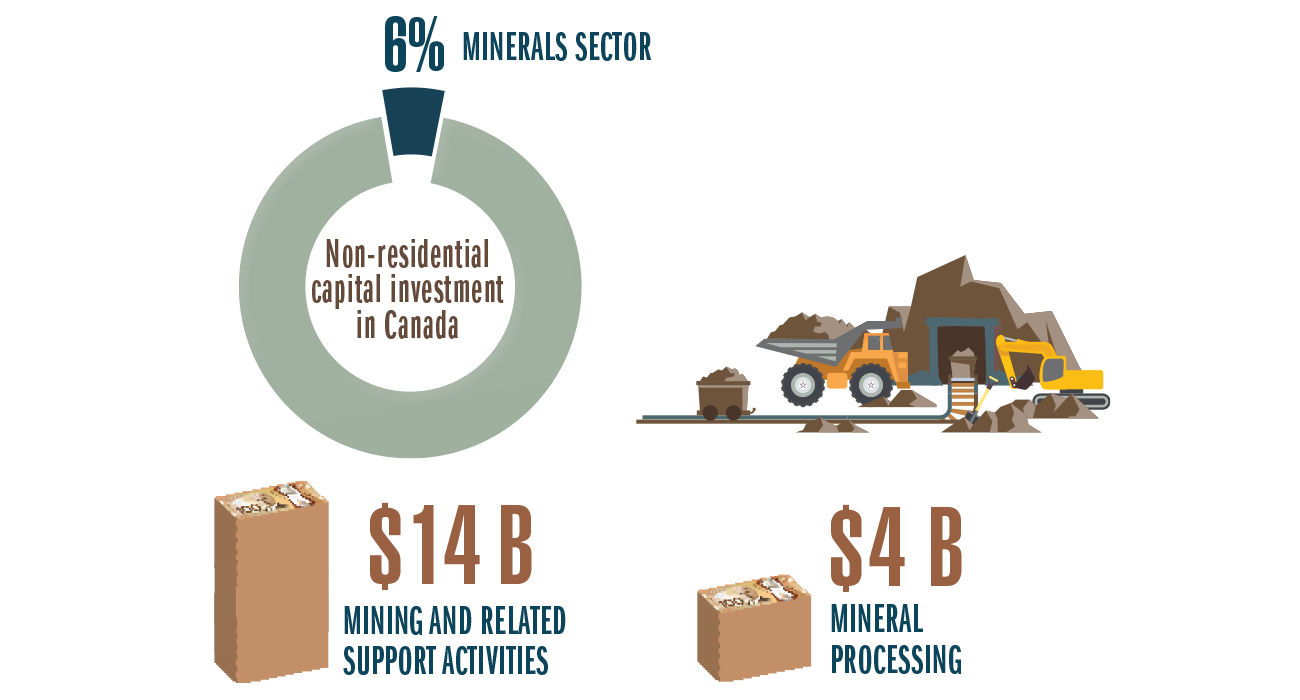
Text version
This graphic shows the minerals sector accounts for 6% of non-residential capital investment in Canada, with investments of $17.7 billion in new capital construction (mining and related support activities, $14 billion; mineral processing, $4 billion).
| Industry | 2013 | 2014 | 2015 | 2016 | 2017 | 2018 | 2019 | 2020 | 2021 | 2022 (p) | 2023 (si) |
|---|---|---|---|---|---|---|---|---|---|---|---|
| Mining and quarrying (except oil and gas) | 15.1 | 11.1 | 10.2 | 9.6 | 9.0 | 10.0 | 10.9 | 9.5 | 11.5 | 13.1 | 15.8 |
| Mining-related support activities | 0.7 | 0.4 | 0.4 | 0.2 | 0.2 | 0.3 | 0.3 | 0.2 | 0.4 | 0.4 | 0.6 |
| Non-metallic mineral product manufacturing | 0.5 | 1.0 | 1.1 | 1.2 | 0.9 | 0.6 | 0.7 | 0.6 | 0.8 | 0.6 | 0.6 |
| Primary metal manufacturing | 3.5 | 3.3 | 3.2 | 2.3 | 1.5 | 1.8 | 2.3 | 1.8 | 1.7 | 2.6 | 3.1 |
| Fabricated metal product manufacturing | 0.6 | 0.6 | 0.7 | 0.7 | 0.9 | 0.9 | 1.1 | 0.9 | 1.1 | 1.0 | 1.3 |
| Total | 20.3 | 16.5 | 15.7 | 14.1 | 12.6 | 13.6 | 15.3 | 13.0 | 15.5 | 17.7 | 21.4 |
Learn more about capital investment by Canada's minerals sector.
Major natural resource projects
In 2022, current and potential investment in major mining-related projects (e.g. mine constructions, redevelopments, expansions and processing facilities) over the next 10 years was estimated at $88.3 billion in capital expenditures, across 124 projects, compared with $88.8 billion and 119 projects in 2021.
Learn more about major natural resource projects that are planned and under construction over the next 10 years.
Notes and sources
(p) preliminary
(si) spending intentions
(r) revised
Totals may be different because of rounding.
Mineral production
- Canada's mineral production, global ranking
- Natural Resources Canada; Statistics Canada; U.S. Geological Survey;
World Nuclear Association; Kimberley Process Rough Diamond Statistics
- Natural Resources Canada; Statistics Canada; U.S. Geological Survey;
- Mineral production, by commodity group, 2013–2022 (p)
- Natural Resources Canada; Statistics Canada
- Leading minerals, by value of production, 2022 (p)
- Natural Resource Canada; Statistics Canada
Mineral exploration
- Exploration and deposit appraisal expenditures and metals and minerals price index, 2003–2023 (si)
- Natural Resources Canada, based on the annual Survey of Exploration, Deposit Appraisal and Mine Complex Development Expenditures
- Annual Bank of Canada commodity price index, Metals and Minerals
- Exploration and deposit appraisal percentage of expenditures, by mineral commodity group, 2013 and 2022 (p)
- Natural Resources Canada, based on the annual Survey of Exploration, Deposit Appraisal and Mine Complex Development Expenditures
- "Precious metals" include gold, silver and platinum group metals (iridium, osmium, palladium, platinum, rhodium and ruthenium). "Base metals" refers to non-ferrous metals such as copper, lead, nickel and zinc. "Other metals" refers to all other metals not captured under the precious metals, base metals, uranium and iron ore categories.
- Exploration and deposit appraisal expenditures, by mineral commodity group, 2013–2023 (si)
- Natural Resources Canada, based on the annual Survey of Exploration, Deposit Appraisal and Mine Complex Development Expenditures
- "Precious metals" include gold, silver and platinum group metals (iridium, osmium, palladium, platinum, rhodium and ruthenium). "Base metals" refers to non-ferrous metals such as copper, lead, nickel and zinc. "Other metals" refers to all other metals not captured under the precious metals, base metals, uranium and iron ore categories.
- Exploration and deposit appraisal expenditures, by province and territory, 2021–2023 (si)
- Natural Resources Canada, based on the annual Survey of Exploration, Deposit Appraisal and Mine Complex Development Expenditures
- Exploration and deposit appraisal activities include all activities carried out to search for, discover, characterize and define in detail a mineral deposit for the pre-feasibility and final feasibility studies that will support a production decision and the investment required. Expenditures include on-mine-site and off-mine-site activities, fieldwork, overhead costs, engineering, economic and pre-production or production feasibility studies, and environment and land access costs.
- Exploration and deposit appraisal share of expenditures, by junior and senior companies, 2013–2023 (si)
- Natural Resources Canada, based on the annual Survey of Exploration, Deposit Appraisal and Mine Complex Development Expenditures
- Exploration and deposit appraisal expenditures, by junior and senior companies, 2013–2023 (si)
- Natural Resources Canada, based on the annual Survey of Exploration, Deposit Appraisal and Mine Complex Development Expenditures
Canadian mining assets
- Share of Canadian mining assets abroad, by country, 2021 (p)
- Natural Resources Canada
- Canadian mining assets, 2020–2021 (p)
- Natural Resources Canada
- Canadian mining assets, by global region, 2020–2021 (p)
- Natural Resources Canada
- Canadian mining asset values are those reported in company financial reports, nearest to December 31, 2021, for public companies headquartered in Canada that are not under foreign control. Mining assets, in this context, reflect non-current assets. Such assets include mineral properties, deferred mineral exploration expenses, royalties, investments in non-Canadian mining companies, and other non-current assets related to mining that can be reconciled to a specific geographic location. Canadian mining assets include values for all countries including Canada, while Canadian mining assets abroad include values for all countries except Canada.
Indigenous partnerships and participation
- Agreements signed by exploration and mining companies and Indigenous communities or governments, 2000–2021
- Natural Resources Canada
- Distribution of active agreements signed by exploration and mining companies and Indigenous communities or governments, by province and territory, 2021
- Natural Resources Canada
- The Indigenous representation and employment numbers presented in this section are from Statistics Canada's 2021 Census.
- Active agreements signed by exploration and mining companies and Indigenous communities or governments, by province and territory, 2021
- Natural Resources Canada
Nominal GDP in the minerals sector
- Minerals sector contribution to Canada’s gross domestic product, 2022
- Statistics Canada, Natural Resources Satellite Account, Table 36-10-0434-03
- Minerals sector nominal gross domestic product, by subsector and product group, 2022
- Statistics Canada, Natural Resources Satellite Account, Table 38-10-0285-01
Employment in Canada's minerals sector
- Minerals sector direct employment, by subsector and product group, 2022
- Statistics Canada, Natural Resources Satellite Account, annual average, Table 38-10-0285-01
- Minerals sector employment, by subsector and product group, 2013–2022
- Statistics Canada, Natural Resources Satellite Account, annual average, Table 38-10-0285-01
- Minerals sector employment, by industry, 2013–2022
- Statistics Canada, System of National Accounts, Table 36-10-0489-01
- Minerals sector average annual total compensation per job, by industry, 2013–2022
- Statistics Canada, System of National Accounts, Table 36-10-0489-01
- Indirect jobs
- Estimated by Statistics Canada
Trade
- Canadian mineral trade, by trading partner, 2022
- Natural Resources Canada; Statistics Canada
- Exports
- Natural Resources Canada; Statistics Canada
- Canadian domestic mineral exports, by commodity, 2013–2022
- Natural Resources Canada; Statistics Canada
- Mineral trade includes ores, concentrates, and semi- and final-fabricated mineral products.
Minerals sector investment
- Minerals sector capital expenditures, by industry, 2013–2023 (si)
- Natural Resources Canada; Statistics Canada, Table 34-10-0035-01
Minerals and metals sector
The minerals and metals sector (or minerals sector) refers to the following North American Industry Classification System (NAICS) industries:
- Mining:
- NAICS 212 – mining and quarrying (except oil and gas)
- Mining-related support activities:
- NAICS 213117 – contract drilling (except oil and gas)
- NAICS 213119 – other support activities for mining, including mineral exploration
- Mineral processing:
- NAICS 327 – non-metallic mineral product manufacturing
- NAICS 331 – primary metal manufacturing
- NAICS 332 – fabricated metal product manufacturing
The mining-related support activities subsector includes exploration and drilling companies and service companies operating on a fee or contract basis. It does not include all mining industry suppliers because some entities service multiple sectors (e.g. transportation, construction, finance and legal).
The GDP and employment values are based on the Statistics Canada Natural Resources Satellite Account (NRSA), which estimates the contribution of resource-related activities to the Canadian economy. The NRSA defines natural resource activities as products and services originating from naturally occurring assets, such as minerals, used in economic activity. In this way, the NRSA goes beyond an industry perspective of natural resources and seeks to identify natural resource activities and products within the Canadian economy. For the NRSA-based indicators, the minerals and metals sector includes activities involved in:
- Extracting and initial processing of mineral products (also referred to as primary production):
- Extraction of coal, metallic minerals (e.g. copper, gold, lead, nickel, silver and zinc), and non-metallic minerals (e.g. diamonds, potash, salt and stone)
- Services for mining and quarrying, and exploration
- Primary metallic mineral products (e.g. aluminum and aluminum-alloy ingots and billets, iron and steel basic shapes, ferro-alloy products, and refined precious and base metals)
- Primary non-metallic mineral products (e.g. clay products, glass and glass products, and cement)
- Downstream processing and manufacturing of metal products, which use a large portion of metal products as inputs:
- Secondary metal products (e.g. iron and steel pipes and foundry products)
- Tertiary metal products (e.g. cutlery and forged and stamped products)
- Miscellaneous metal products (e.g. communication and energy wire and cable, and motor vehicle metal stamping)
- Services and custom work (e.g. coating, engraving and heat treating)
For more information on the NRSA, consult Statistics Canada, The Natural Resources Satellite Account: Feasibility Study.
Page details
- Date modified: