
Capital Expenditures Information Bulletin
(published in May 2026)
Mining is a capital-intensive industry with large-scale projects that are often valued in billions of dollars and can span multiple years.
A capital expenditureFootnote 1 (CAPEX) involves building or upgrading assets, such as mines, machinery, and equipment, which benefit a company over an extended period. Because these assets contribute to sustaining or growing future mineral and metal production, information on capital spending can be a useful indicator of how industry views future market demand in relation to present supply capacity.
Find out about Canada’s minerals sector CAPEX and its spending intentions:
- Overview
- Capital expenditures in the upstream mining industry
- Capital expenditures in the metals, non-metallic minerals, and coal mining subsectors
- Capital expenditures in the downstream mineral-processing industries
- Spending breakdown by province and territory
- Spending by company type
Overview
In 2025, CAPEX for Canada’s broader minerals sectorFootnote 2 fell by 4% to $23.1 billion, reflecting volatility across several battery and base metal markets. Nickel and lithium prices declined for most of the year as global supply growth outpaced demand. In contrast, copper and aluminum markets strengthened amid supply constraints and rising demand linked to the expansion of electrical grids and digital infrastructure (e.g., data centres).
Looking ahead to 2026, CAPEX is expected to recover modestly, with projected growth of 5% to $24.2 billion. This rebound is primarily driven by increased investment in gold and copper mining.
Trends in minerals sector CAPEX are largely driven by the upstream mining industry, the most capital-intensive segment of the sector. Over the medium term, demand for minerals and metals is expected to be supported by a range of structural factors, including infrastructure development, increased defence spending, ongoing electrification, and the expansion of digital technologies. These trends are expected to require sustained investment to maintain and expand production capacity, while potential supply constraints could place upward pressure on prices.
Although inflation has eased from its 2022 peak, elevated costs for labour, materials, energy, and equipment continue to constrain the reach of mining development spending.
Figure 1: Capital expenditures in the minerals sector and non-residential structures, machine and equipment price index, 2016 to 2026
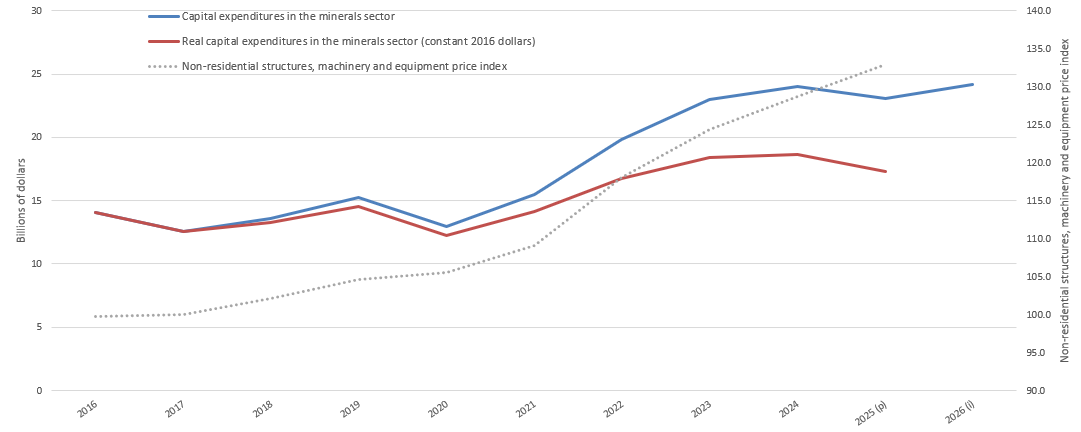
Text version — Figure 1
This line graph shows the trend in CAPEX in the minerals sector in constant and current dollars in relation to the evolution of the non-residential structures, machinery and equipment price index. The graph illustrates the impact of the index on CAPEX.Footnote 5
Sources: Natural Resources Canada, Bank of Canada, Statistics Canada
Figure 2: Minerals sector capital expenditures, by subsector, 2025 (p)
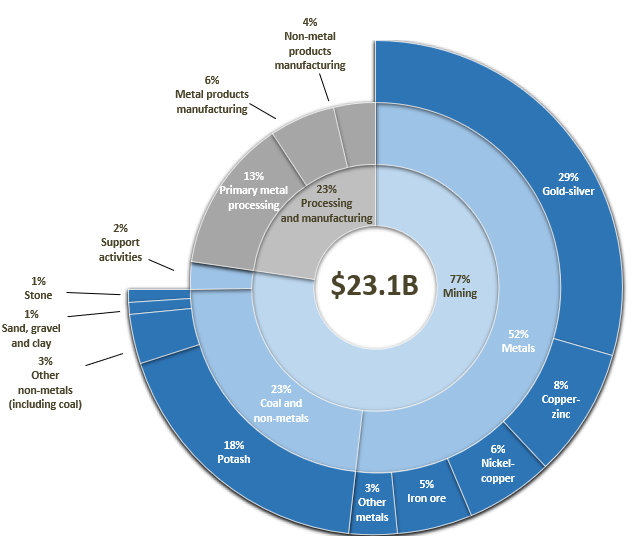
Text version — Figure 2
| Sector | Value |
|---|---|
| Mining | 17,254.0 |
| Metals | 11,925.0 |
| Gold-silver | 6,790.2 |
| Iron ore | 1,144.6 |
| Nickel-copper | 1,321.5 |
| Copper-zinc | 1,944.2 |
| Other metals | NA |
| Coal and non-metals | 5,328.5 |
| Potash | 4,223.7 |
| Other non-metals (including coal) | 1,104.8 |
| Sand, gravel and clay | 187.9 |
| Stone | 182.4 |
| Support activities | 549.3 |
| Processing and manufacturing | 5,247.4 |
| Primary metal processing | 3,082.9 |
| Metal products manufacturing | 1,335.8 |
| Non-metal products manufacturing | 828.7 |
| Minerals sector | 23,050.7 |
Sources: Natural Resources Canada, Statistics Canada
B = billion, p = preliminary expenditures, NA = not available
Capital expenditures in the upstream mining industry
In 2025, CAPEX in Canada’s mining and quarrying (excluding oil and gas)Footnote 2industry declined by 2% to $17.2 billion. Spending intentions for 2026 point to a modest recovery, with CAPEX expected to increase by 7% to $18.5 billion.
Market balance and price trends are key drivers of CAPEX decisions in the mining industry, reflecting underlying market supply and demand conditions.
When market conditions are weak and access to financing is constrained, companies typically prioritize capital discipline and defer investment. Conversely, when demand and price expectations strengthen, firms increase spending to expand production capacity and improve future cash flow.
In 2025, metal prices experienced renewed volatility amid geopolitical uncertainty and evolving trade dynamics. At the same time, supply expansions and uneven demand growth continued to weigh on certain commodities.
Prices for battery metals such as nickel and lithium moderated for most of 2025 amid increased global supply, tighter financing conditions, and slower-than-expected growth in some segments of electric vehicle demand. Nevertheless, longer-term demand for many minerals remains supported by infrastructure investment, electrification, defence-related demand, and industrial policy developments.
Figure 3: Minerals sector capital expenditures, by subsector, and metals and minerals price index, 2016 to 2026
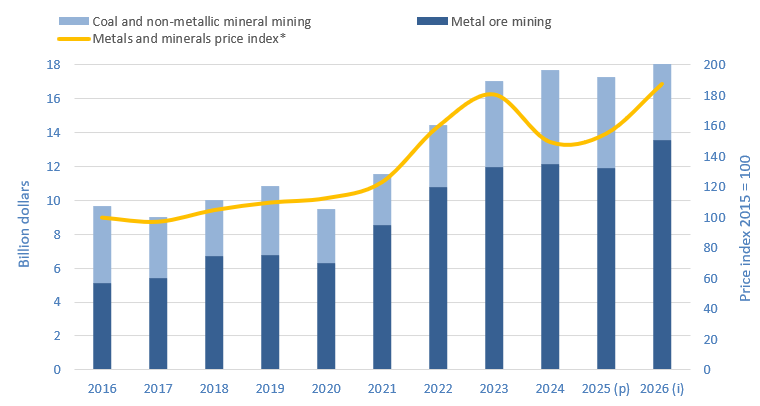
Text version — Figure 3
| Year | Metal ore mining | Coal and non-metallic mineral mining | Metals and minerals price index (2015 = 100)* |
|---|---|---|---|
| 2016 | 5.1 | 4.5 | 100.0 |
| 2017 | 5.4 | 3.6 | 97.3 |
| 2018 | 6.7 | 3.3 | 104.9 |
| 2019 | 6.8 | 4.1 | 109.8 |
| 2020 | 6.3 | 3.1 | 112.6 |
| 2021 | 8.5 | 3.0 | 123.1 |
| 2022 | 10.8 | 3.7 | 159.4 |
| 2023 | 12.0 | 5.1 | 180.3 |
| 2024 | 12.1 | 5.6 | 149.3 |
| 2025 (p) | 11.9 | 5.3 | 154.7 |
| 2026 (i) | 13.5 | 5.0 | 187.2 |
Sources: Natural Resources Canada, Bank of Canada, Statistics Canada
p = preliminary expenditures, i = spending intentions.
*The metals and minerals price index is presented with a one-year lag.
Metal prices surged in early 2022 following Russia’s invasion of Ukraine, driven by supply disruptions, sanctions, and market uncertainty, particularly for commodities such as nickel, aluminum, palladium, and potash. This followed a sharp decline in 2020 due to the COVID-19 pandemic, when reduced global demand pushed prices down before rebounding to above pre-pandemic levels as demand recovered and supply remained constrained.
Since 2021, CAPEX in the mining sector has recovered to pre-pandemic levels, although part of this increase reflects cost inflation rather than real increases in activity. More broadly, capital spending has trended downward since the early 2010s, reaching a low in 2017, before partially recovering and declining again in 2020.
Looking ahead, Canada’s project pipeline highlights the scale of potential future investment in the mining sector.
Natural Resources Canada’s Major Projects Inventory lists 132 planned or proposed mining-related projects over the next 10 years (2025–35) across Canada. These projects, which include mine constructions, redevelopments, expansions, and processing facilities, represent a potential investment of $122.6 billion.
Learn about major natural resource projects currently under construction or planned within the next 10 years.
Capital expenditures in the metals, non-metallic minerals, and coal mining subsectors
In 2025, CAPEX within the metal mining subsector declined by 2% to $11.9 billion, with mixed performance across commodities.
Spending intentions for 2026 indicate a 14% increase to $13.5 billion.
- The rise is driven in part by gold, supported by record prices and continued investor interest. Several gold mining projects advanced or entered production in 2025, including Lynn Lake, Valentine, Elk, Blackwater, Dome Mountain, and Goose, indicating continued momentum in the precious metals segment.
- CAPEX for copper is also expected to rise, supported by tight supply and increasing demand. In Canada, activity includes ongoing development at polymetallic projects such as the Onaping Depth mine in Ontario (nickel–copper–cobalt), expansion projects such as Red Chris and Copper Mountain in British Columbia, and the McIlvenna Bay project in Saskatchewan.
Figure 4: Capital expenditures in metals mining subsector, 2024 to 2026
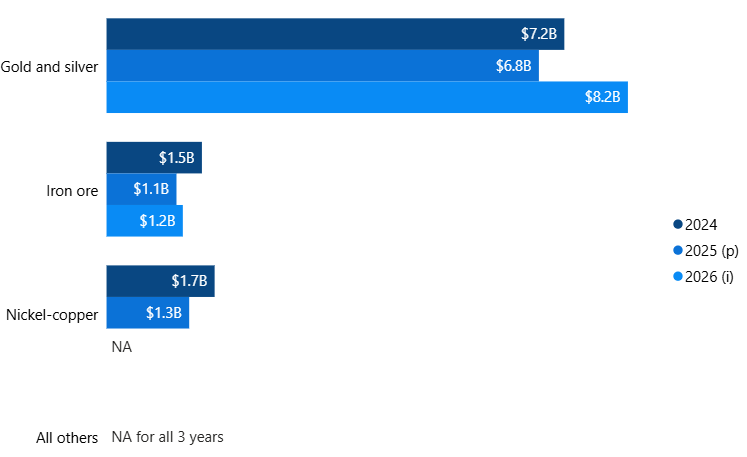
Text version — Figure 4
In 2025, gold and silver ore mining, which accounted for 57% of this subsector’s CAPEX, experienced a 5% decline to $6.8 billion. Nickel-copper ore mining, which represented 11%, saw a 23% decrease to $1.3 billion. In contrast, iron ore mining, which accounted for 10%, recorded a significant 25% decrease to $1.1 billion. Copper-zinc ore mining accounted for 16%, with its share of these expenditures totalling $1.9 billion; however, the 2024 value is not available for comparison.
Sources: Natural Resources Canada, Statistics Canada
B = billion, p = preliminary expenditures, i = spending intentions, NA = not available, suppressed by Statistics Canada
In 2025, CAPEX in the coal and non-metallic minerals mining subsectors decreased by 4% to $5.3 billion. This decline was primarily driven by lower investment in coal and other non-metal mining category, but was partially offset by increased spending in potash.
- Potash mining, which accounted for approximately 79% of the subsector’s CAPEX in 2025, increased by 36% to $4.2 billion. A key driver is BHP’s Jansen project in Saskatchewan, approved in 2021 at $7.5 billion and later revised to approximately $11.7 billion by early 2026, making it one of the largest mining investments in Canada’s history. Production is expected in mid-2027.
- In contrast, CAPEX in coal and other non-metallic minerals mining declined by 55% to $1.1 billion in 2025 but is expected to recover by 36% to $1.5 billion in 2026.
Overall, CAPEX in the coal and non-metals subsectors is expected to decrease by 7% in 2026 to $5.0 billion, largely due to declining investment in potash as major projects approach completion. Canada remains the world’s leading producer of potash.
Figure 5: Capital expenditures in coal and non-metallic minerals mining subsectors, 2024 to 2026
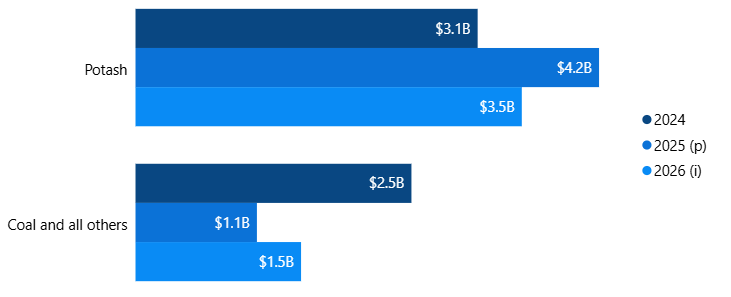
Text version — Figure 5
In 2025, potash mining, which accounted for 80% of this subsector’s CAPEX, experienced a 35% increase to $4.2 billion. Coal and all other non-metal mining, which represented 20%, saw a 56% decrease to $1.1 billion. Potash mining is expected to decrease by 17% to $3.5 billion in 2026, whereas coal and all other non-metal mining is expected to increase by 36% to $1.5 billion.
Sources: Natural Resources Canada, Statistics Canada
B = billion, p = preliminary expenditures, i = spending intentions
Capital expenditures in the downstream mineral-processing industries
In 2025, CAPEX within Canada’s downstream mineral-processing industriesFootnote 2 declined by 10% to $5.2 billion.
CAPEX in the primary metal manufacturing industry, which accounted for 59% of downstream spending, decreased by 8% to $3.1 billion. This segment includes facilities involved in smelting and refining ferrous and non-ferrous metals such as aluminum, copper, nickel, and gold.
CAPEX in fabricated metal products manufacturing declined by 10%, while spending in non-metallic mineral products manufacturing decreased by 17% to $828 million. These industries include establishments engaged in processes such as forging, stamping, forming, and assembly, including of iron and steel products, which were affected by new United States tariffs introduced in 2025.
Spending intentions for 2026 indicate a further 10% decline in CAPEX to $4.7 billion, with decreases expected across all three industries, including a 13% decline in primary metal manufacturing.
Figure 6: Capital expenditures in downstream mineral-processing industries, 2024 to 2026
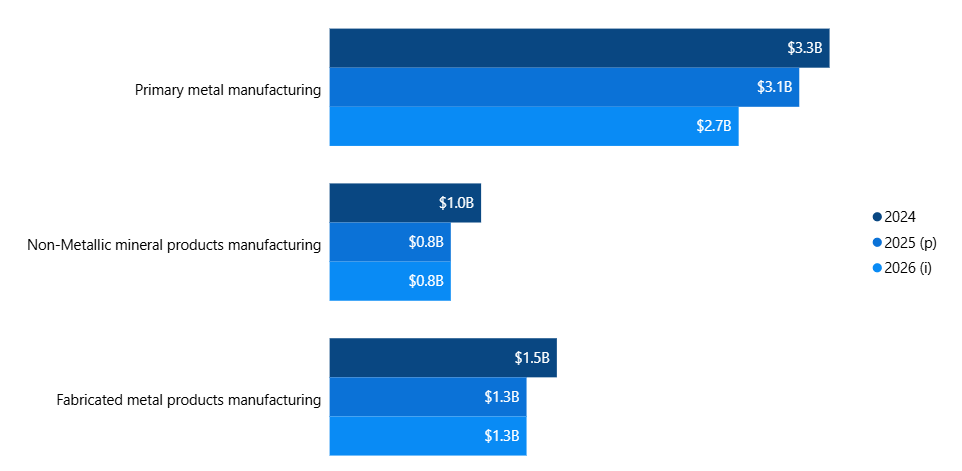
Text version — Figure 6
Primary metal manufacturing, which constituted 59% of this subsector’s CAPEX in 2025, decreased by 8% to $3.0 billion. Fabricated metal products manufacturing fell slightly to $1.3 billion, and non-metal products manufacturing decreased by 17% to $828 million.
Sources: Natural Resources Canada, Statistics Canada
B = billion, p = preliminary expenditures, i = spending intentions
Spending breakdown by province and territory
CAPEX across Canada’s provinces and territories can vary significantly from year to year, largely depending on the number, scale, and stage of mining projects. Jurisdictions with fewer operations tend to experience greater volatility, as a single project can represent a large share of total investment.
CAPEX remains concentrated in a small number of major jurisdictionsFootnote 3. In 2025, Saskatchewan (31%), Ontario (22%), and Quebec (20%) accounted for 73% of total mining CAPEX. Saskatchewan’s share reflects notable spending for potash and uranium mining, which are exclusively located in the province.
Year-over-year changes in 2025 were mostly negative. Manitoba and Newfoundland and Labrador recorded significant declines of 55% and 57%, respectively. British Columbia decreased by 28%, while Ontario and Alberta both declined by 11%. Data for some jurisdictions were not available due to confidentiality restrictions and suppression by the source.
Spending intentions for 2026 present a mixed outlook. CAPEX is expected to increase in several jurisdictions, including British Columbia (+63%), Manitoba (+34%), Ontario (+21%), Quebec (+7%), and Alberta (+4%). Declines are anticipated in Nunavut (-23%), Saskatchewan (-16%), and Newfoundland and Labrador (-4%).
Figure 7: Mining industry capital expenditures, by jurisdiction (subject to data availability), 2024 to 2026
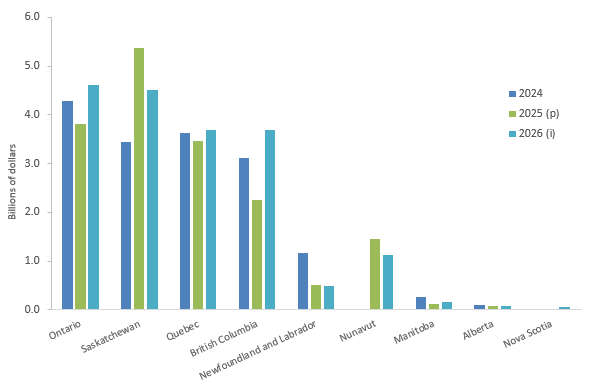
Text version — Figure 7
| Province / Territory | 2024 | 2025 (p) | 2026 (i) |
|---|---|---|---|
| Newfoundland and Labrador | 1,166.9 | 503.3 | 482.1 |
| Prince Edward Island | x | x | x |
| Nova Scotia | x | x | 60.7 |
| New Brunswick | x | 27.6 | 22.0 |
| Quebec | 3,637.5 | 3,461.5 | 3,696.0 |
| Ontario | 4,293.0 | 3,812.4 | 4,603.2 |
| Manitoba | 272.6 | 121.5 | 163.3 |
| Saskatchewan | 3,449.3 | 5,379.8 | 4,510.3 |
| Alberta | 99.3 | 83.3 | 86.9 |
| British Columbia | 3,117.1 | 2,252.6 | 3,682.7 |
| Yukon | x | x | x |
| Northwest Territories | x | x | x |
| Nunavut | x | 1,453.0 | 1,120.2 |
Sources: Natural Resources Canada, Statistics Canada
p = preliminary expenditures, i = spending intentions, x = confidential
Spending intentions for 2026 show a mixed outlook across provinces and territories. Several jurisdictions are planning to increase CAPEX, with significant gains anticipated in British Columbia (+63%), Manitoba (+34%), Ontario (+21%), Quebec (+7%), and Alberta (+4%). In contrast, other jurisdictions are projecting declines in CAPEX, including Nunavut (-23%), Saskatchewan (-16%), and Newfoundland and Labrador (-4%).
Spending by company type
CAPEX in Canada’s mining sector is relatively evenly distributed between foreign- and domestically controlled firms. In 2024, foreign multinational enterprises (MNEs) accounted for 51% of total capital investment, while Canadian MNEs represented 40%. The remaining 9% came from non-MNEs (domestic firms without foreign operations).
These figures are based on Statistics Canada’s data on gross fixed capital formation, which measures investment in long-lived physical assets, such as construction, machinery, and equipment, as well as intellectual property, including mineral explorationFootnote 4. While related, this measure slightly differs from the CAPEX data presented elsewhere in this bulletin.
Canadian MNEs invested $7.1 billion in 2024, with 60% allocated to construction, 29% to machinery and equipment, and 11% to intellectual property (i.e. mineral exploration). Foreign MNEs invested $9.1 billion, with 70% directed toward construction, 18% toward machinery and equipment, and 12% toward intellectual property.
Figure 8: Gross fixed capital formation in mining sector, 2020 to 2024
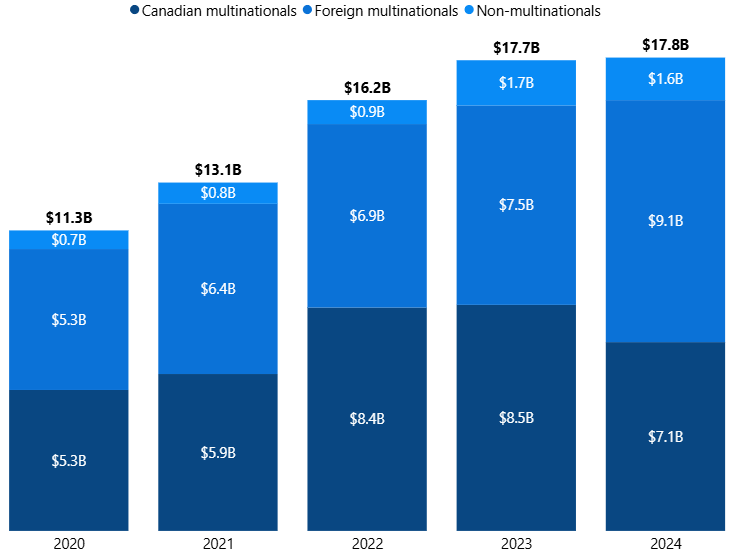
Text version — Figure 8
Of the $7.1 billion invested by Canadian MNEs in 2024, $4.2 billion (60%) was allocated to construction, $2.0 billion (29%) to machinery and equipment, and $823 million (11%) to intellectual property, including exploration. A similar expenditure pattern was observed for foreign MNEs, with $6.3 billion (70%) of the $9.1 billion invested directed toward construction, $1.7 billion (18%) toward machinery and equipment, and $1.1 billion (12%) toward intellectual property.
Sources: Natural Resources Canada, Statistics Canada
B = billion