
Information Bulletin
(published in January 2026)
Canada is home to about half of the world’s publicly listed mining and mineral exploration companiesFootnote 1. Many of these companies have operations in Canada and abroad.
Canadian mining assets (CMAs) dataFootnote 2 reveal important insight into the breadth and depth of the global presence of Canadian mining and mineral exploration companies.
Find out more about CMAs:
- Overview
- Canadian mining assets, by region
- Canadian mining assets located abroad, by country
- Canadian mining assets, by company type
- Annual variations
- Use of statistics on Canadian mining assets located abroad
Overview
A total of 1,344 Canadian mining and exploration companies had CMAs valued at $352.6 billion in 2024, a 4.1% increase from $338.8 billion in 2023. Of these companies, 747 had CMAs located abroad worth $240.6 billion, which was up 8.1% from the revised value of $222.4 billion in 2023.
In 2024, Canadian companies were present in 95 foreign countries and mining assets abroad accounted for about two thirds of the total value of CMAs.
Significant fluctuations in exchange rates affect the value of CMAs held by companies that report their financial results in US dollars, which represent about 80% of the total value of CMAs. Notable depreciation of the Canadian dollar against the US dollar in 2024 increased the value of CMAs by 4.6%, exceeding the overall annual increase of 4.1%. This implies that CMAs would have declined by about 0.5% had exchange rates remained stable.
The Canadian dollar weakened in 2024 due to both shifting interest rate expectations and broader global market conditions. As inflation in Canada eased more quickly than in the United States, investors anticipated earlier interest rate cuts from the Bank of Canada, which typically puts downward pressure on the Canadian dollar. At the same time, heightened global uncertainty led investors to favour the US dollar as a safer asset. This increased the risk premium on most other currencies, including Canada’s, and the Bank of Canada reports that this factor accounted for the majority of the Canadian dollar’s decline in 2024.
Canadian mining assets, by region
In 2024, CMAs increased in all regions except Canada and Europe. Figure 1 provides a detailed geographic breakdown of mining asset values, and Table 1 displays the value and percentage variation of CMAs by region between 2023 and 2024.
Figure 1: Geographic distribution of CMAs, 2024 (p)
(1,344 companies with $352.6 billion in mining and mineral exploration assets)
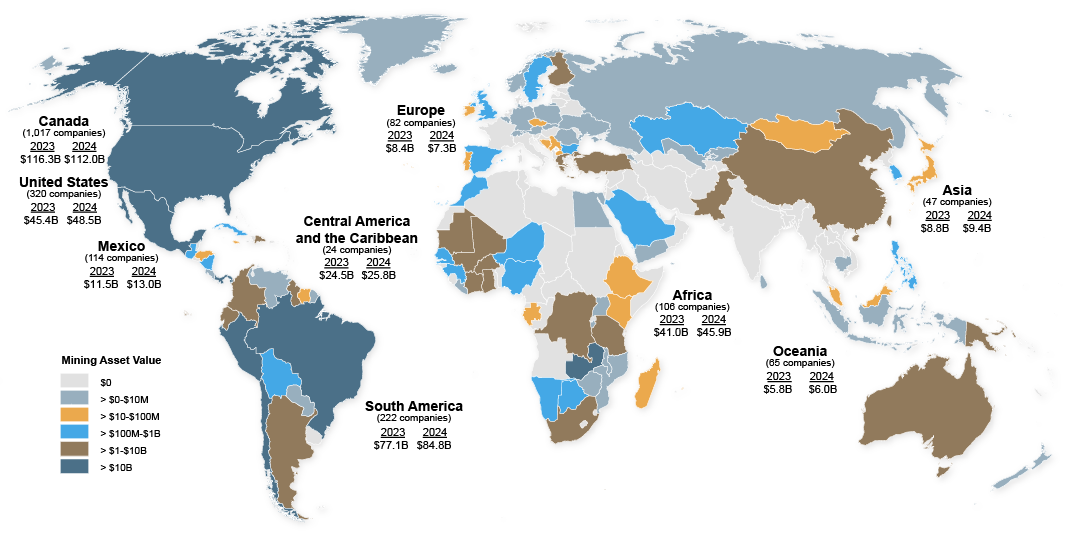
Text version
In this world map, countries are colour-coded according to a range of values for CMAs (for example, countries in orange have CMAs in the range of $10 million to $100 million). For each region and for Canada, the United States and Mexico, the 2023 and 2024 CMAs values are listed along with the number of Canadian-based companies with assets in that region or country. Refer to Table 1 for the specific values in each region.
Source: Natural Resources Canada.
(p) preliminary, M million, B billion.
Note: Asset totals may be different because of rounding.
Company totals may be different because companies can be active in multiple jurisdictions.
Table 1: CMAs, by region, 2023 and 2024 (p) |
||||
|---|---|---|---|---|
| Region | 2023 | 2024 (p) | Change | Change |
| ($ billions) | (%) | |||
| Africa | 41.0 | 45.9 | 4.9 | 12.1 |
| Americas (except Canada) | 158.5 | 172.1 | 13.6 | 8.6 |
| Asia | 8.8 | 9.4 | 0.6 | 6.4 |
| Europe | 8.4 | 7.3 | -1.1 | -13.6 |
| Oceania | 5.8 | 6.0 | 0.2 | 2.7 |
| Total for CMAs abroad | 222.4 | 240.6 | 18.1 | 8.1 |
| Canada | 116.3 | 112.0 | -4.3 | -3.7 |
| Total for CMAs | 338.8 | 352.6 | 13.8 | 4.1 |
Source: Natural Resources Canada.
(p) preliminary.
Note: Totals may be different because of rounding.
Africa was the region with the second-highest value of CMAs, which increased by 12.1% to $45.9 billion in 2024. Several countries incurred notable gains, including Zambia (+$2.7 billion), South Africa (+$1.2 billion), Tanzania (+$465.3 million) and Ghana (+$427.5 million). Key developments contributing to these increases included:
- Zambia: Barrick Mining began construction on its Lumwana mine expansion, with completion targeted for 2028. First Quantum Minerals is also expanding its Kansanshi mine, with the project expected to finish in late 2025.
- South Africa: Wheaton Precious Metals acquired mining interests in Ivanhoe Mines’ Platreef platinum project.
- Tanzania: Barrick Mining is expanding its Bulyanhulu and North Mara mines.
- Ghana: Galiano Gold fully acquired the Asanko Gold Mine, in which it previously held a joint-venture stake.
The majority of CMAs abroad (71.5%) were located in the Western Hemisphere (the Americas except Canada), where the value of assets increased by 8.6% to $172.1 billion in 2024. A significant share was concentrated in Latin America and the Caribbean, which accounted for half of all CMAs abroad, reaching $123.5 billion in 2024 – an increase of 9.3% from the previous year. Notable gains were recorded in Chile (+$3.3 billion), Mexico (+$1.5 billion), Argentina (+$1.4 billion) and Guyana (+$1.2 billion). Key factors contributing to these increases included:
- Chile: Teck Resources and its partners continued ramping up the large Quebrada Blanca Phase 2 copper mine in 2024. Capstone Copper is also advancing the expansion of its Mantoverde mine.
- Mexico: Torex Gold Resources made substantial investments in the Media Luna underground copper–gold–silver mine, which achieved commercial production in early 2025. Media Luna forms part of the Morelos Complex, the largest gold-producing operation in Mexico.
- Argentina: Barrick Mining increased the reported value of its Veladero gold mine after updating its mining plan.
- Guyana: G Mining Ventures acquired the Oko West Gold property from Reunion Gold, another Canadian company.
The United States remained the top country by value for CMAs abroad in 2024, accounting for 20.2% of the total. The cumulative value of CMAs in the United States reached $48.5 billion, an increase of 6.7% compared to 2023. Growth was supported by many of the more than 300 Canadian companies operating in the country, including Barrick Mining, which built a solar power plant at its Nevada gold mines. However, these gains were partly offset by Nevada Copper’s bankruptcy.
The value of CMAs located in Asia reached $9.4 billion in 2024, a 6.4% increase from $8.8 billion in 2023. Notable activity in the region includes ongoing work at the Reko Diq copper-gold project in Pakistan, operated by Barrick Mining, which holds a 50% interest. The Reko Diq deposit is expected to have a 40-year mine life, with first production targeted for 2028.
In Europe, the value of CMAs decreased by 13.6% to $7.3 billion in 2024. This decline was primarily driven by Lundin Mining’s sale of the Neves-Corvo zinc-copper mine in Portugal and the Zinkgruvan zinc-lead-silver mine in Sweden to Boliden AB (Sweden) for total consideration of up to US$1.52 billion. More than three quarters (81.7%) of European CMAs are concentrated in Greece ($3.6 billion) and Finland ($2.4 billion). In Greece, Eldorado Gold holds significant assets, including the Olympias gold mine and the Skouries gold-copper project, which is expected to begin production in 2026. In Finland, Agnico Eagle operates the Kittilä gold mine, Europe’s largest primary gold producer.
CMAs located in Oceania increased by 2.7% to $6.0 billion in 2024. The value of CMAs is concentrated in Australia, where 59 companies held assets that collectively accounted for 65.5% ($3.9 billion) of the region’s total. The overall increase was driven by investments in Papua New Guinea, including K92 Mining’s mill expansion at the Kainantu gold mine and the restart of the Porgera gold mine, operated by Barrick Mining, which holds approximately one quarter of ownership interests.
The value of CMAs in Canada decreased by 3.7% to $112.0 billion in 2024. The decline was driven largely by Teck Resources’ sale of its steelmaking (metallurgical) coal business, Elk Valley Resources, to Glencore (which acquired 77% of ownership interests and is based in Switzerland), Nippon Steel (which acquired 20% of interests and is based in Japan) and POSCO (which acquired 3% of interests and is based in South Korea) for a total enterprise value of approximately US$9 billion. Several other developments partially offset this decline, including:
- Equinox Gold acquired 40% interest in the Greenstone gold mine from Orion Mine Finance (United States), giving Equinox 100% ownership of the Ontario operation.
- Construction and commissioning of the Côté Gold Mine in Ontario was completed by IAMGOLD.
- Alamos Gold acquired Argonaut Gold (United States), including the Magino Gold Mine, and expanded the nearby Island Gold Mine.
Canadian mining assets located abroad, by country
Over three quarters (77.5%) of the total value of CMAs abroad was located in the top 10 countries. Countries remained unchanged between 2023 and 2024, but there were changes in their ranking. Figure 2 shows the 2024 distribution of CMAs abroad for the top 10 countries.
Figure 2: Percentage of CMAs abroad, by country, 2024 (p)
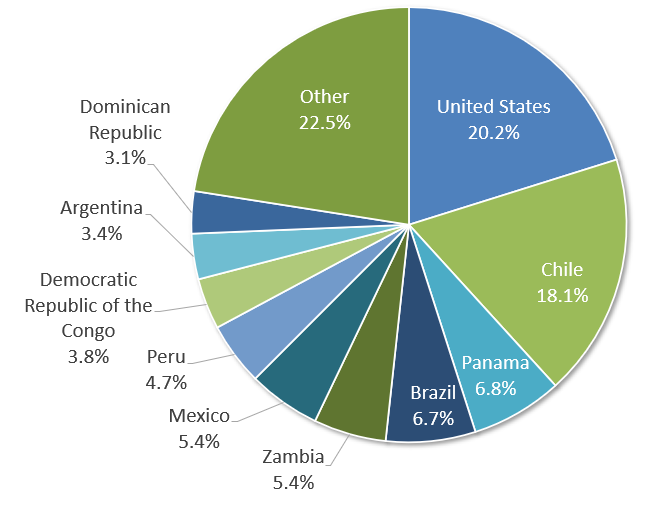
Text version
This pie chart shows the 10 leading countries with CMAs abroad in 2024. The top country is the United States (20.2%), followed by Chile (18.1%), Panama (6.8%), Brazil (6.7%), Zambia (5.4%), Mexico (5.4%), Peru (4.7%), the Democratic Republic of the Congo (3.8%), Argentina (3.4%) and the Dominican Republic (3.1%).
Source: Natural Resources Canada.
(p) preliminary.
Canadian mining assets, by company type
In 2024, the overall value of CMAs held by junior companiesFootnote 3 increased by 16.6% to $24.8 billion. The number of junior companies decreased from 1,233 to 1,188. The increase in the value of CMAs held by junior companies was due to a few companies advancing projects towards production and favourable financing conditions brought on by high mineral and metal prices. The decrease in the number of companies was due to mergers, discontinued financial reporting, and/or companies shifting out of the mining sector.
The largest share of assets held by junior companies was located in Canada (52.8%), followed by the Americas (except Canada) (37.8%). Figure 3 provides an overview of the total value of CMAs held by junior companies, by region.
Junior companies accounted for a large share of the total number of companies (88.3%), but a much lower share of the total value of CMAs (7.0%) in 2024. Senior companies accounted for a much larger share of the value of CMAs (93.0%) because of the high values associated with the mines they own and operate.
Figure 3: CMAs of junior companies, by region, 2023 and 2024 (p)
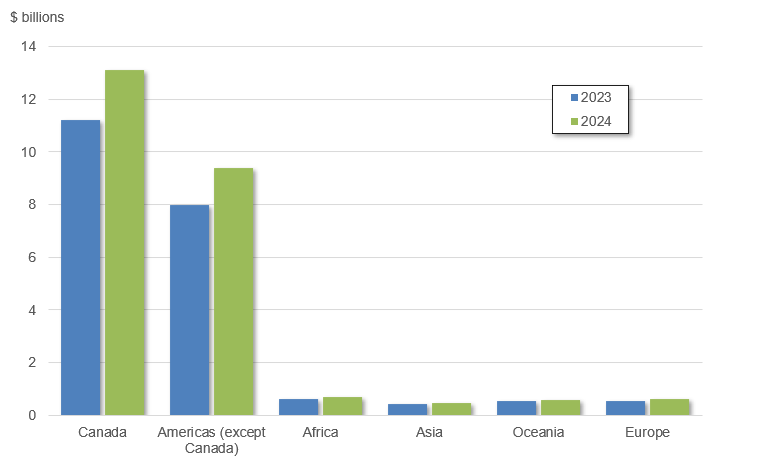
Text version
This column chart shows the geographic distribution of CMAs of junior companies in 2023 and 2024. In Canada, they were valued at approximately $13.1 billion in 2024 and $11.2 billion in 2023. In the Americas (except Canada), they were worth $9.4 billion in 2024 and $8.0 billion in 2023. In Africa, they were worth $700 million in 2024 and $617 million in 2023. In Asia, they were worth $449 million in 2024 and $445 million in 2023. In Oceania, they were worth $575 million in 2024 and $530 million in 2023. In Europe, they were worth $613 million in 2024 and $533 million in 2023.
Source: Natural Resources Canada.
(p) preliminary.
In 2024, the total value of CMAs held by senior companiesFootnote 3 increased by 3.2% to $327.7 billion. Over two thirds of the total value of CMAs were concentrated in the top 10 senior companies, with a cumulative CMAs value of $228.3 billion.
Relative to junior companies, senior companies held a smaller proportion of CMAs values in Canada (30.2%) and a higher proportion in the rest of the Americas (49.6%). Figure 4 provides an overview of the total value of CMAs held by senior companies, by region.
Figure 4: CMAs of senior companies, by region, 2023 and 2024 (p)
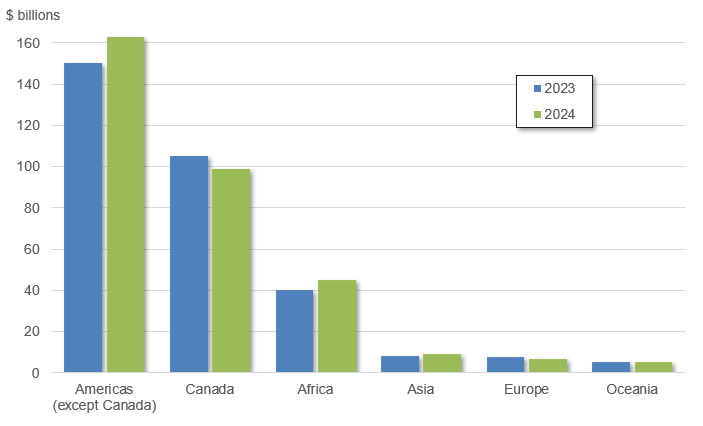
Text version
This column chart shows the geographic distribution of CMAs of senior companies in 2023 and 2024. In the Americas (except Canada), they were valued at approximately $162.7 billion in 2024 and $150.5 billion in 2023. In Canada, they were worth $98.9 billion in 2024 and $105.1 billion in 2023. In Africa, they were worth $45.2 billion in 2024 and $40.4 billion in 2023. In Asia, they were worth $8.9 billion in 2024 and $8.3 billion in 2023. In Europe, they were worth $6.6 billion in 2024 and $7.9 billion in 2023. In Oceania, they were worth $5.4 billion in 2024 and $5.3 billion in 2023.
Source: Natural Resources Canada.
(p) preliminary.
Annual variations
Variations of the value of CMAs can be caused by numerous factors and events. A significant portion of additions to the value of assets results from mergers, acquisitions and mine development. Reductions in the value of assets held by companies result mostly from sales, asset impairment expensesFootnote 4, write-offs, depreciation, depletion and mine closures. Changes in exchange rates, accounting methods and relocation of company headquarters also contribute to annual variations.
Use of statistics on Canadian mining assets located abroad
Data on CMAs abroad provide a picture of the global presence of Canada’s mining and exploration companies and the scope of that presence in any given country. Some care is required when consulting the value of CMAs in a country. CMAs abroad, as tracked by Natural Resources Canada, differ from Canadian direct investment abroad (CDIA) figures estimated by Statistics Canada. CDIA is based on foreign direct investment as defined internationally, which is based on national systems of accounts. CMAs abroad are based on financial accounting standards applied by Canadian public companies and auditors. Table 2 outlines the principal differences between these approaches.
Table 2: CDIA compared to CMAs abroad |
|
|---|---|
| CDIA | CMAs abroad |
| Source of financing must be Canadian | Source of financing is immaterial |
| All assets and liabilities are examined | Only non-current mining asset values are examined |
| Based on first destination (investment destined for Mexico through a U.S. subsidiary is allocated to the United States) | Based on final destination (the transaction in the left column would be considered CMAs located abroad in Mexico) |
| Canadian company: incorporated in Canada with foreign affiliates | Canadian company: headquarters in Canada and not foreign controlled |
| Limited data by region for mining | CMAs abroad data by country |
Source: Natural Resources Canada.
Annex 1: Canadian Mining Assets (CMAs), by Country and Region, 2023 and 2024 (p)
Note
All amounts are in Canadian dollars.