Natural Resources Canada
General Information Product 145e
Natural Resources Canada
© His Majesty the King in Right of Canada, as represented by the Minister of Natural Resources, 2026
Permanent link: https://doi.org/10.4095/331156
For information regarding reproduction rights, contact Natural Resources Canada at copyright-droitdauteur@nrcan-rncan.gc.ca.
Tables of contents
- Acknowledgements
- Notice
- Executive summary
- Glossary
- Part 1: get oriented
- Part 2: get established
- Part 3: get going
- Part 4: get inspired
- 7.0 Case Studies: How Engagement Tools Have Been Used in Flood Mapping and Other Initiatives
- 7.1 Case Study: Lower Fraser and Coquihalla Rivers Floodplain Mapping
- 7.2 Case Study: Southern Lakes Flood Hazard Mapping Study
- 7.3 Case Study: Tuktoyaktuk Community Climate Resilience Project
- 7.4 Case Study: False Creek Coastal Adaptation Plan and Sea2City Design Challenge
- 7.5 Case Study: Sackville and Little Sackville Rivers Floodplain Mapping
- 7.6 Case Study: EPCOR’s Stormwater Integrated Resource Plan
- 7.7 Case Study: Flood Resilience Challenge
- 7.0 Case Studies: How Engagement Tools Have Been Used in Flood Mapping and Other Initiatives
- References
- Appendix A: engagement planning worksheet
List of figures
- Figure 1: Select flood events in Canada (2021–2025) (left to right: Kelly Allen via CBC News, 2021; Brad Mapes via My True North Now, 2022; Rene Roy/Wreckhouse Press, 2022; Arlyn McAdorey/the Canadian Press, 2024; Lisa Grilz via CBC News, 2025).
- Figure 2: Flood Mapping Framework (NRCan, 2026c).
- Figure 3: The Community Engagement Spectrum (CES) (adapted from IAP2, 2024).
- Figure 4: Combining the Federal Flood Mapping Framework and the Community Engagement Spectrum (adapted from IAP2, 2024, and NRCan, 2026c).
- Figure 5: The five steps of the engagement planning process.
- Figure 6: Fraser River at Yale First Nation (Stullawheets 8), looking north (NHC, 2023).
- Figure 7: Coquihalla River, looking upstream at Hospital Bend (NHC, 2023).
- Figure 8: The Southern Lakes Flood Hazard Mapping Study process (Government of Yukon, 2024a).
- Figure 9: Illustrations were used for enhancing public understanding (Government of Yukon, 2024b).
- Figure 10: A comparison of the 2021 flood extent and the 1% annual exceedance probability (AEP) in Tagish (Government of Yukon, 2024c).
- Figure 11: Tuktoyaktuk, located on a peninsula in the Beaufort Sea, is experiencing rapid land loss due to coastal erosion processes and sea-level rise (Tuktoyaktuk Community Corporation Resilience Project, 2019a).
- Figure 12: Recruitment poster for the TCCRP Climate Monitory Training Workshop, a skill-building initiative administered by the Aurora Research Institute (Tuktoyaktuk Community Corporation Resilience Project, 2019b).
- Figure 13: Data collection workshop held with community members (Aurora Research Institute, 2021).
- Figure 14: Community data-collection methods, such as permafrost sampling (left) (Tuktoyaktuk Community Corporation Resilience Project, 2019c), have contributed to a preliminary geophysical assessment for the Tuktuyaaqtuuq Centre for Arts and Culture. Maps were produced to show seasonal thaw conditions (right), storm surge water levels, and the ground temperature profile (Whalen et al., 2022).
- Figure 15: Prior engagements with the Host Nations (left), as well as community workshops (centre) and open houses (right) identified a guiding set of community values that informed subsequent phases of planning (CoV, 2018, 2021a).
- Figure 16: Landscape visualizations and flood maps of at-risk areas, found in a “map atlas,” were used to enhance public risk awareness (CoV, n.d.).
- Figure 17: A participatory map of False Creek (left) and surveys were used to elicit local values (right) (CoV, 2020, 2021a).
- Figure 18: During one Community Conversation workshop, participants explored potential mitigation options through virtual whiteboards (CoV, 2021a).
- Figure 19: The Sea2City project teams developed site-specific visualizations and proposed pilot projects that aligned with community values (CoV, 2022).
- Figure 20: The 1980 and 2024 flood hazard maps (HRM, 2024).
- Figure 21: The proposed Sackville and Little Sackville River Floodplain Regulations shown to residents (HRM, 2024).
- Figure 22: A risk analysis of the sub-basins was completed by identifying the risk exposure for the four risk categories—Health and Safety, Environment, Social, and Financial—in each of the five storm scenarios (1:20, 1:50, 1:75, 1:100 and 1:200). The results were then mapped. The risk exposure for a sub-basin reflects the potential for this risk level to be present within the sub-basin boundary; it does not mean that every property is exposed to the same level of risk within the sub-basin. Above are the maps created for the Financial risk category in the 1:20, 1:50, and 1:75 storm scenarios (EPCOR, 2018).
- Figure 23: Priority sub-basins were identified for each risk category based on risk exposure to critical infrastructure. Results were combined into the above risk scenario map. The risk scenario map shows the prioritization of stormwater sub-basins weighted based on the results of the public opinion survey (30% Health and Safety, 30% Social, 25% Financial, and 15% Environment). Focused flood mitigation initiatives have been identified for sub-basins in Group A to Group E. Flood mitigation opportunities for sub-basins in Group F to Group H will align with other planned construction activities (EPCOR, 2018).
- Figure 24: Community leaders and local business owners play the FRC game in Cambridge, ON, engaging in dialogue and learning about flood risk mitigation solutions in the lead up to the 50-year anniversary of the Great Flood of’74 (Flood Resilience Challenge Team & P4A, 2024).
- Figure 25: The FRC game can be facilitated as an in-person or online activity (FRC Game, 2023).
List of tables
- Table 1: Types of floods and their descriptions.
- Table 2: Main types of flood maps and their descriptions.
- Table 3: Communication purpose and flow across the Community Engagement Spectrum.
- Table 4: Community engagement objectives for the flood mapping process.
- Table 5: Potential actors and the types of information they can provide.
- Table 6: Selecting engagement activities by goal and feasibility across the Community Engagement Spectrum.
- Table 7: Case Study Characteristics of Lower Fraser and Coquihalla Rivers Floodplain Mapping
- Table 8: Case Study Characteristics of Southern Lakes Flood Hazard Mapping Study
- Table 9: Case Study Characteristics of Tuktoyaktuk Community Climate Resilience Project
- Table 10: Case Study Characteristics of False Creek Coastal Adaptation Plan and Sea2City Design Challenge
- Table 11: Case Study Characteristics of Sackville and Little Sackville Rivers Floodplain Mapping
- Table 12: Case Study Characteristics of EPCOR’s Stormwater Integrated Resource Plan
- Table 13: Case Study Characteristics of Flood Resilience Challenge
Acknowledgements
The Federal Flood Mapping Guidelines Series supports the Flood Hazard Identification and Mapping Program (FHIMP) and has been developed under the leadership of the Flood Mapping Committee, a partnership between Public Safety Canada (PS), Natural Resources Canada (NRCan), Environment and Climate Change Canada (ECCC), National Research Council of Canada (NRC), Defence Research and Development Canada, Department of National Defence, Infrastructure Canada, Indigenous Services Canada, and Crown-Indigenous Relations and Northern Affairs Canada. A Technical Working Group on Flood Mapping formed in 2015 comprised of parties from federal, provincial, and territorial jurisdictions, as well as the private sector and academia, has contributed valuable input to the development of the Federal Flood Mapping Guidelines Series documents. Provincial and territorial government representatives also provided essential feedback for this publication.
This publication, Community Engagement Guidelines for Flood Mapping, was developed in collaboration with Partners for Action (P4A), a research initiative within the University of Waterloo’s Faculty of Environment.
Prepared by:
Editor and Project Lead
Sharmalene Mendis-Millard
Lead Writers
Alessandra Aponte Donaire
Elena Christy
Editor
Rebecca Robinson
Researchers and Contributing Writers
Alessandra Aponte Donaire
Kayne Boyall
Elena Christy
Felicia Watterodt
Sharmalene Mendis-Millard
Input from Kasra Motlaghzadeh and Beth Palmer
Formatting and Design
Felicia Watterodt
Sheridan Hill
Kayne Boyall
The International Association for Public Participation’s (IAP2) Spectrum of Public Participation provided the basis for this publication’s Community Engagement Spectrum. Permission to use IAP2 materials has been provided by IAP2.
The icons and graphics used in the production of this publication (Figures 1, 2, 3 and 4) were provided by the following sources:
- Canva.com: Clker-Free-Vector-Images, Deka Saputra, denustudio, Geek Gaek’s Images, Jacopo Bonacci, linear_design Images, Nadiinko, Panadesignteam, sripdesigns, Startup Graphic Design, UoaHH, Vectorfair S1, and WEBTECHOPS LLP
- Shutterstock.com: Black Creator 24.
Notice
Disclaimer of Liability
This technical documentation has been published by His Majesty the King in Right of Canada, as represented by Natural Resources Canada (NRCan). No warranties or representations, express or implied, statutory or otherwise shall apply or are being made by NRCan in respect of the documentation, its effectiveness, accuracy, or completeness. NRCan does not assume any liability or responsibility for any damages or losses, direct or indirect, incurred or suffered as a result of the use made of the documentation, including lost profits, loss of revenue or earnings or claims by third parties. In no event will NRCan be liable for any loss of any kind resulting from any errors, inaccuracies, or omissions in this documentation. NRCan shall have no obligation, duty, or liability whatsoever in contract, tort or otherwise, including negligence.
Additional Information
For more information about this document, please contact the Canada Centre for Mapping and Earth Observation of Natural Resources Canada: geoinfo@nrcan-rncan.gc.ca.
Executive summary
Community Engagement Guidelines for Flood Mapping provides practical tips to help guide the development and implementation of a community engagement plan for flood mapping. This resource offers a bird's eye view of how the flood mapping process in Canada can intersect with types of community engagement. It aims to make engagement and communication with communities, organizations and practitioners easier for those involved in flood mapping who seek to foster inclusive community engagement throughout the mapping process.
Why Is Community Engagement Important?
The increasing intensity, frequency, and unpredictability of extreme weather and hazard events due to climate change is driving the need to reduce risk and build the resilience of communities across Canada. As legislation and initiatives emerge in response, such as Canada’s National Adaptation Strategy (ECCC, 2023) and efforts to align with it, a “whole-of-society” approach is required that understands and reduces risk to protect people, properties and infrastructure. As part of this approach, community and practitioner engagement across sectors in hazard mapping is critical to inform land-use planning, emergency management, and disaster risk reduction.
Floods are Canada’s most costly and widespread of these hazards, which means that flood maps play a critical role in equipping communities and policymakers with the information needed to reduce impacts to people and property.
Flood mapping is a detailed and complex process that includes scientific modelling, data collection, risk assessment, and communication. It also requires input from different sources and groups—communities—to produce accurate, credible, and actionable maps. An inclusive approach that engages varied communities not only grounds risk assessments and associated maps in lived realities, but also enables the integration of climate projections, equity concerns, local priorities, diverse knowledge systems, and a broad spectrum of data sources and methodologies.
How Can Engagement Be Combined with the Flood Mapping Process?
Organized in four parts—Get Oriented, Get Established, Get Going, and Get Inspired—this resource introduces an integrated framework of community engagement for flood mapping and a five-step engagement planning toolkit Figure ES-1).
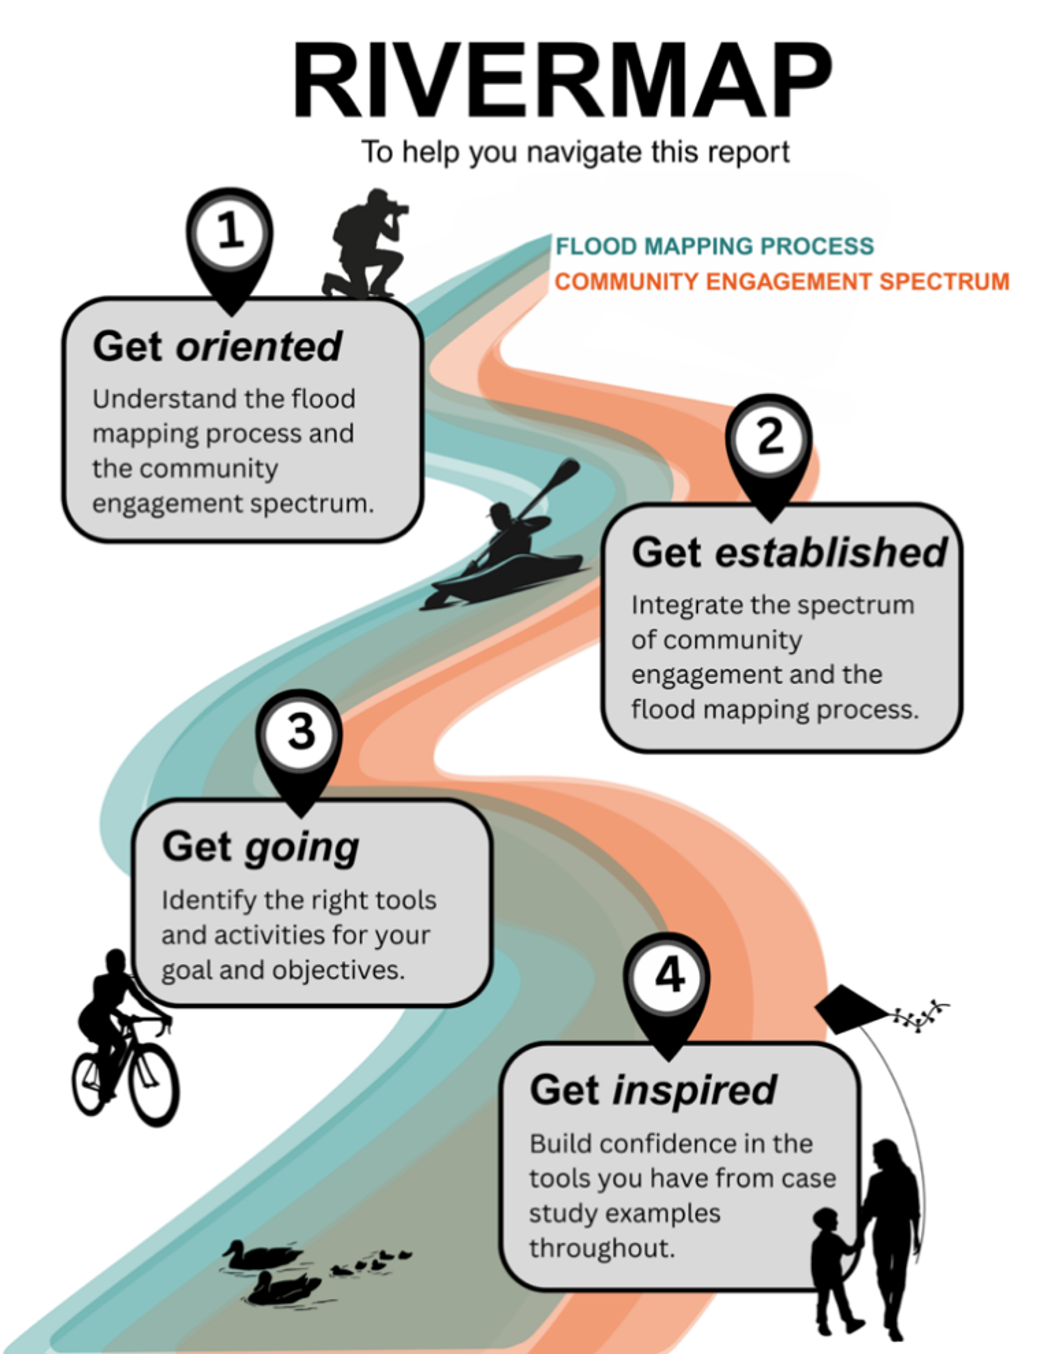
Figure ES-1. Rivermap to engage community in the flood mapping process.
Text version
An infographic titled “RIVERMAP: To help you navigate this report.” It presents the four parts of the document using a winding river as a visual metaphor. The river combines two labelled pathways, Flood Mapping Process and Community Engagement Spectrum, shown in different colours and flowing together from top to bottom. The river visually connects all four stages.
Step 1: Get oriented
Located in the upper left portion of the infographic. A black-and-white location marker labelled “1” points to a rounded rectangular text box. The text reads: Understand the flood mapping process and the community engagement spectrum. Above this section is a silhouette of a person kneeling and using a camera, suggesting observation or learning.
Step 2: Get established
Located on the upper right side of the infographic. A location marker labelled “2” points to another rounded rectangular text box. The text reads: Integrate the spectrum of community engagement and the flood mapping process. A silhouette of a kayaker paddling on the river appears nearby.
Step 3: Get going
Located in the middle-left section. A location marker labelled “3” points to a rounded text box. The text reads: Identify the right tools and activities for your goal and objectives. To the left of this section is a silhouette of a cyclist riding a bicycle.
Step 4: Get inspired
Located in the lower right section. A location marker labelled “4” points to a rounded text box. The text reads: Build confidence in the tools you have from case study examples throughout. Near this section is a kite flying on a curved string and silhouettes of two people standing together.
At the bottom left of the river are silhouettes of several waterfowl swimming.
Community Engagement Guidelines for Flood Mapping starts by recognizing that NRCan’s Flood Mapping Framework provides a structured approach to the process of mapping and mitigation. At every stage of the flood mapping process, engagement (including communications) can play an important role (Figure ES-2).
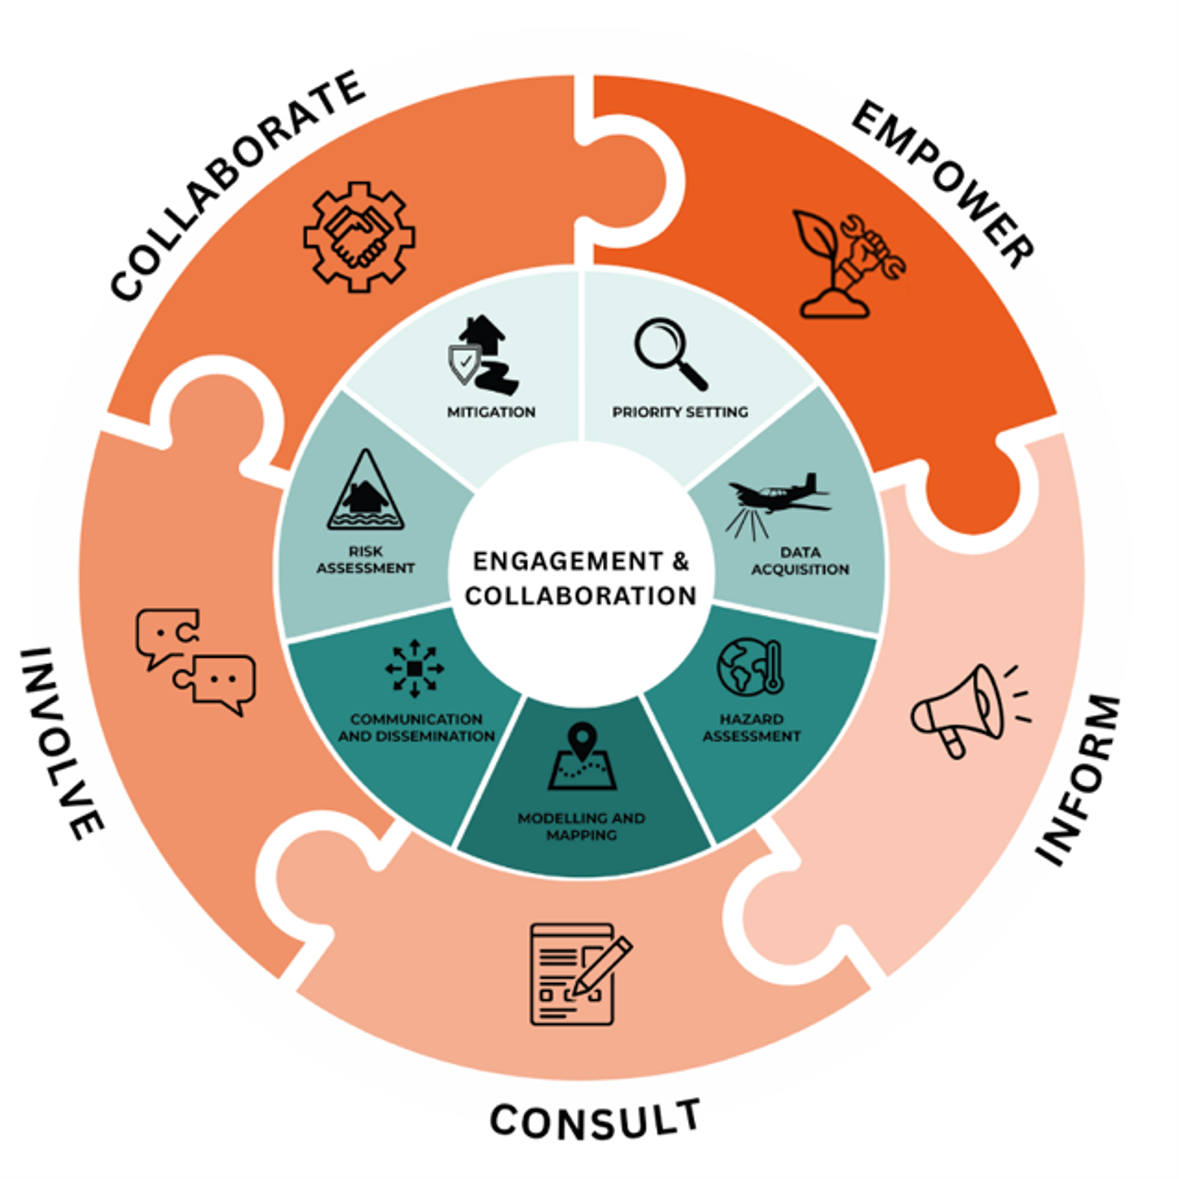
Figure ES-2: Combining the Federal Flood Mapping Framework and the Community Engagement Spectrum.
Text version
A circular infographic composed of interconnected puzzle-shaped segments arranged in an outer ring around an inner ring and a central circle. The central circle contains the text “ENGAGEMENT & COLLABORATION.” The infographic uses shades of orange on the outer ring and shades of blue-green on the inner ring.
The inner ring is made up of seven segments, each labelled with both text and an icon. The labels are:
Priority Setting, shown with a magnifying glass.
Data Acquisition, shown with an airplane collecting data.
Hazard Assessment, shown with a globe and thermometer.
Modelling and Mapping, shown with a map pin on a map.
Communication and Dissemination, shown with arrows radiating outward.
Risk Assessment, shown with a hazard warning triangle.
Mitigation, shown with an icon of a house and shield near a river.
Encircling the inner ring is a larger outer ring made of five large puzzle pieces. Each outer ring segment contains a single word and an accompanying icon:
Inform, with an icon of a megaphone.
Consult, with an icon of a document and pencil.
Involve, with an icon of two overlapping speech bubbles.
Collaborate, with an icon of two hands shaking inside a gear.
Empower, with an icon of a hand holding a wrench, growing out of a small plant.
The words are positioned along the outer edge of the circle. The puzzle-piece shapes visually interlock.
Community engagement exists on a spectrum ranging from simply sharing information (“inform”) to community-led processes (“empower”). Choosing the right type of engagement depends on the goals, audience, and context. Done well, engagement can uncover local knowledge, build long-term trust, and lead to decisions that reflect both technical insight and lived experiences.
These guidelines do not offer a one-size-fits-all model for community engagement. Rather, they provide a flexible, step-by-step approach (Figure ES-3) that can be adapted to specific needs, whether it is designing a new flood map, updating old data, or communicating flood risk to the public.
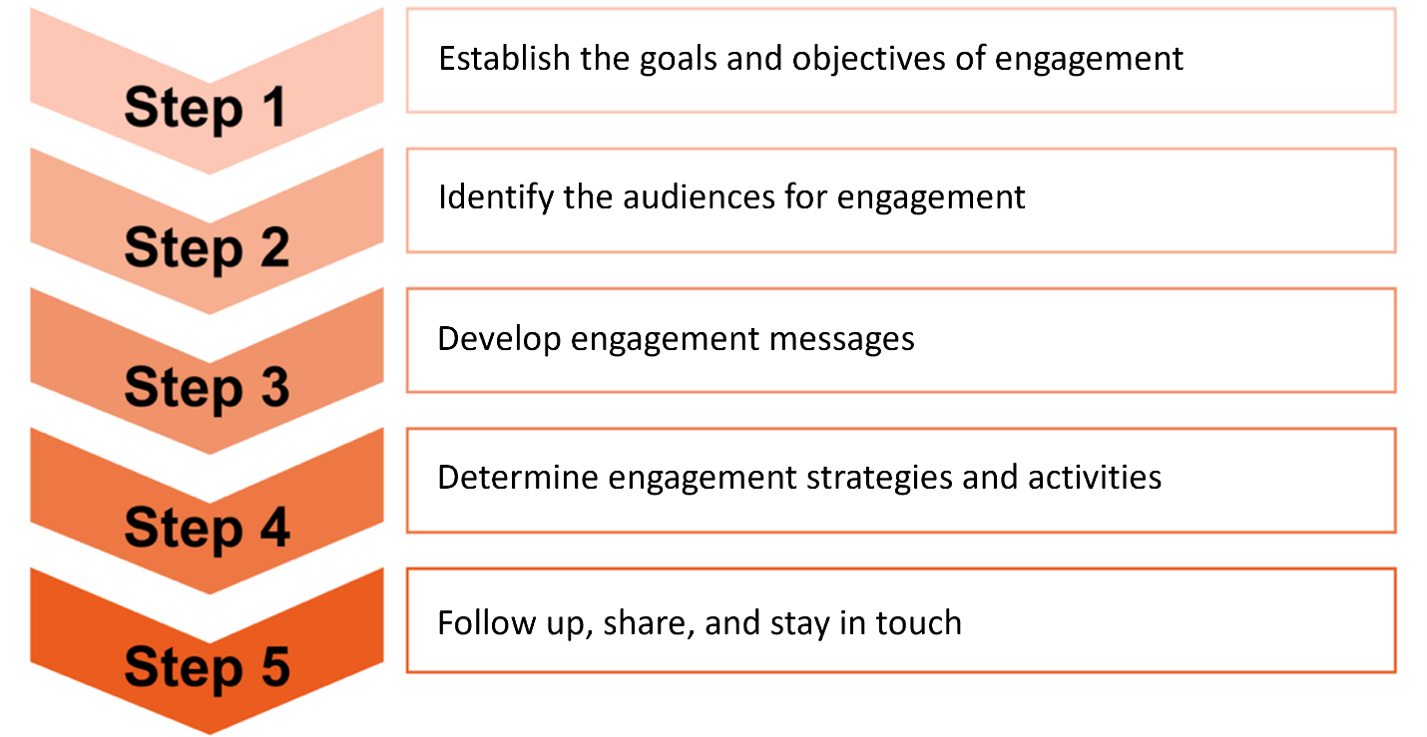
Figure ES-3: The five steps of the engagement planning process.
Text version
A five-step engagement process arranged vertically from top to bottom. Each step is displayed on the left as a stacked, downward-pointing chevron shape in progressively darker shades of orange, labelled sequentially from Steps 1 to 5. To the right of each step label is a rectangular box outlined in orange that contains the corresponding description text.
Step 1 appears at the top in a light peach colour and is labelled “Step 1.” The accompanying text reads: “Establish the goals and objectives of engagement.”
Step 2, shown in a slightly darker orange shade, is labelled “Step 2.” The text beside it reads: “Identify the audiences for engagement.”
Step 3 continues the sequence in a deeper orange tone and is labelled “Step 3.” The descriptive text reads: “Develop engagement messages.”
Step 4, displayed in an even darker orange, is labelled “Step 4.” The text reads: “Determine engagement strategies and activities.”
Step 5, shown at the bottom in the darkest orange colour, is labelled “Step 5.” The accompanying text reads: “Follow-up, share, and stay in touch.”
What Can Be Learned from Canadian Experiences?
This resource includes case studies, drawn from Canadian experiences, to show how community engagement activities and tools enhance flood mapping. Each case study highlights which stages of the flood mapping process, and which levels of community engagement were addressed. Local and regional efforts involving communities have led to more accurate maps, stronger relationships, and better outcomes for people on the ground.
Who Are These Guidelines For?
These guidelines were developed for those who lead and are involved in flood risk assessment, planning and management, such as governments, watershed organizations, community-based and not-for-profit organizations, and private sector practitioners.
Glossary
adaptation: Adjustments in ecological, social, or economic systems in response to actual or expected climatic stimuli and their effects. These can include changes in processes, practices, and structures to moderate potential damage or to benefit from opportunities associated with climate change (United Nations Framework on Climate Change, 2025).
annual exceedance probability (AEP): The probability, expressed as a percentage, of a given flood flow or water level occurring or being exceeded in any given year. Flood events are usually expressed in terms of an annual exceedance probability (AEP), probability ratio, or return period. For example, a 1% AEP flood event, a 1:100 flood event, and a 100-year flood event are equivalent. However, the concept of return periods is sometimes misinterpreted by non-technical audiences as a period of time between events (e.g., 100 years until the next 100-year flood) rather than an annual exceedance probability.
community: A collective of individuals who share a similar location, interest, belief, and/or social network that may be exposed to the same hazards or threats (Sufri et al., 2020).
disenfranchised: An individual or group who has systematically been denied certain rights, privileges, or access to opportunities. It is a form of marginalization as it excludes people from social, political, and economic processes due to factors such as race, gender, socioeconomic status or other identity markers (Oxford Review, 2024).
engagement: A process of involving communities to collect, assess, monitor, and disseminate hazard risk information and responses (Sufri et al., 2020).
equity: Refers to fair treatment, access, opportunities, and advancement for everyone, while striving to identify and eliminate the barriers that have prevented the full participation of some groups. Within the context of flood mapping, it means valuing diverse lived experiences, prioritizing traditionally marginalized voices, and fostering inclusive decision-making (Minow, 2021).
equity-denied group (or equity-deserving group): A group of people who face barriers that prevent them from having the same access to the resources and opportunities that are available to other members of society due to systemic discrimination. Groups generally considered to be equity-denied groups include women, Indigenous Peoples, people with disabilities, people who are part of 2SLGBTQI+ communities, religious minority groups and racialized people (Government of Canada, 2022). Equity-deserving groups are generally considered to include this same list of groups, but the term focuses on the right to receive equitable treatment.
hazard: A potentially damaging physical event, phenomenon or human activity that may cause the loss of life or injury, property damage, social and economic disruption, or environmental degradation.
inclusion: The process of improving the terms on which individuals and groups take part in society, improving the ability, opportunity, and dignity of those disadvantaged based on their identity, religion, socioeconomic status, migration status, and beliefs (World Bank, 2018).
Inundation: The temporary covering of normally dry land by water, typically due to flooding events (NRCan, 2026c).
Lived experience: An individual’s personal and subjective experiences, including emotions, perceptions, preferences, and goals, which shape their reality (Karunamuni et al., 2020).
mitigation: Actions taken to reduce the impact of disasters in order to protect lives, property, and the environment, and to reduce physical risk and economic disruption. Note: Mitigation includes both structural mitigative measures (e.g., construction of floodways and dikes) and non-structural mitigative measures (e.g., building codes, land-use planning, and insurance incentives) (PS, 2022).
risk: The combination of the likelihood and the adverse consequences of a specified hazard being realized, including potential economic, social/cultural, environmental, and human impacts.
risk governance: The decision-making structures, processes, and practices that guide risk management and the actors and institutions involved. Governance, as distinct from government, involves the whole-of-society, meaning that it can involve a variety of groups ranging from civil society and community members, the private and not-for-profit sectors, research institutions, First Nations, and local, provincial, and federal government actors.
risk management: The use of policies, practices, and resources to analyze, assess, and control risks of health, safety, the environment, and the economy (PS, 2022).
Part 1: get oriented
Understand the flood mapping process and the community engagement spectrum
1.0 Introduction
Flood mapping in Canada plays a key role in climate adaptation and disaster risk reduction. As the unpredictability of extreme weather events increases due to climate change, accurate and accessible flood maps have become critical tools to help safeguard lives and infrastructure. Flood maps are essential for helping people understand the risks they face, particularly for those who may be unaware that they live in high-risk areas. Awareness is the first step in allowing people to proactively plan and take actions; flood maps are critical evidence-based tools for understanding and reducing risk.
Beyond technical input, flood mapping can include community engagement so that local knowledge and needs are integrated into outputs and decision-making processes. Including the perspectives of Indigenous rightsholders, non-Indigenous residents, local organizations, and practitioners helps to ensure that diverse knowledge systems, assets, expertise, and lived experiences are reflected in flood risk management, while also promoting collaborative risk governance. Strengthening community engagement not only improves the relevance and accuracy of flood mapping but also fosters trust and allows people to take an active role in decision-making, helping them protect themselves and advocate for their priorities.
Engagement processes can take numerous forms, depending on a community’s unique needs and priorities, the project scope and requirements, and organizational capacities. It is important to recognize that a one-size-fits-all approach doesn’t work well when designing community engagement plans. Rather, consider that community engagement is a spectrum of activities ranging from one-way communications that inform the public to two-way communications that facilitate collaborative decision-making processes. Each of these activities has a place in the flood mapping process, with some engagement activities being appropriate for different contexts and communities. Using a variety of activities throughout a project can help to reach objectives and meaningfully engage community members.
These guidelines contain steps, tools and examples as inspiration for developing community engagement plans for flood mapping projects.
Social Benefits of Community Engagement in Flood Mapping
Flood events can be traumatic and have long-lasting mental health impacts for those who experience them. Flooding, and the fear of future events, can lead to emotional distress and contribute to other adverse mental impacts, especially in high-risk areas (Terpstra, 2011). However, when people are included in processes and decision-making, they are more likely to be optimistic about the future and feel empowered, have their feelings and concerns validated, be more trusting of authorities, and feel connected to the wider community (Terpstra, 2011; Ojala, 2023). Engagement can foster a sense of agency, lead to positive behavioural changes, enhance risk awareness and preparedness, and strengthen support for local climate action policies and initiatives (Terpstra, 2011; Ojala, 2023).
1.1 Purpose and Scope
Community Engagement Guidelines for Flood Mapping offers practical information and recommendations to engage communities throughout the different stages of the flood mapping process. The guidelines are meant to help you deliver tailored communication strategies to foster community engagement through an equity and inclusion lens.
This document is organized into four main parts:
- Get Oriented: Understand the flood mapping process and the Community Engagement Spectrum — provides an introduction to the importance of community engagement in flood mapping (section 1), an overview of flood risk and flood mapping in Canada (section 2), NRCan’s Flood Mapping Framework (section 3), and the spectrum of community engagement, including the levels of engagement that can be applied, the goals that can be achieved at each level, and the role of communications (section 4).
- Get Established: Integrate the community engagement spectrum with the flood mapping process — offers a framework that integrates engagement throughout the various stages of the flood mapping process and highlights the benefits and challenges of applying engagement strategies to that process (section 5).
- Get Going: Identify the right tools and activities for your goals and objectives — provides a toolkit for planning and fostering engagement (section 6). Planning is a crucial component to the initiative's success and can be easily navigated by answering questions that can be simplified to: Why? Who? How? What? and What next?
- Get Inspired: Build confidence in the tools from case study examples — is a collection of Canadian case studies that showcase how engagement activities and tools have been used to enhance flood mapping and related activities (section 7).
Community Engagement Guidelines for Flood Mapping is informed by a desktop review composed of peer-reviewed literature and grey literature. Throughout the document, you will find links to other resources that complement or further expand upon a specific topic.
These guidelines will describe some of the different tools available as you design community engagement processes that support flood mapping.
While this resource relates to flood mapping, the community engagement tools and strategies provided here can be adapted to other mapping, climate adaptation, flood mitigation, and disaster risk reduction initiatives, even those with different scales and intended audiences.
1.2 Audience
This resource is designed for individuals and organizations involved in flood mapping who seek to foster inclusive community engagement throughout the process. It provides an overview of communication strategies and approaches to engagement that help to ensure that communities are informed, consulted, involved, collaborated with, and empowered.
The insights and tools shared in this report are particularly relevant for the following audiences:
- municipal staff and elected officials
- watershed-level organizations (e.g., Conservation Authorities in Ontario)
- community leaders
- industry and private sector staff
- community-based and non-governmental organizations.
Engaging Indigenous Communities
Engaging Indigenous communities requires specific considerations that take into account the impacts of colonialism, cultural values, and traditional knowledge. The Indigenous Engagement Guidelines for Flood Mapping (NRCan, 2024) outline key principles and best practices for collaborating with Indigenous communities throughout Canada and should be referenced alongside the more general processes presented here when planning engagement with Indigenous communities.
2.0 Flood Risk and Mapping in Canada
Flooding can be defined as water that has overflowed beyond its usual confines to an otherwise dry space and/or to where it is unwanted (Institute for Catastrophic Loss Reduction, 2021). Flooding is Canada’s most common natural hazard (PS, 2022), estimated to result in $800 million in insured losses per year (Canadian Climate Institute, 2024). With over 80% of Canadian cities existing within or near floodplains, and 10% of homes at high risk of flooding, the impacts of these events are something that many Canadian residents will personally experience (Sparling et al., 2024).
Flooding is becoming more frequent and severe due to climate change and various land-use and development pressures that continue to place people, homes, and assets in harm’s way (PS, 2022). In recent years, communities across all provinces and territories have been affected by various types of floods (Figure 1). Communities are affected in many ways—people are displaced from their homes, local livelihoods and businesses are threatened, critical infrastructure is damaged, human health and safety are endangered, and the ecosystems and waterways that communities depend upon are impacted (Canadian Climate Institute, 2024).
Reducing flood risk requires collaborative efforts from all levels of government, business, and civil society (Sayers et al., 2013). Achieving this “whole-of-society” approach requires that communities are well informed of the risks facing them, can participate in decision-making processes, and are properly resourced to take preparedness actions (Thistlethwaite et al., 2017; Minano & Peddle, 2018). This approach starts with effective risk communications; up-to-date flood maps are critical to communicating and understanding risk.
Flood maps help to build public risk awareness by allowing users to visualize local impacts, identify patterns and contextualize historical flood events, spark discussion about flood risk management solutions, and develop a shared sense of responsibility in engaging in household-scale and community-level flood preparedness (Minano & Peddle, 2018).

Figure 1: Select flood events in Canada (2021–2025) (left to right: Kelly Allen via CBC News, 2021; Brad Mapes via My True North Now, 2022; Rene Roy/Wreckhouse Press, 2022; Arlyn McAdorey/the Canadian Press, 2024; Lisa Grilz via CBC News, 2025).
Text version
A horizontal infographic titled “Flooding affects all regions of Canada.” At the top left of the title is an outline map of Canada. Beneath the title is a row of five photographs. Above the photographs are simple white line icons representing different flood-related conditions: flowing water, river flooding, coastal impacts, heavy rainfall, and underground water.
The first photograph labelled “Merritt, BC,” shows a town area with floodwaters spreading across roads and land near buildings.
The second photograph labelled “Hay River, NWT,” shows an aerial view of a river swollen with ice and water, flooding nearby areas.
The third photograph labelled “Port Aux Basque, NL,” shows a house tilted near a rocky shoreline during severe coastal flooding.
The fourth photograph labelled “Toronto, ON,” shows an urban street flooded with water, partially submerging vehicles and affecting traffic.
The fifth photograph labelled “Aberdeen, SK,” shows floodwater covering a residential street and surrounding homes.
2.1 Types of Floods
Flooding can occur in several ways. In Canada, there are generally seven types of floods: fluvial, pluvial, coastal, lake, ice jam, groundwater, and tsunami (Table 1). When flooding occurs, it is often due to a convergence of multiple types, each amplifying the effects of the others. These interactions create complex flood scenarios, where the severity and consequences are shaped not only by environmental conditions but also by socioeconomic factors that influence how communities experience and respond to the disaster (Partners for Action, 2024).
Table 1: Types of floods and their descriptions.
| TYPE OF FLOOD | DESCRIPTION |
|---|---|
| Fluvial (Riverine) |
|
| Pluvial |
|
| Coastal |
|
| Lake Flooding |
|
| Ice Jam |
|
| Groundwater |
|
| Tsunami |
|
Sources: Indigenous Climate Hub, 2026; Environment and Climate Change Canada, 2013; Ziolecki et al., 2020; NRCan, 2021.
2.2 Types of Flood Maps
Flood maps play a critical role in equipping communities with flood risk information and supporting discussions about flood risk preparedness and management (Minano & Peddle, 2018; Pralle, 2019). These maps can take different forms and serve different purposes depending on their design and intended audience. In Canada, flood maps can convey inundation, hazard/exposure, and risk, and be designed for technical decision-making or for public awareness, each serving a different purpose in flood management (NRCan, 2026c). Table 2 outlines the main flood map types.
Table 2: Main types of flood maps and their descriptions.
| TYPE OF FLOOD MAP | DESCRIPTION |
|---|---|
| Flood Inundation Map |
|
| Flood Hazard Map |
|
| Flood Risk Map |
|
| Flood Awareness Map |
|
Sources: NRCan & Public Safety Canada, 2019; NRCan, 2026c.
2.3 Challenges with Flood Mapping
Flood maps are a valuable tool to provide communities with important information about their flood risk. They are created using hydrological, social, and climate data. Unfortunately, limited resources and varying levels of available and comparable data contribute to challenges in the relevance, coverage, and access of these maps in the following ways:
- Outdated maps can leave communities exposed to risks they are unaware of and unprepared for, posing threats to their overall health, wealth, and welfare. Maps need to be updated regularly to account for changes in topography, development, and hydrology, as well as new data and technologies such as lidar, remote sensing, and modelling.
- Coverage gaps persist in rural and equity-deserving areas due to lower population density and/or fewer government-owned assets (Sparling et al., 2024). This coincides with the presence of systemic barriers, causing these communities to be more vulnerable to flooding while at the same time limiting their capacity to respond to adverse impacts (Fang et al., 2022).
- Inaccessibility through physical and technical barriers prevent many communities from accessing or understanding flood maps (Henstra et al., 2019). This highlights the importance of inclusive, accessible, and successful approaches to risk communication, information sharing, knowledge translation, and collaborative learning at the community scale and among target demographics (Wright et al., 2022).
- Limited climate integration into flood maps means that few maps account for future risks from climate change, such as sea-level rise and changing precipitation patterns (Mohanty & Simonovic, 2021; Darlington et al., 2024).
Community engagement can help overcome these challenges. Engaging communities, particularly those that are under-mapped, can fill gaps in technical data, improve accuracy, and enhance relevance—improving overall flood-risk awareness.
Additional Resources
Learn more about flooding in Turning the Tide: How Flood Risk Transparency Can Drive Equitable Outcomes in Canada from the Canadian Climate Institute (n.d.).
For an interactive example of a flood risk map, check out the Maritime Coastal Flood Risk Map from the Applied Geomatics Research Group (2017) at Nova Scotia Community College.
3.0 The Flood Mapping Process
Flood mapping involves different steps to integrate scientific modelling, community engagement, and risk assessments. It also requires different resources and expertise. In Canada, the responsibility of flood mapping typically rests with the provinces and territories. However, other actors are also involved in the process, ranging from federal, provincial, local, and Indigenous governments, watershed management organizations like conservation authorities, and private organizations involved in flood risk management (NRCan, 2026b). The process is guided by federal guidelines that offer standards and promote consistency; Natural Resources Canada, Public Safety Canada, Environment and Climate Change Canada, Crown-Indigenous Relations and Northern Affairs Canada, and Indigenous Services Canada support flood mapping with their programs.
NRCan’s Flood Mapping Framework provides a structured approach to flood risk assessment and mitigation (Figure 2). It outlines the stages of the flood mapping process:
- Priority setting helps identify high-risk areas that require updated maps.
- Data acquisition gathers meteorological, hydrological, historical, and elevation data to support modelling.
- Hazard assessment analyzes past precipitation and flow patterns to predict future flood scenarios.
- Modelling and mapping use hydrologic and hydraulic models to establish flood levels and spatially identify potential flood areas.
- Communication and dissemination seek to ensure that maps are accessible, and that information is disseminated so that communities can be engaged throughout the process.
- Risk assessment helps to identify high risk zones.
- Mitigation seeks to enforce zoning regulations, such as reducing the impervious surface ratio (ISR) of sites, restricting land use and development in flood hazard areas, and allocating resources toward flood mitigation strategies.
Engagement and collaboration can be embedded in every stage and involve diverse actors to improve the overall flood mapping process, seeking to inform community members and gather their feedback. The following sections will demonstrate how engagement can take many forms and can make use of different strategies and messaging depending on the intent and purpose.
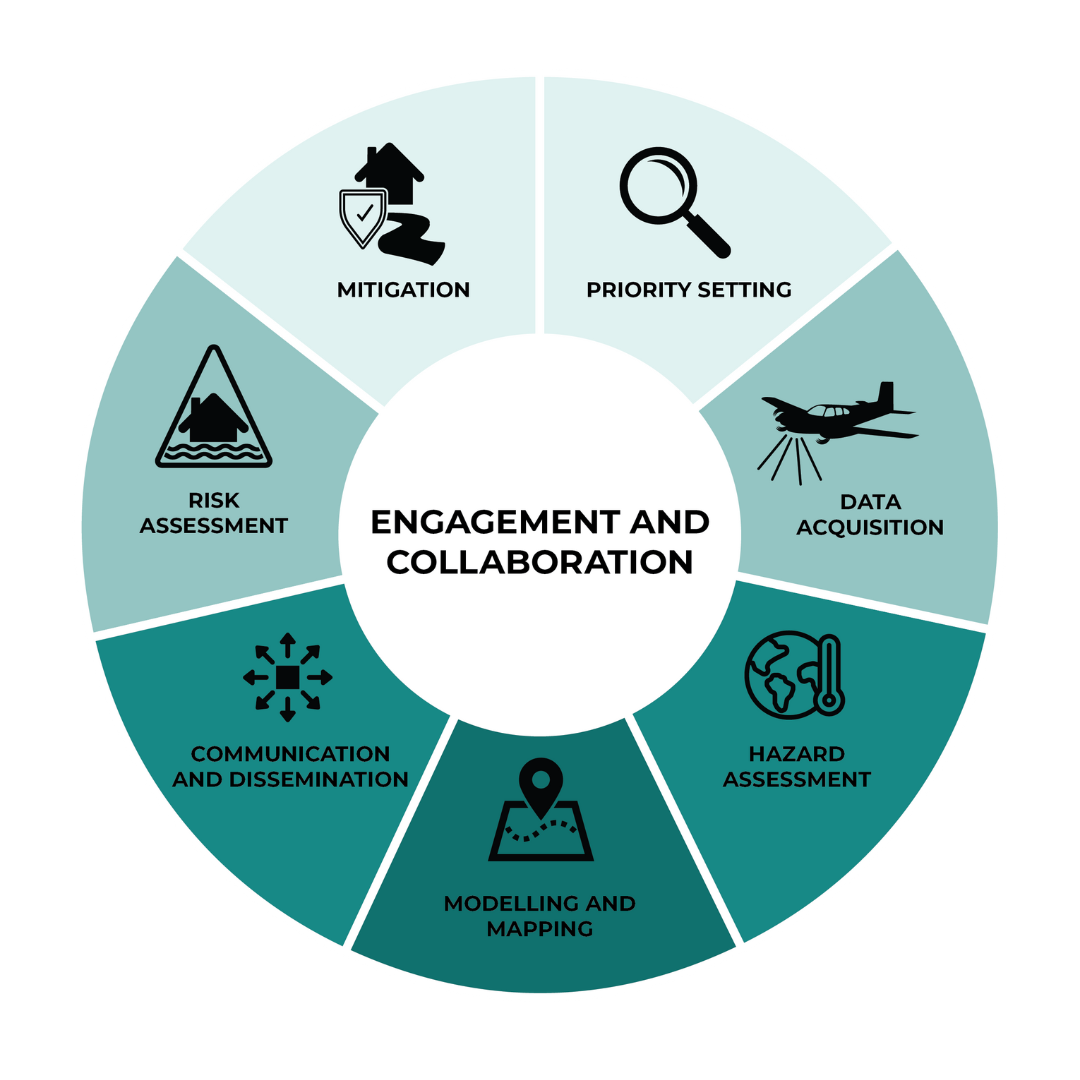
Figure 2: Flood Mapping Framework (NRCan, 2026c).
Text version
A circular infographic composed of interconnected puzzle-shaped segments arranged in a ring and a central circle. The central circle contains the text “ENGAGEMENT & COLLABORATION”. The infographic uses shades of blue-green.
The ring is made up of seven segments, each labelled with both text and an icon. The labels are:
Priority Setting, shown with a magnifying glass.
Data Acquisition, shown with an airplane collecting data.
Hazard Assessment, shown with a globe and thermometer.
Modelling and Mapping, shown with a map pin on a map.
Communication and Dissemination, shown with arrows radiating outward.
Risk Assessment, shown with a hazard warning triangle.
Mitigation, shown with an icon of a house and shield near a river.
Additional Resources
Visit NRCan’s Flood Mapping Process (2026c) for an explanation of the flood mapping process and the different resources available to assist in the creation of flood maps.
Visit NRCan’s Federal Flood Mapping Guidelines (2026a) to learn more about the different resources used to standardize flood mapping activities in Canada.
4.0 Community Engagement
Community engagement plays a vital role in shaping inclusive decision-making processes. For flood mapping, community engagement helps to ensure that local knowledge, lived experiences, and diverse perspectives are integrated, fostering trust and shared responsibility.
What Is Community Engagement?
Community refers to a “group of people who share a similar location, interest, belief, and/or social network that may be exposed to the same hazards or threats” (Sufri et al., 2020, p.3).
Engagement in the context of flood mapping is more than mere participation, defined as “the process of involving communities to collect, assess, monitor, and disseminate hazard risk information and responses” (Sufri et al., 2020, p.4).
Engaging communities in Canada in every stage of the process is critical in truly providing community members with the necessary understanding of the flood risks that they face (Minano & Peddle, 2018; St. Amour Gomes et al., 2018). No matter the stage of the flood mapping process, there are engagement and communication options available depending on what you want to achieve and what is feasible. Engagement activities and tools not only enhance scientific learning and literacy surrounding flood risk, adaptation, and resilience, but also provide a voice for local knowledge, experience, and perspectives to help community members understand how they might better prepare for and respond to flood events (Minano et al., 2017; Henstra & Thistlethwaite, 2018). This, in turn, can bolster trust and transparency between communities and authorities and build relationships.
Not all flood mapping projects or stages of the process require the same depth or types of involvement. Engagement can be seen as a spectrum of activities, and in crafting a community engagement plan it is your job to select activities that help you meet your flood mapping objectives.
Community vs. Stakeholder
This resource explicitly avoids the term stakeholder. Despite being widely used, the term has a colonial connotation, and its use may be construed as disrespectful of Indigenous Peoples and equity-denied, underrepresented, and underprivileged communities (Phipps, 2022). The term is also often used as a catch-all term, and sometimes might imply a passive or one-way relationship, rather than an active one where people have rights and agency (Hafferty et al., 2024). Instead, this resource uses community.
4.1 The Community Engagement Spectrum
The International Association of Public Participation (IAP2)’s Spectrum of Public Participation (IAP2, 2024) provides a useful framework for understanding the different levels of engagement possible throughout projects and decision-making processes. It helps to clarify the intent of the engagement by setting expectations and clarifying roles.
The Community Engagement Spectrum (CES) for these guidelines draws from IAP2’s spectrumFootnote 1 and describes five main types of engagement within the flood mapping process:
- Inform — provide the public with relevant and timely information, including ways community members can reach out with questions.
- Consult — allow decision-makers to obtain feedback on process, priorities, analysis, products, and/or decisions, which is then taken into consideration.
- Involve — work directly with the public throughout various stages of the process to ensure that community needs and assets are integrated into maps, processes, and planning.
- Collaborate — partner with community members and others (e.g., colleagues within your organization) in each aspect of the decision-making process, including the development of alternatives and solutions that align with common priorities.
- Empower — the community drives the priorities and controls decision-making.
What Does It Mean to Consult?
For the purposes of these flood mapping engagement guidelines, the term consult simply refers to obtaining and considering feedback, not the duty and honour of the Crown to consult with First Nations, Métis and Inuit communities as rightsholders.
- The term consult in the Community Engagement Spectrum refers to seeking feedback from members of the public or specific groups of people, with the aim of considering that input to inform decisions, proposals, initiatives, products, and processes.
- Duty to Consult is a legal requirement of the Crown as per Section 35 of the Canadian Constitution and is a principle established by the Supreme Court in Haida Nation v. British Columbia, 2004. This requirement applies when the government proposes something that could adversely affect the rights and title of Indigenous Peoples. The aim is to secure the free and prior informed consent (FPIC) of Indigenous communities as rightsholders before decisions are made or activities are approved.
- “Consult” as used in the Community Engagement Spectrum ¹ the Duty and Honour of the Crown to Consult.
For More Information
What You Need to Know About the Duty to Consult in Canada (Indigenous Corporate Training, 2025) explains Aboriginal Rights and Title, what triggers the Duty to Consult, who is responsible, FPIC, and meaningful consultation.
Indigenous Engagement Guidelines for Flood Mapping (NRCan, 2024). This resource outlines key principles and best practices for working with Indigenous communities throughout Canada when undertaking flood mapping.
Five levels of engagement are presented in the CES as puzzle pieces that connect throughout various stages of a project (Figure 3). These puzzle pieces can be rearranged and coupled to serve the specific needs and priorities of the community, project, and stage of the process. They are arranged here to reflect the increasing complexity in engagement and decision-making power that is shared with communities, and to reflect the flows of communication for each level of engagement. At one end of the spectrum, inform or consult requires mostly one-way communication, while involve, collaborate, and empower at the other end require mostly two-way communication.
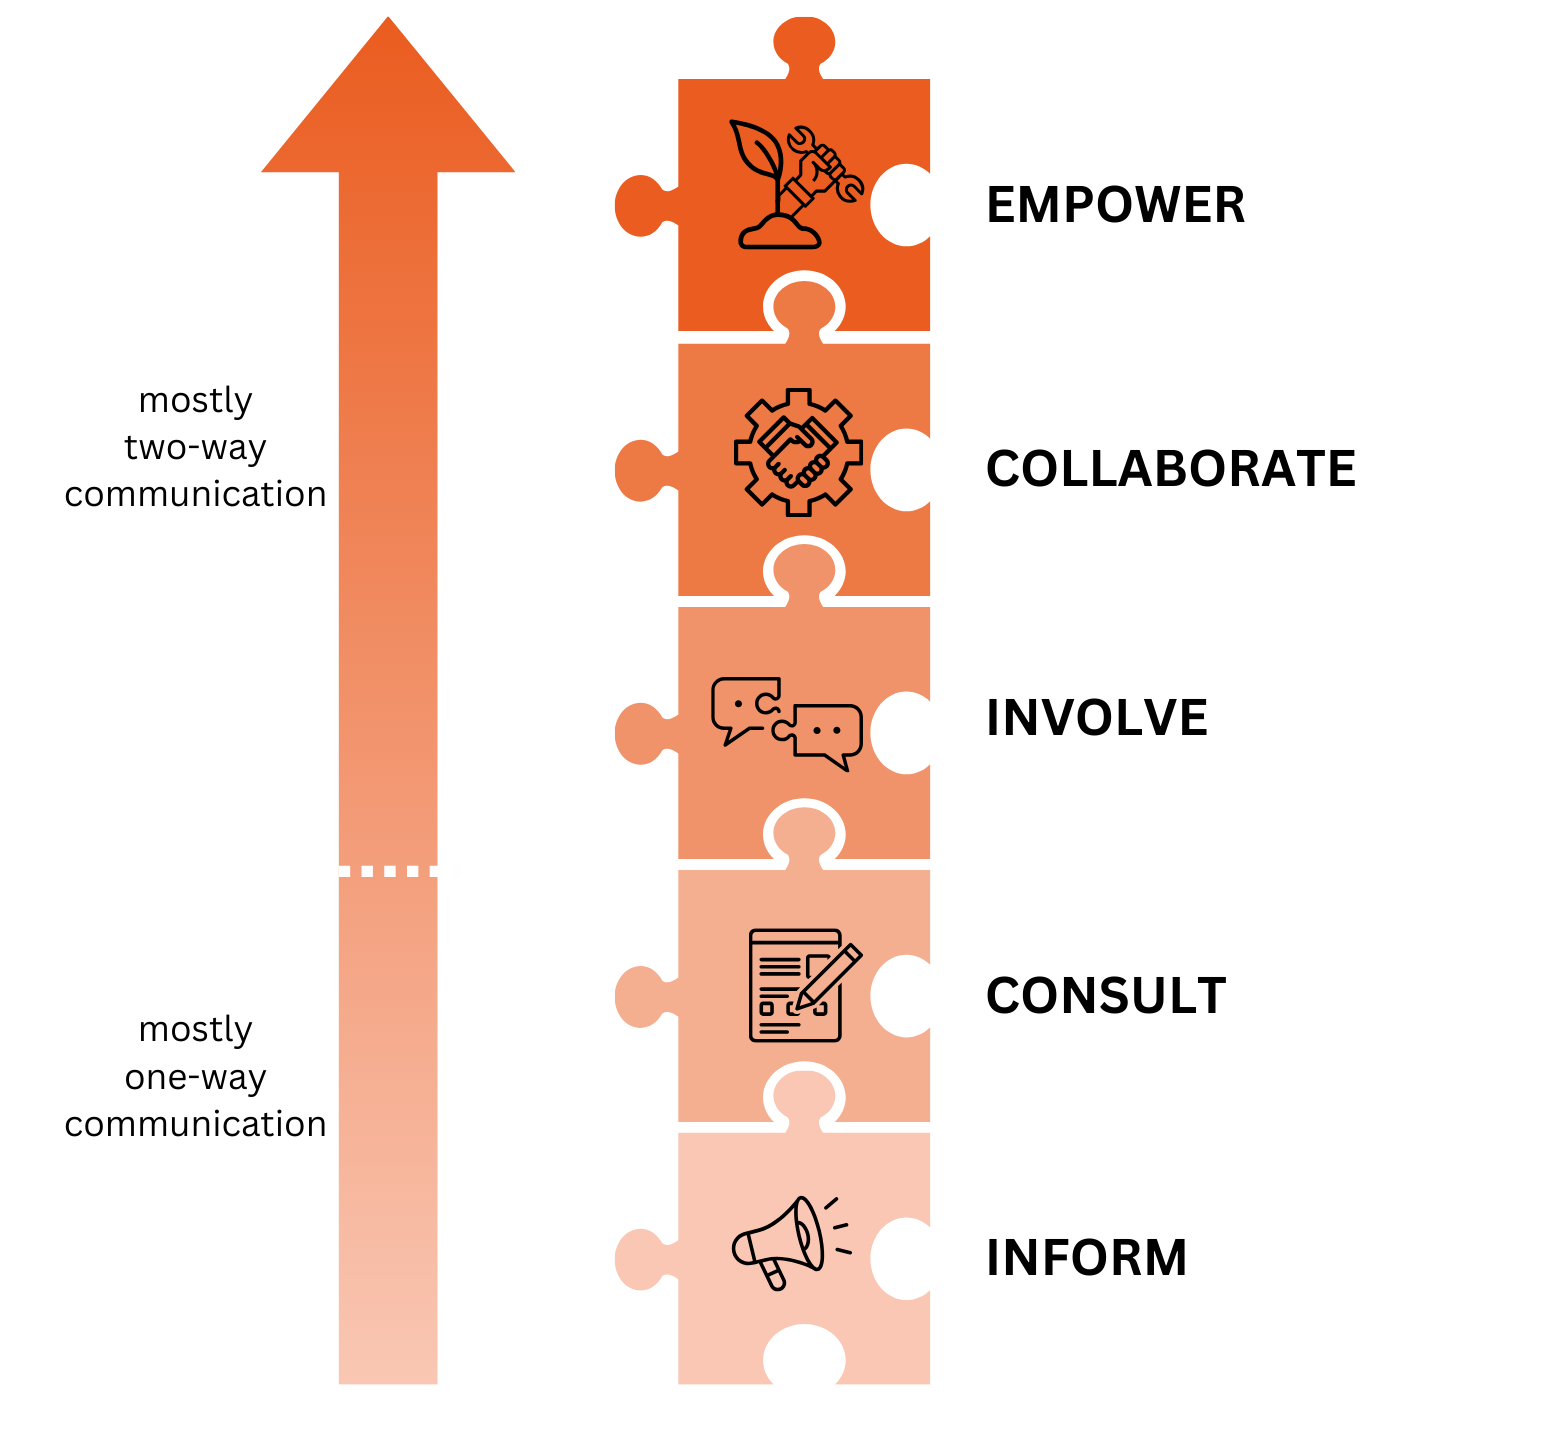
Figure 3: The Community Engagement Spectrum (CES) (adapted from IAP2, 2024).
Text version
A vertical spectrum of community engagement, shown as orange stacked puzzle-shaped blocks arranged from bottom to top. The blocks increase in colour intensity from light at the bottom to dark at the top.
On the right side, five engagement levels are listed from lightest to darkest:
Inform, shown at the bottom with a megaphone icon
Consult, with a document and pencil icon
Involve, with two speech bubbles
Collaborate, with a handshake inside a gear
Empower, at the top with a hand holding a plant
These puzzle pieces visually connect.
On the left side of the image, a large vertical arrow points upward. Text near the bottom of the arrow reads “mostly one-way communication.” Text near the top reads “mostly two-way communication.” A small, dashed line partway up the arrow aligns between the puzzle pieces “consult” and “involve” and separate the communication styles.
4.2 Leveraging the Full Spectrum of Communications
Communication is key across the different levels of engagement in the spectrum. At the levels of informing and consulting, communication is mostly one-way and information flows from organizations to the public or from the project lead to colleagues in other units of an organization, requiring attention to appropriate communication channels and messaging.
The more extensively that communities are involved and able to actively participate in the flood mapping process, the more communication becomes a two-way process with decision-making informed by continuous input. As the process moves towards collaboration and empowerment, communities are engaged in active dialogue and joint decision-making, allowing them to exercise increasing agency within the process.
For example, informing people about a project or about their community is generally done through one-directional communication. With consultations, people are asked for their feedback through targeted and focused questions. Involvement requires a more participatory and active role, meaning that people can have a higher level of responsibility and can shape outcomes more directly. Collaborating goes even further than involving; rather than participating, people develop a shared sense of responsibility and exercise joint decision-making power. Finally, empowerment seeks to shift the decision-making power to the community, taking a decentralized approach to how power and influence over decisions are distributed between formal decision-making authorities and those likely to be impacted by the decisions (Geekiyanage et al., 2021).
Table 3 describes the goals and key messages shared with communities for each level of engagement and provides example activities and communication flows. The table acts as a starting point when considering communication flows that support goals, objectives, and activities. It can be adapted to suit different needs and serves as the basis for selecting engagement activities to the flood mapping process (see Section 5, Table 4).
Table 3: Communication purpose and flow across the Community Engagement Spectrum.

| INFORM | CONSULT | INVOLVE | COLLABORATE | EMPOWER | |
|---|---|---|---|---|---|
| Message to the Community | We will keep you informed | Your concerns are reflected, and public input is considered | Your input helps address community needs and priorities and develop alternatives | You iteratively co-develop solutions | We will implement what you decide |
| Community Engagement Goals | Provide relevant and timely information, including ways that community members can reach out with questions | Obtain feedback on concerns, priorities, analysis, and decisions | Work directly with people to ensure community needs and assets are integrated into maps, processes, and planning | Work together with the community at each step of the decision-making process | Ensure that community controls decision-making |
| Example Activities | Project website, townhalls, information booths | Social media, polls, public meetings | Focus groups, workshops, house meetings | Working sessions, community planning, participatory budgeting | Participatory action research, Citizen Advisory Committees |
| Communication Flow |
One-way: dissemination Information flows from your organization to the community with no expectation of dialogue. However, contact information is provided for recipients to reach out with questions or to seek clarification. |
One-way: feedback Input is gathered from the community, but decision-making remains within the organization. |
Two-way: intermittent Input is gathered directly from the community to guide decision-making. |
Two-way: ongoing Continual and active dialogue with community members taking on decision-making. |
Two-way: community-led The organization provides support, resources, and facilitation, rather than decision-making. The community drives the conversation, determining the direction of the process. |
Sources: Adapted from IAP2, 2024; Gonzalez, 2019; Fang et al., 2022.
Part 2: get established
Integrate the community engagement spectrum with the flood mapping process
5.0 Engaging Communities in Flood Mapping
Engagement can take many forms, integrating different types of activities and a range of actors. Because of this diversity, engagement and inclusive communication can complement any stage of the flood mapping process to help reach project objectives. Engagement levels can be thought of as puzzle pieces that can connect to any and every other piece, allowing engagement activities to be chosen or rearranged to align with any stage or objective of the project (Figure 4).
It is critical to engage communities in culturally relevant and place-based ways, especially if an objective is for communities to take actions for emergency preparedness and disaster risk reduction. It is important that participants feel their contributions are valued and that their local knowledge, expertise, concerns, and priorities are integrated into maps and messaging in ways that matter to them. The ability of a community engagement plan to be dynamic and adaptive allows it to meet the contextual needs of the local community.
Matching project objectives to the level of community engagement and understanding some of the benefits and challenges of engagement are important considerations described in the following sections.
Engage with Communities as Early as You Can
Engagement at different stages of the flood mapping process can impact the types of technical outputs produced, and the level of public understanding and trust in the maps themselves.
Engagement early in the flood mapping process can help identify community priorities and concerns, providing opportunities to address potential conflicts or misunderstandings for a smoother process, and to gain buy-in. Early engagement is not always feasible due to resource constraints or tight project timelines but waiting to engage communities until later in the process risks limiting community insights, such as historical accounts and drainage issues, which in turn may result in maps that fail to accurately reflect local conditions.
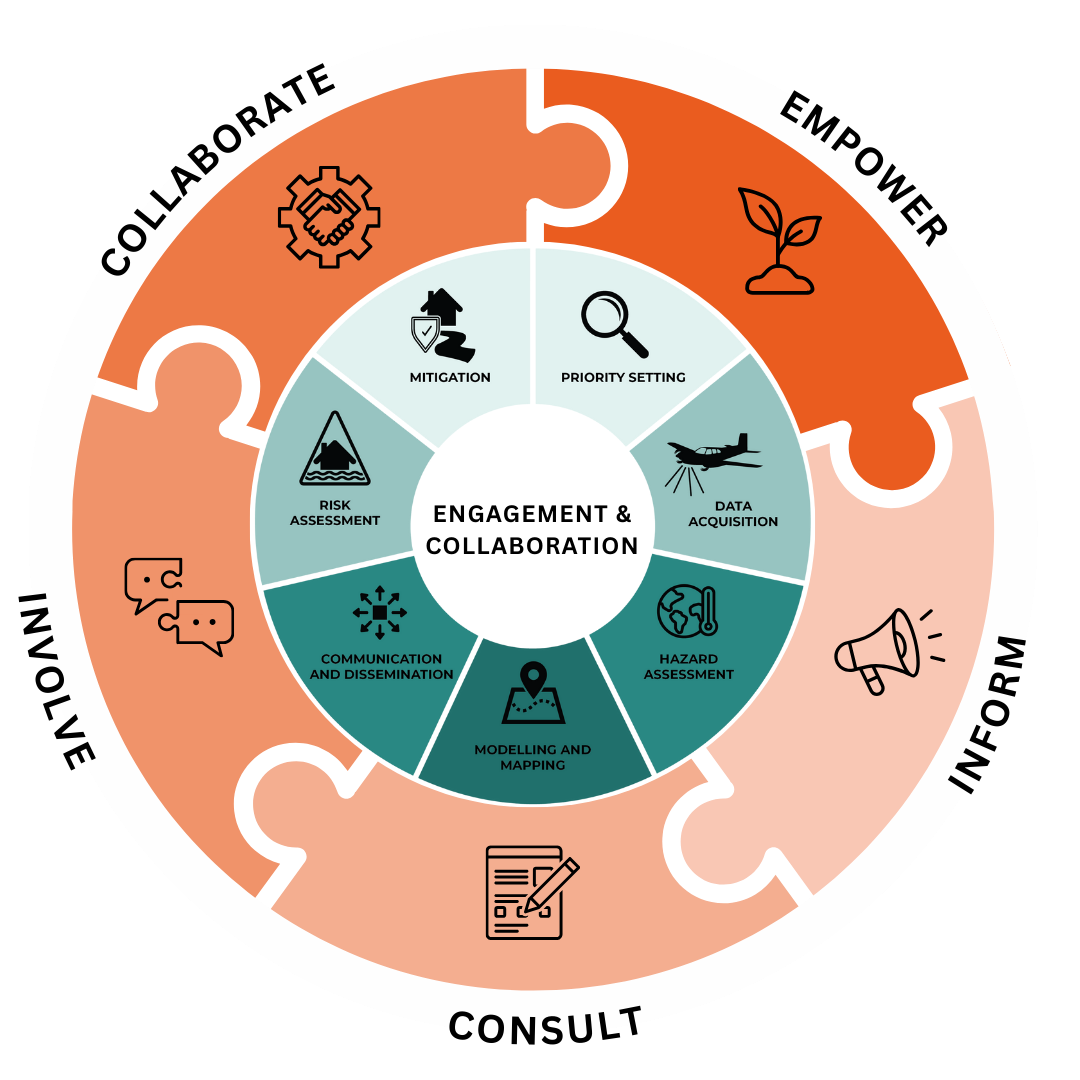
Figure 4: Combining the Federal Flood Mapping Framework and the Community Engagement Spectrum (adapted from IAP2, 2024, and NRCan, 2026c).
Text version
A circular infographic composed of interconnected puzzle-shaped segments arranged in an outer ring around an inner ring and a central circle. The central circle contains the text “ENGAGEMENT & COLLABORATION.” The infographic uses shades of orange on the outer ring and shades of blue-green on the inner ring.
The inner ring is made up of seven segments, each labelled with both text and an icon. The labels are:
Priority Setting, shown with a magnifying glass.
Data Acquisition, shown with an airplane collecting data.
Hazard Assessment, shown with a globe and thermometer.
Modelling and Mapping, shown with a map pin on a map.
Communication and Dissemination, shown with arrows radiating outward.
Risk Assessment, shown with a hazard warning triangle.
Mitigation, shown with an icon of a house and shield near a river.
Encircling the inner ring is a larger outer ring made of five large puzzle pieces. Each outer ring segment contains a single word and an accompanying icon:
Inform, with an icon of a megaphone.
Consult, with an icon of a document and pencil.
Involve, with an icon of two overlapping speech bubbles.
Collaborate, with an icon of two hands shaking inside a gear.
Empower, with an icon of a hand holding a wrench, growing out of a small plant.
The words are positioned along the outer edge of the circle. The puzzle-piece shapes visually interlock.
5.1 Objectives of Engagement
Each stage of the flood mapping process has a range of objectives that can be supported by community engagement (Table 4). Choosing the desired engagement objective for your mapping project will help you determine the level of engagement most appropriate for your purposes. Alignment between the objective and the level of engagement will provide the foundation of a successful community engagement plan that delivers on expectations.
Table 4: Community engagement objectives for the flood mapping process.
| INFORM | CONSULT | INVOLVE | COLLABORATE | EMPOWER | |
| Goal | Provide relevant and timely information, including ways community members can reach out with questions | Obtain feedback on concerns, priorities, analysis, and decisions | Work directly with people to ensure community needs and assets are integrated into maps, processes, and planning | Work together with community at each step of the decision-making process | Ensure that community drives priorities and controls decision-making |
| Message(s) to Community | We will keep you informed | Your concerns are reflected, and public input is considered | Your input helps address community needs and priorities and develop alternatives | You iteratively co-develop solutions | We will implement what you decide |
| Priority Setting | Share information with communities about what is being done and why | Identify and integrate local and Traditional Knowledge, community priorities, and concerns through targeted questions | Implement participatory and roundtable discussions on community priorities and experiences | Identify and prioritize areas at high risk through co-designed workshops, such as scenario planning | Facilitate community-led decision-making on priorities |
| Data Acquisition | Share information about data collection and processing methods to communities | Seek input from community members on data gaps or discrepancies | Gain information (e.g., lived experiences) from local knowledge and Traditional Knowledge | Co-develop insights by integrating personal lived experiences, local knowledge, and Traditional Knowledge | Enable community-led data collection and citizen science with guidance from technical experts |
| Hazard Assessment | Explain hazard assessment methods and key risks to community members | Confirm information against personal lived experiences, local knowledge, and Traditional Knowledge | Engage community in validating hazard assessments | Co-develop hazard assessments with community insights | Ensure community participates in designing assessment criteria and interpreting findings |
| Modelling & Mapping | Share new models and maps to community members, providing rationale for their development | Obtain feedback from community members on map design and usability | Validate, calibrate, or ground-truth maps through community review sessions | Obtain feedback from community members on preliminary maps and cartographic design, usability, and relevance | Develop support systems and community-owned toolkits to guide the use of maps in planning processes |
| Communication & Dissemination | Share finalized maps and risk information, as well as contact information for future feedback | Confirm relevance and usability of maps and distribution methods with community members | Identify community’s preferred communication channels for public map dissemination | Co-develop a public community strategy for the dissemination of maps and flood risk information, addressing accessibility concerns | Facilitate community-led communication and data-sharing practices |
| Risk Assessment | Communicate potential impacts and risks to communities | Seek input on community-specific vulnerabilities and concerns | Help prioritize where to focus attention to reduce risk to the community | Validate models and data against community experiences of high-risk areas | Support community-led risk assessments and participatory decision-making |
| Mitigation | Provide information on mitigation options to communities | Gather community perspectives on potential mitigation strategies | Discuss trade-offs and feasibility of mitigation measures with communities | Align emergency response plans with mapped high-risk zones and other structural mitigation efforts | Support community-led decision-making, design, and implementation of mitigation strategies |
Sources: Adapted from IAP2, 2024; Gonzalez, 2019; NRCan, 2026c.
5.2 Benefits of Engagement
Flood resilience is largely dependent on trust and social acceptance; therefore, fostering relationships is essential for the successful implementation of flood risk management strategies (NRC, 2012). When the public trusts project leaders and the other parties involved, they are more likely to be supportive of outcomes and responsive to the information (NRC, 2012). When trust is established, communities are more likely to support an agency's approach to flood risk management, to take proactive actions to reduce their flood risk, and to adhere to flood evacuation protocols (Meyer, et al., 2012; NRC, 2012; Wehn et al., 2015).
Involving the public and other community actors in the flood mapping process can offer a range of benefits, including increased transparency, improved accuracy and relevance of flood maps, and enhanced community understandings of risk (Mirza et al., 2012; NRC, 2012; Katz, 2017). Similarly, encouraging dialogue between the public and authorities helps to establish rapport and confidence between actors (International Institute for Environment and Development, 2009; Wehn et al., 2015). Integrating local and traditional knowledge with scientific knowledge, such as through the calibration of maps and ‘ground-truthing’ of data using local information or integrating citizen science, also helps to establish a trusted relationship between actors, while also contextualizing mapping results within local realities (International Institute for Environment and Development, 2009; Oulahen et al., 2015; Sy et al., 2018).
5.3 Challenges to Engagement and Strategies for Overcoming
While successful engagement in flood mapping can foster stronger levels of community participation in flood risk management, it is not always an easy or straightforward process. Differing priorities and resource constraints can hinder engagement efforts and pose challenges. These challenges include:
- insufficient accessibility, time, and capacity
- lack of social acceptance and consensus
- tensions or disagreements
- power imbalances
- trauma in communities
- risk disclosure concerns.
Being aware of these challenges can help you prepare for them in advance. An overview of these challenges and strategies for reducing them is provided below.
Challenge 1: Increasing accessibility
With any engagement activity, it is important to identify the accessibility needs of the community early in the process and to tailor your programming accordingly to reduce barriers to participation. Consider the timing and location of the event, and why some might experience difficulties attending as a result (e.g., working hours, childcare needs, transportation barriers). Where possible and necessary, provide accessibility supports, such as translation services and audio-visual aids, as well as remuneration such as participant compensation and food/meals and refreshments.
It is also best practice to provide a variety of types of engagement to maximize reach. Using a mixture of in-person, hybrid, and online activities, communicating through multiple channels (e.g., print, broadcast, online), and partnering with local advocacy groups and community organizations (e.g., those working with seniors, people with disabilities, low-income residents, and housing-insecure residents) can help broaden inclusion and outreach.
Challenge 2: Ensuring sufficient time and capacity
Fixed project timelines, staff capacity, and resource constraints can pose challenges to equitably engaging communities in the flood mapping process. When eliciting input, consider when and how feedback will be incorporated throughout the process. Build flexibility into your project timeline to allow for sufficient time for engagement and identify which engagement methods will be most appropriate for meeting your goals and objectives.
Where there are internal capacity gaps, consider partnering with other organizations (e.g., researchers, not-for-profits) working on flood risk management issues. Look for existing synergies between departments and agencies. This can help you identify any opportunities for strategic alignment, both reducing silos and maximizing shared resources.
There may also be advocacy organizations who have capacity to engage on behalf of broader segments of the population and report back. Offering a variety of engagement options, with varying degrees of time and commitment expectations, is recommended to reach the most people.
Be mindful of “engagement fatigue,” particularly among key community champions or Indigenous leadership, who may be expected to engage in many other initiatives and thus may possess limited capacity. Clearly communicate the purpose of the engagement activity and plan for sufficient time when scheduling events, while keeping it efficient and reasonable in duration and effort expected.
Community Champions
Community champions are individuals who often serve as advocates, connectors, and mobilizers, helping to bridge gaps in communication. Their involvement can enhance participation, foster inclusivity, and ensure that engagement efforts align with community needs and priorities (Carmen et al., 2022). Identifying these individuals can help projects meet community needs and foster trust, often playing a crucial role in facilitating participation, input, and buy-in by acting as intermediaries between organizations and communities.
Challenge 3: Building social acceptance
Involving communities in flood mapping projects, which could potentially impact their current and future homes and livelihoods, can prompt opposition and backlash from residents (Howard & Sherren, 2023). Not accounting for diverse community perspectives can threaten the social acceptability and political feasibility of engaging in such projects. However, this backlash can be anticipated and planned for, which may in turn increase transparency and responsiveness, as the community is more involved throughout the process.
Communities that are engaged early, often, and equitably are more likely to feel that their needs are being met and that their priorities are adequately reflected in the project’s outcomes, building social acceptance (Ryder et al., 2023). Therefore, it is important to allow communities sufficient time to provide relevant input and to maintain transparent communication throughout the process (Aslin & Brown, 2004).
Challenge 4: Moving toward consensus and a shared vision
Centring community values within flood mapping processes can help to gain consensus by ensuring that flood risk management planning efforts are grounded in local realities (O’Brien & Wolf, 2010; Armitage et al., 2011). When engaging communities, it is important to remember that different individuals and groups each possess diverse backgrounds, world views, values systems, lived experiences, strengths, and limitations; therefore, recognize and acknowledge that there is often no unanimous consensus or absolute reality shared by all participants. Divergent and conflicting perspectives are to be expected.
Creating a safe, welcoming space for all participants to voice their perspectives is essential. Participatory flood mapping processes can help to facilitate constructive dialogue between community members and bridge gaps in understanding, empowering participants to make connections, find common values, and work together to develop shared visions for the future (Armitage et al., 2011; Cone et al., 2013; Lueck et al., 2024).
Challenge 5: Navigating tensions
Flood mapping, and land-use planning in general, can be highly sensitive and polarizing. This is especially the case when working with communities that have experienced prior spatial injustices (e.g., environmental racism, segregated zoning) or conflicts over natural resources.
Identify pre-existing points of contention and account for these sensitivities when planning engagement activities. This can be done by partnering with trusted community organizations and champions, hiring specialized individuals familiar with the local context (e.g., cultural advisors), and ensuring that engagement activities are socially and culturally appropriate.
At the start of any engagement activity, take time to set the tone for safe and respectful dialogue. This can be done by establishing clear boundaries and expectations, maintaining a focused discussion, and communicating how participants may use the information they have learned. The Chatham House Rule is commonly used to establish trust among participants and facilitate freedom of expression by allowing participants to discuss ideas outside of the session as long as identifying details about the speaker and their organizational affiliation remains confidential (Chatham House, n.d.).
Consider your goals and objectives to determine if alternative modes of engagement may be suitable. For example, interactive multimedia platforms, creative visualizations, and serious games, which may include roleplay and fictional flood mapping scenarios, can be used to enhance flood risk awareness, facilitate discussion around complex issues, and explore risk management solutions without the pressure of using real-world maps (Dulic et al., 2011; Khoury et al., 2018; Bogdan et al., 2021; Bogdan & Cottar, 2022).
Challenge 6: Reducing power imbalances
Natural resource governance and flood risk management decision-making in Canada have historically privileged certain demographics and communities, as well as some values over others, leading to disparities in who benefits and who is disadvantaged. To avoid perpetuating further power imbalances, it is important to create space for equity-denied, disenfranchised, and underrepresented voices. Facilitators can steer the flow of conversation, with the aim that no individual or organization dominates the conversation. Having protocols in place to support conflict resolution, diffuse tensions, and address harmful narratives are strongly encouraged to ensure the safety and mental wellbeing of all participants.
Power imbalances can not only occur between participants, but also between project leads and community participants, especially when working with historically equity-denied or disenfranchised populations. To be aware of and address these imbalances, project leads can: incorporate ongoing reflexive practices, reflecting on how their positionality intersects with the work and identifying any potential unconscious biases (Rees & Doyon, 2023); integrate the various dimensions of equity and justice within community engagement exercises, which is key for inclusive, participatory processes (Okamoto & Doyon, 2024); lead with listening, and take strength-based approaches that centre around community assets and capabilities, as opposed to their vulnerabilities, to help promote trusted dialogue (Tamarack Institute, 2026; Climigration Network, 2021).
Challenge 7: Working with trauma-affected communities
Asking people to share their lived experiences, even related to seemingly simple questions, such as where to map, may bring negative past experiences. To avoid perpetuating further harm, consider the potential risks of engaging with trauma-affected communities, such as those who have experienced historic injustices (e.g., intergenerational trauma due to colonialism and systemic racism) or traumatic events (e.g., a flood disaster). Trauma can create invisible barriers that limit an individual’s ability to fully and freely participate in outreach and engagement activities (Marris & Braden, 2023).
Consider how you can engage in a trauma-informed manner. This may involve providing or directing people to support services and resources, consulting with professionals, or partnering with a trusted community organization. Doing so can help to avoid re-traumatization, improve accessibility and inclusion, build trust, and strengthen belonging and community cohesion (Marris & Braden, 2023).
Challenge 8: Disclosing and mitigating risk
Risk communication is critical for strengthening a community’s flood resilience and an important element of flood mapping engagement. The public needs to be aware of flood risks, and to be adequately equipped with knowledge and understanding to help them protect themselves, their families, and their properties from flood damage. However, there can be concerns with how the disclosure of risk information may be interpreted, particularly with respect to property values and flood insurance premiums. Although these are valid considerations, what is most important is the long-term safety and wellbeing of those living within, or moving to, a flood-prone area.
The benefits of knowing one’s risk through access to high-quality information (e.g., flood maps) is a crucial step toward knowing how to mitigate that risk; such benefits outweigh any marginal and temporary impacts to property value by flood mapping (Lyle et al., 2024). Raising the public’s awareness on flood risk can influence community members to better protect themselves, such as purchasing optional home flood insurance, which can mitigate the costs of future damages (Cooke Insurance Group, 2017; Minano et al., 2021).
Additional Resources
For more information on trauma-informed practices, refer to the Campaign for Trauma-Informed Policy and Practice’s Resource Center (n.d.) and Guide: Trauma-Informed Meetings, Discussions, and Conversations (Marris & Braden, 2023).
Read more about strengths-based approaches, such as Tamarack Institute’s guidance on asset-based community development ABCD in Canada (2026).
For practical guidance on how to engage communities on sensitive topics, read Climigration Network’s report Lead with Listening: A Guidebook for Community Conversations on Climate Migration (2021).
Part 3: get going
Identify the right tools and activities for your goals and objectives
6.0 Toolkit: Engagement in Flood Mapping
Each community is unique, and any engagement plan needs to recognize and address community-specific needs and interests while also taking into consideration the resources available to implement them. This engagement plan toolkit offers general common practices and considerations to help plan community outreach and engagement during the flood mapping process and beyond. Engagement can occur at any stage of the mapping process—from the onset, throughout map production, and prior to map publication.
An engagement plan serves as a blueprint that clearly outlines the goals, intended audiences, necessary activities, targeted messages, and appropriate communications channels. Integral to an engagement plan’s success is establishing the right communication channels and messages to best understand the issues that communities care about and that motivate them to act (Federal Emergency Management Agency, 2021).
A well-constructed engagement plan takes time and resources to develop and implement. It also requires that individuals work collaboratively with their colleagues and be willing to make difficult choices. These choices may involve prioritizing one audience over others or realizing that a particular activity is not appropriate for certain contexts.
Planning for your engagement sessions is a crucial component to the project's success. The planning process can be easily navigated by answering: Why? Who? What? How? What next? These questions are the basis for developing an engagement plan and have been organized into five steps comprising the engagement planning process (Figure 5).
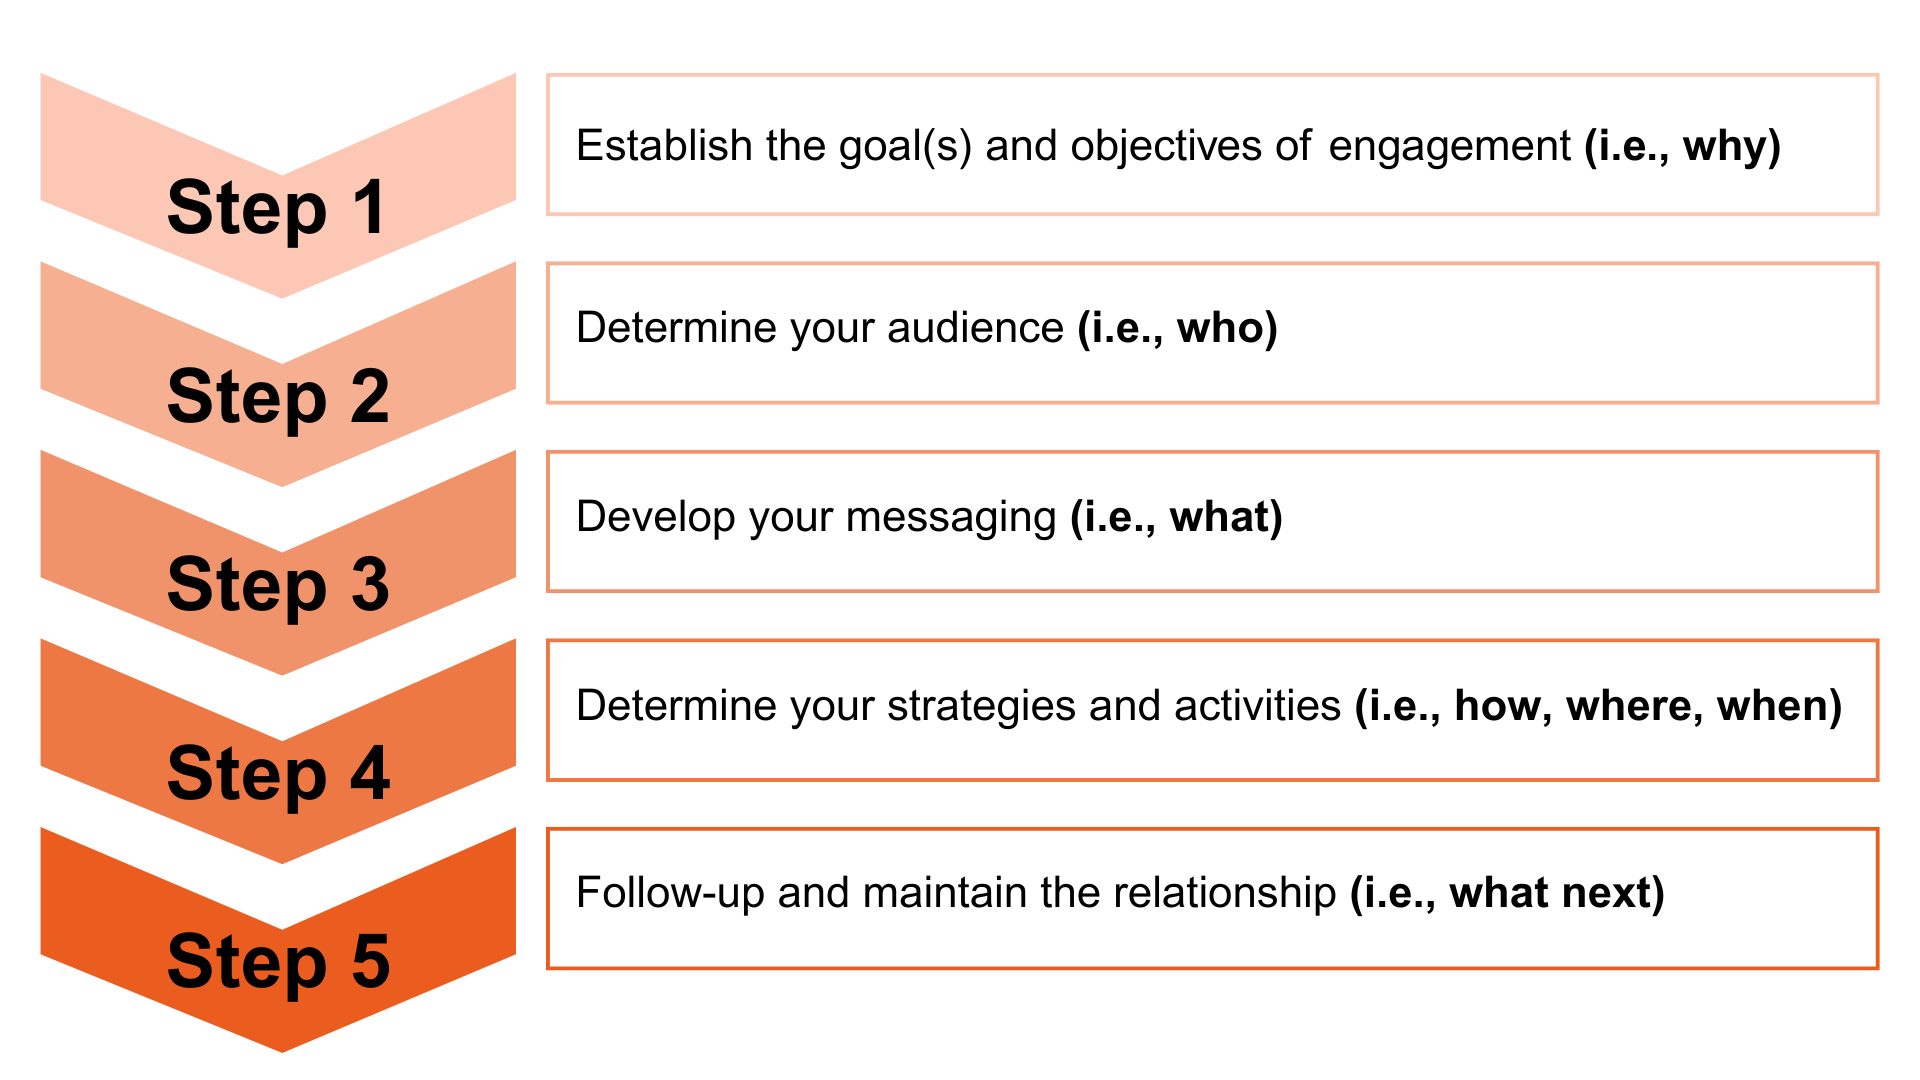
Figure 5: The five steps of the engagement planning process.
Text version
A five-step engagement process arranged vertically from top to bottom. Each step is displayed on the left as a stacked, downward-pointing chevron shape in progressively darker shades of orange, labelled sequentially from Steps 1 to 5. To the right of each step label is a rectangular box outlined in orange that contains the corresponding description text.
Step 1 appears at the top in a light peach colour and is labelled “Step 1.” The accompanying text reads: “Establish the goals and objectives of engagement.”
Step 2, shown in a slightly darker orange shade, is labelled “Step 2.” The text beside it reads: “Identify the audiences for engagement.”
Step 3 continues the sequence in a deeper orange tone and is labelled “Step 3.” The descriptive text reads: “Develop engagement messages.”
Step 4, displayed in an even darker orange, is labelled “Step 4.” The text reads: “Determine engagement strategies and activities.”
Step 5, shown at the bottom in the darkest orange colour, is labelled “Step 5.” The accompanying text reads: “Follow-up, share, and stay in touch.”
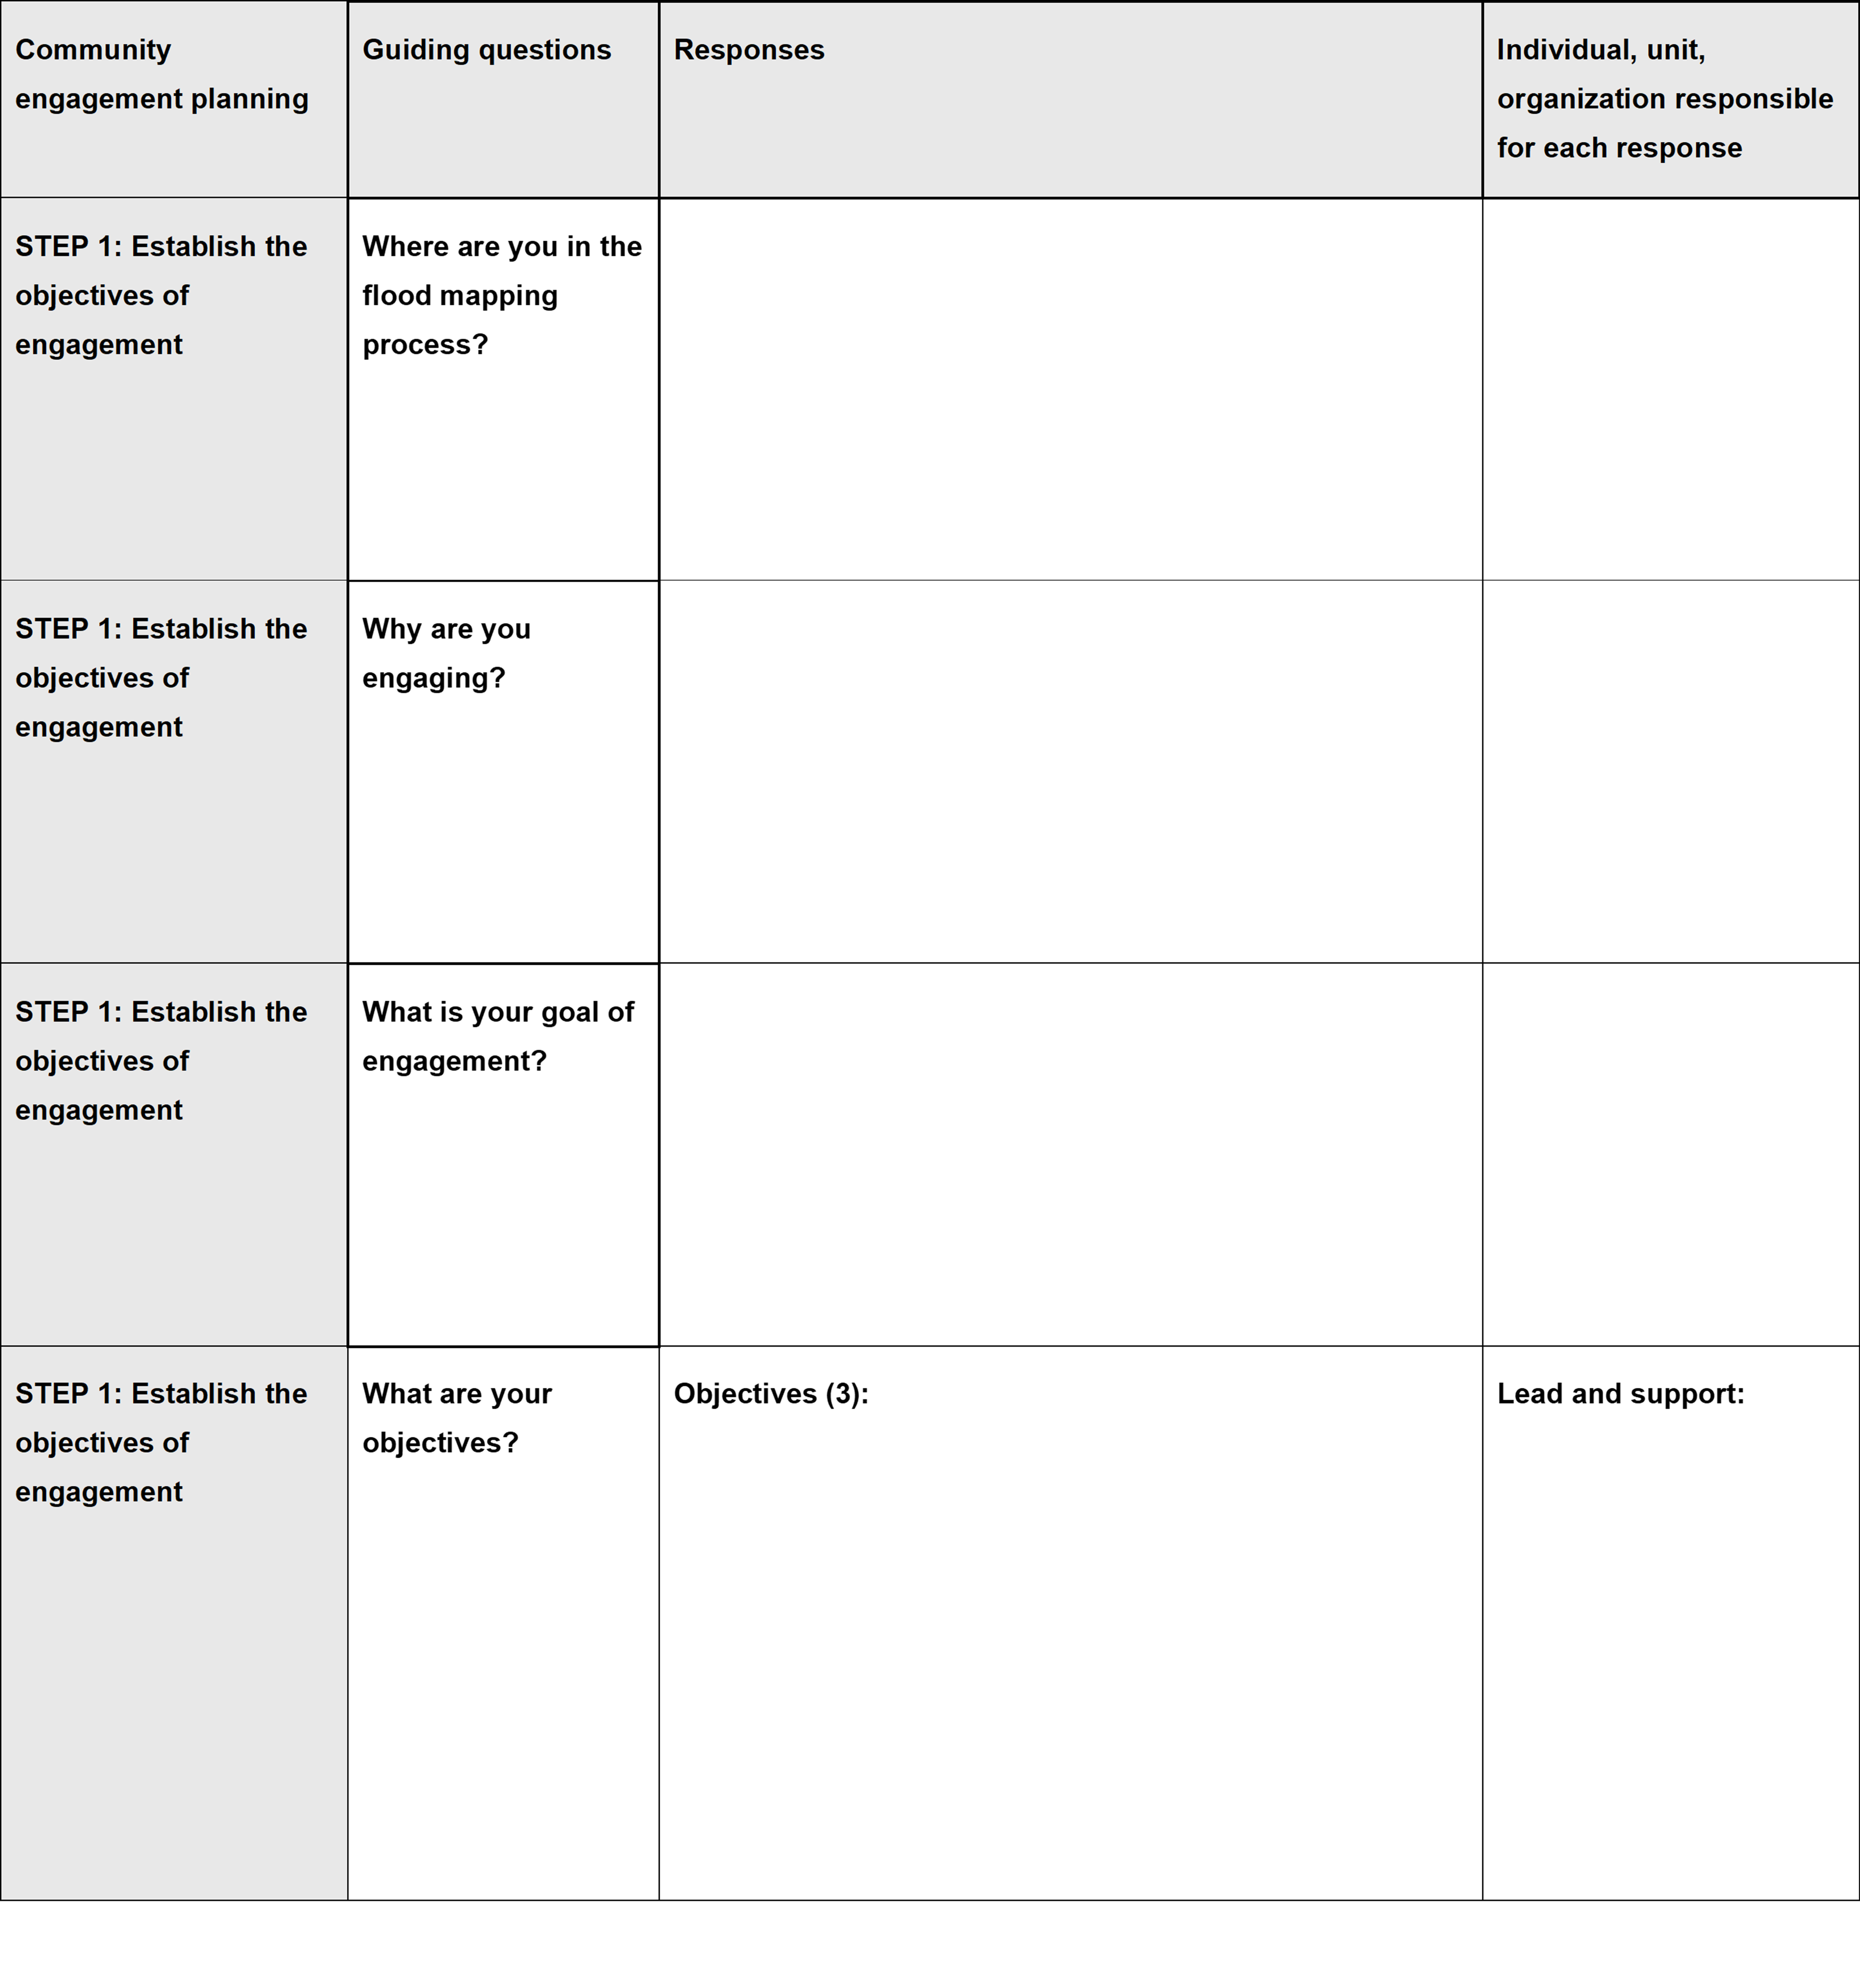
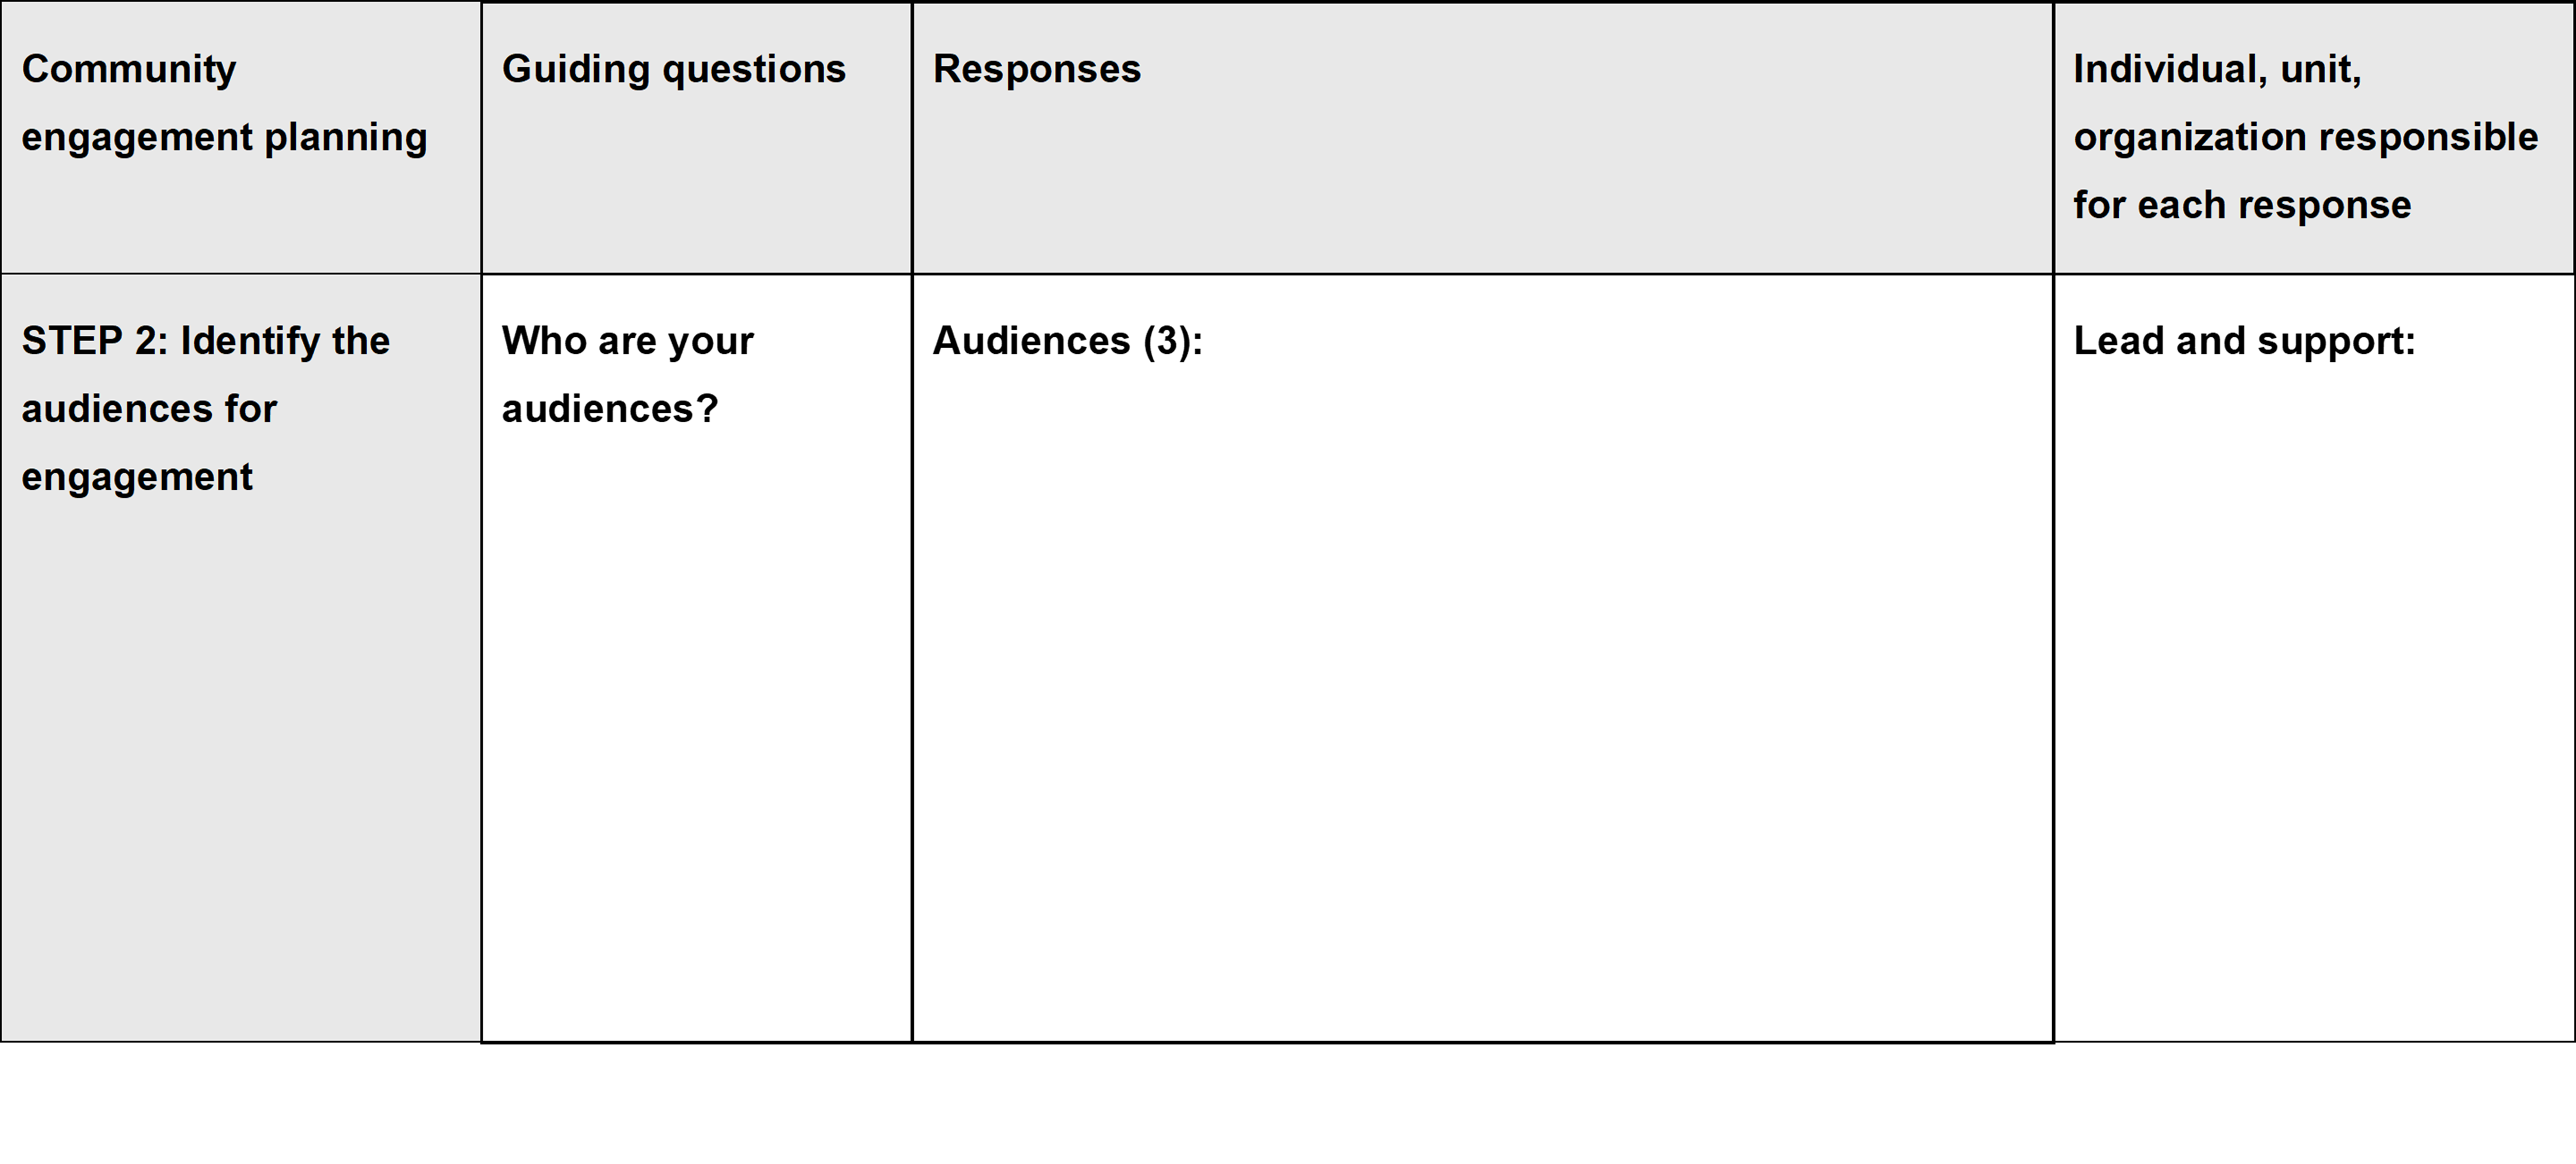
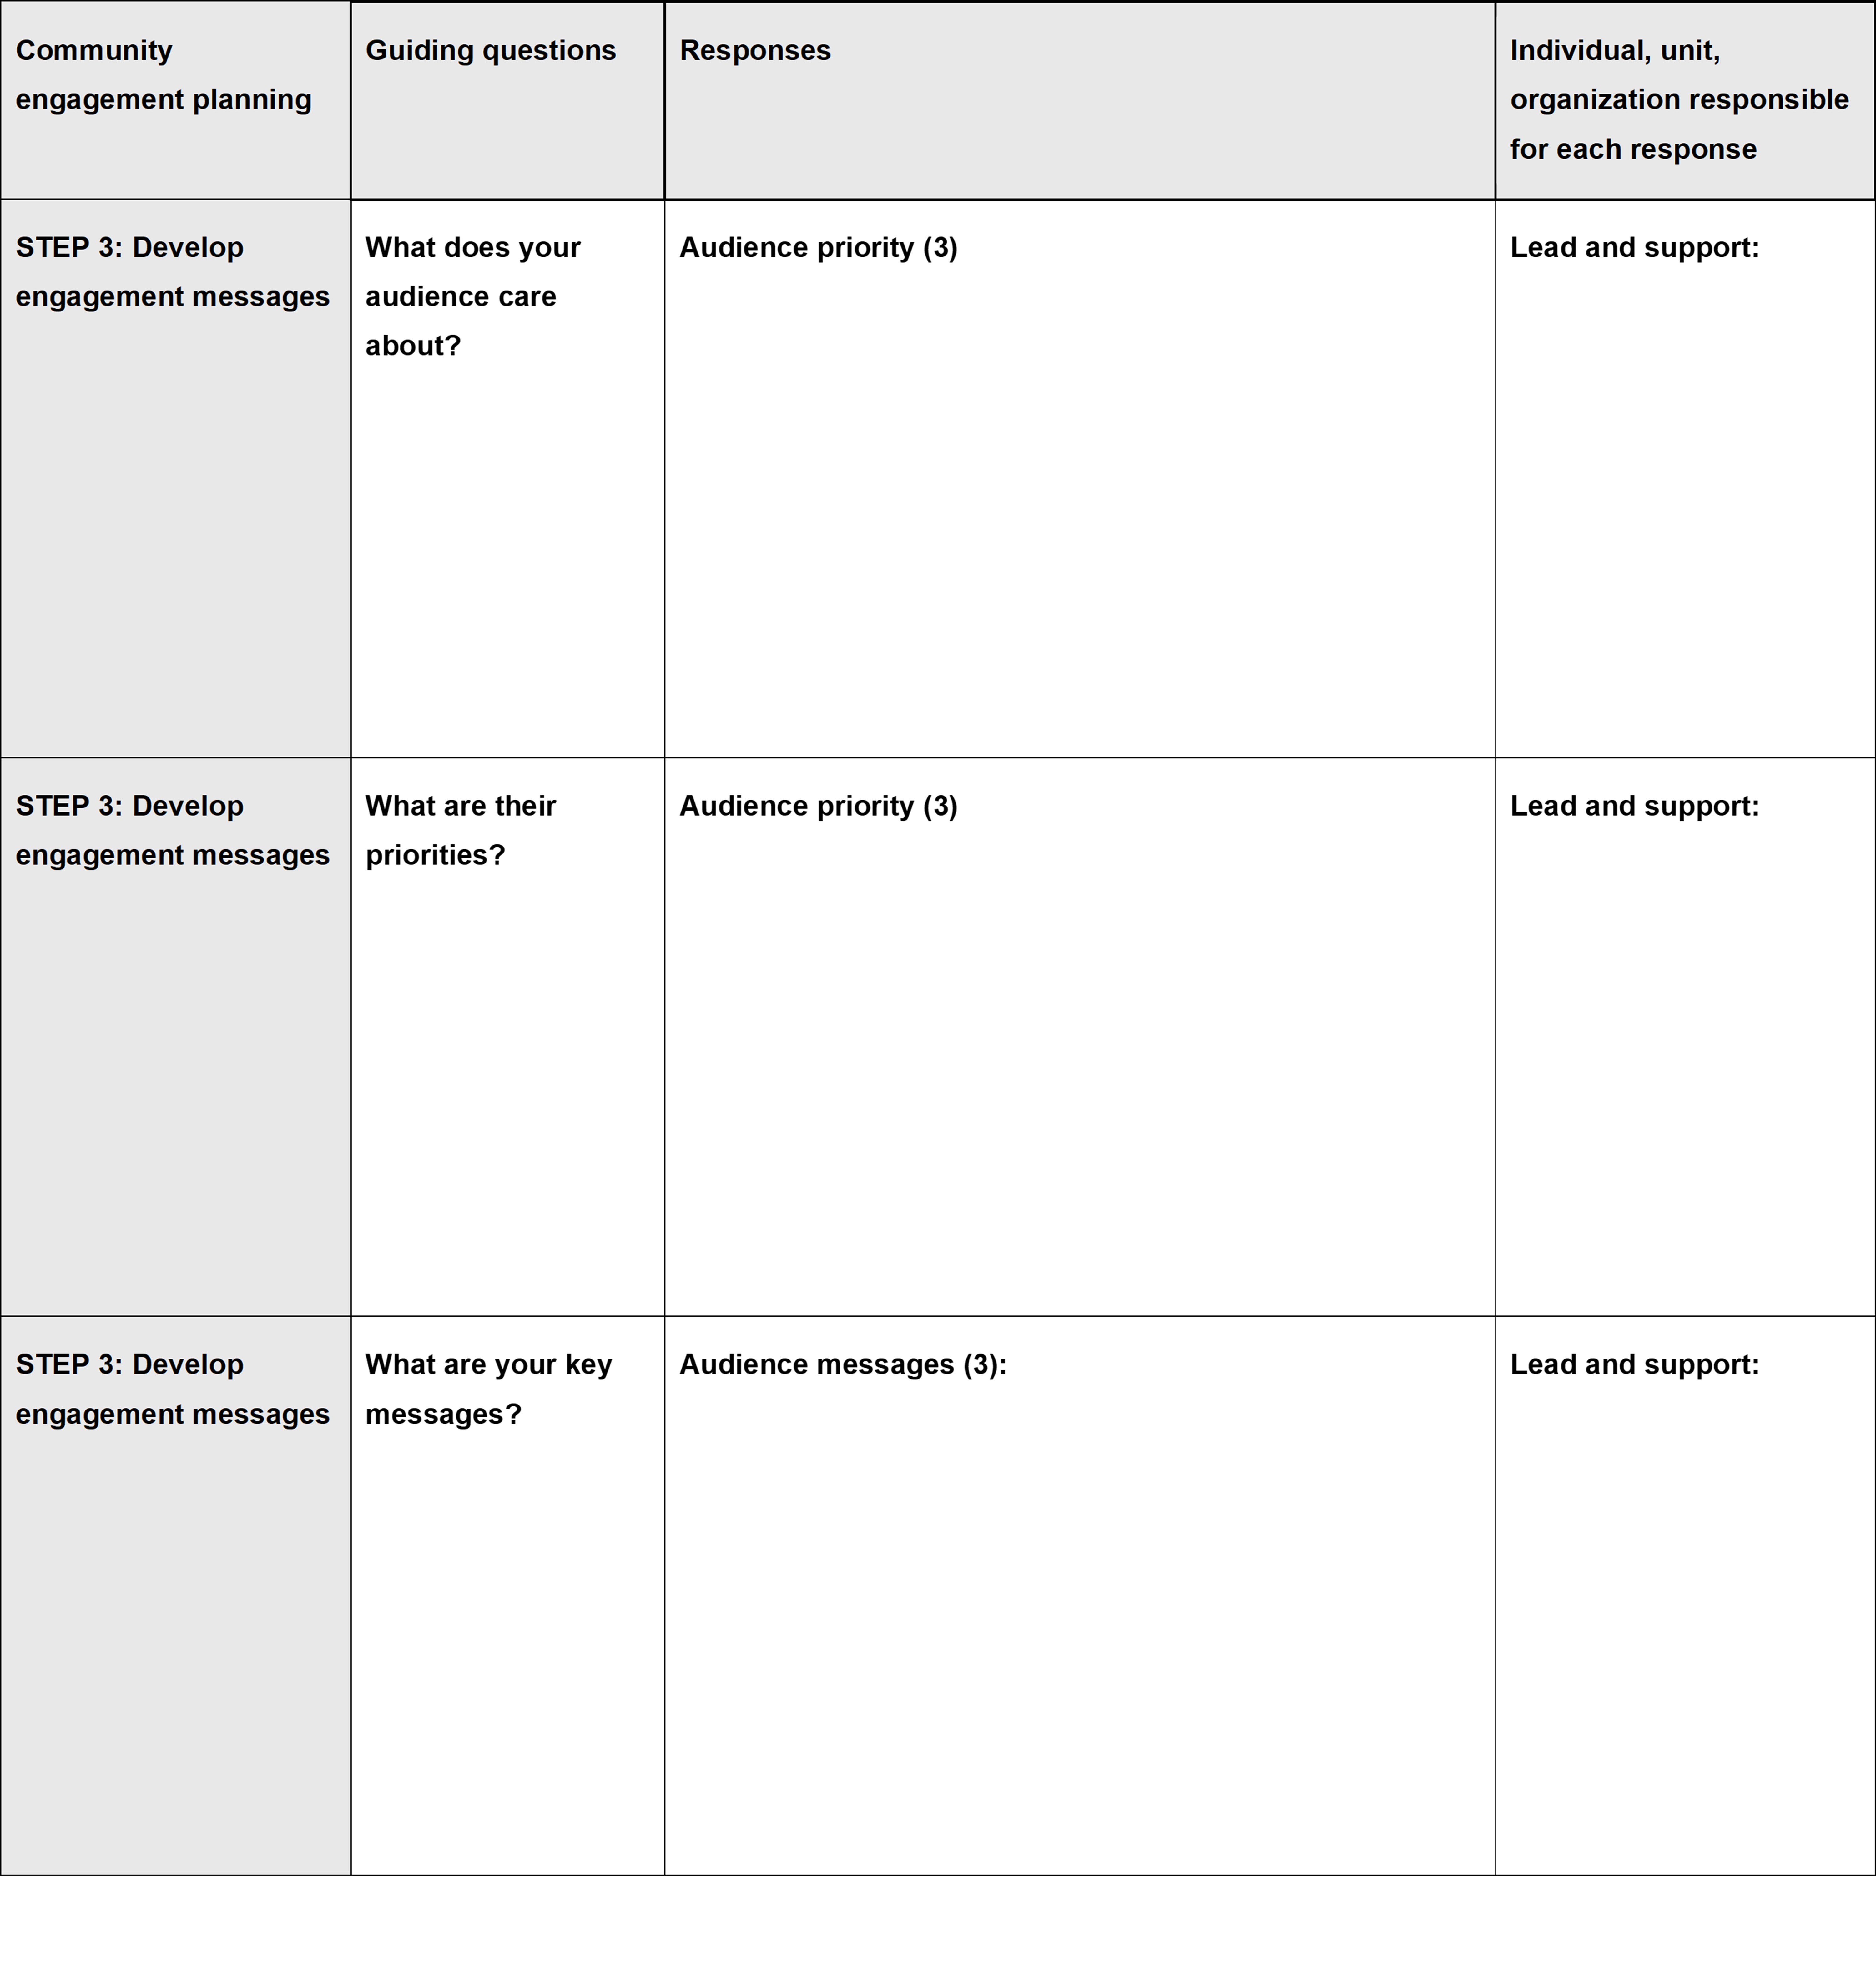
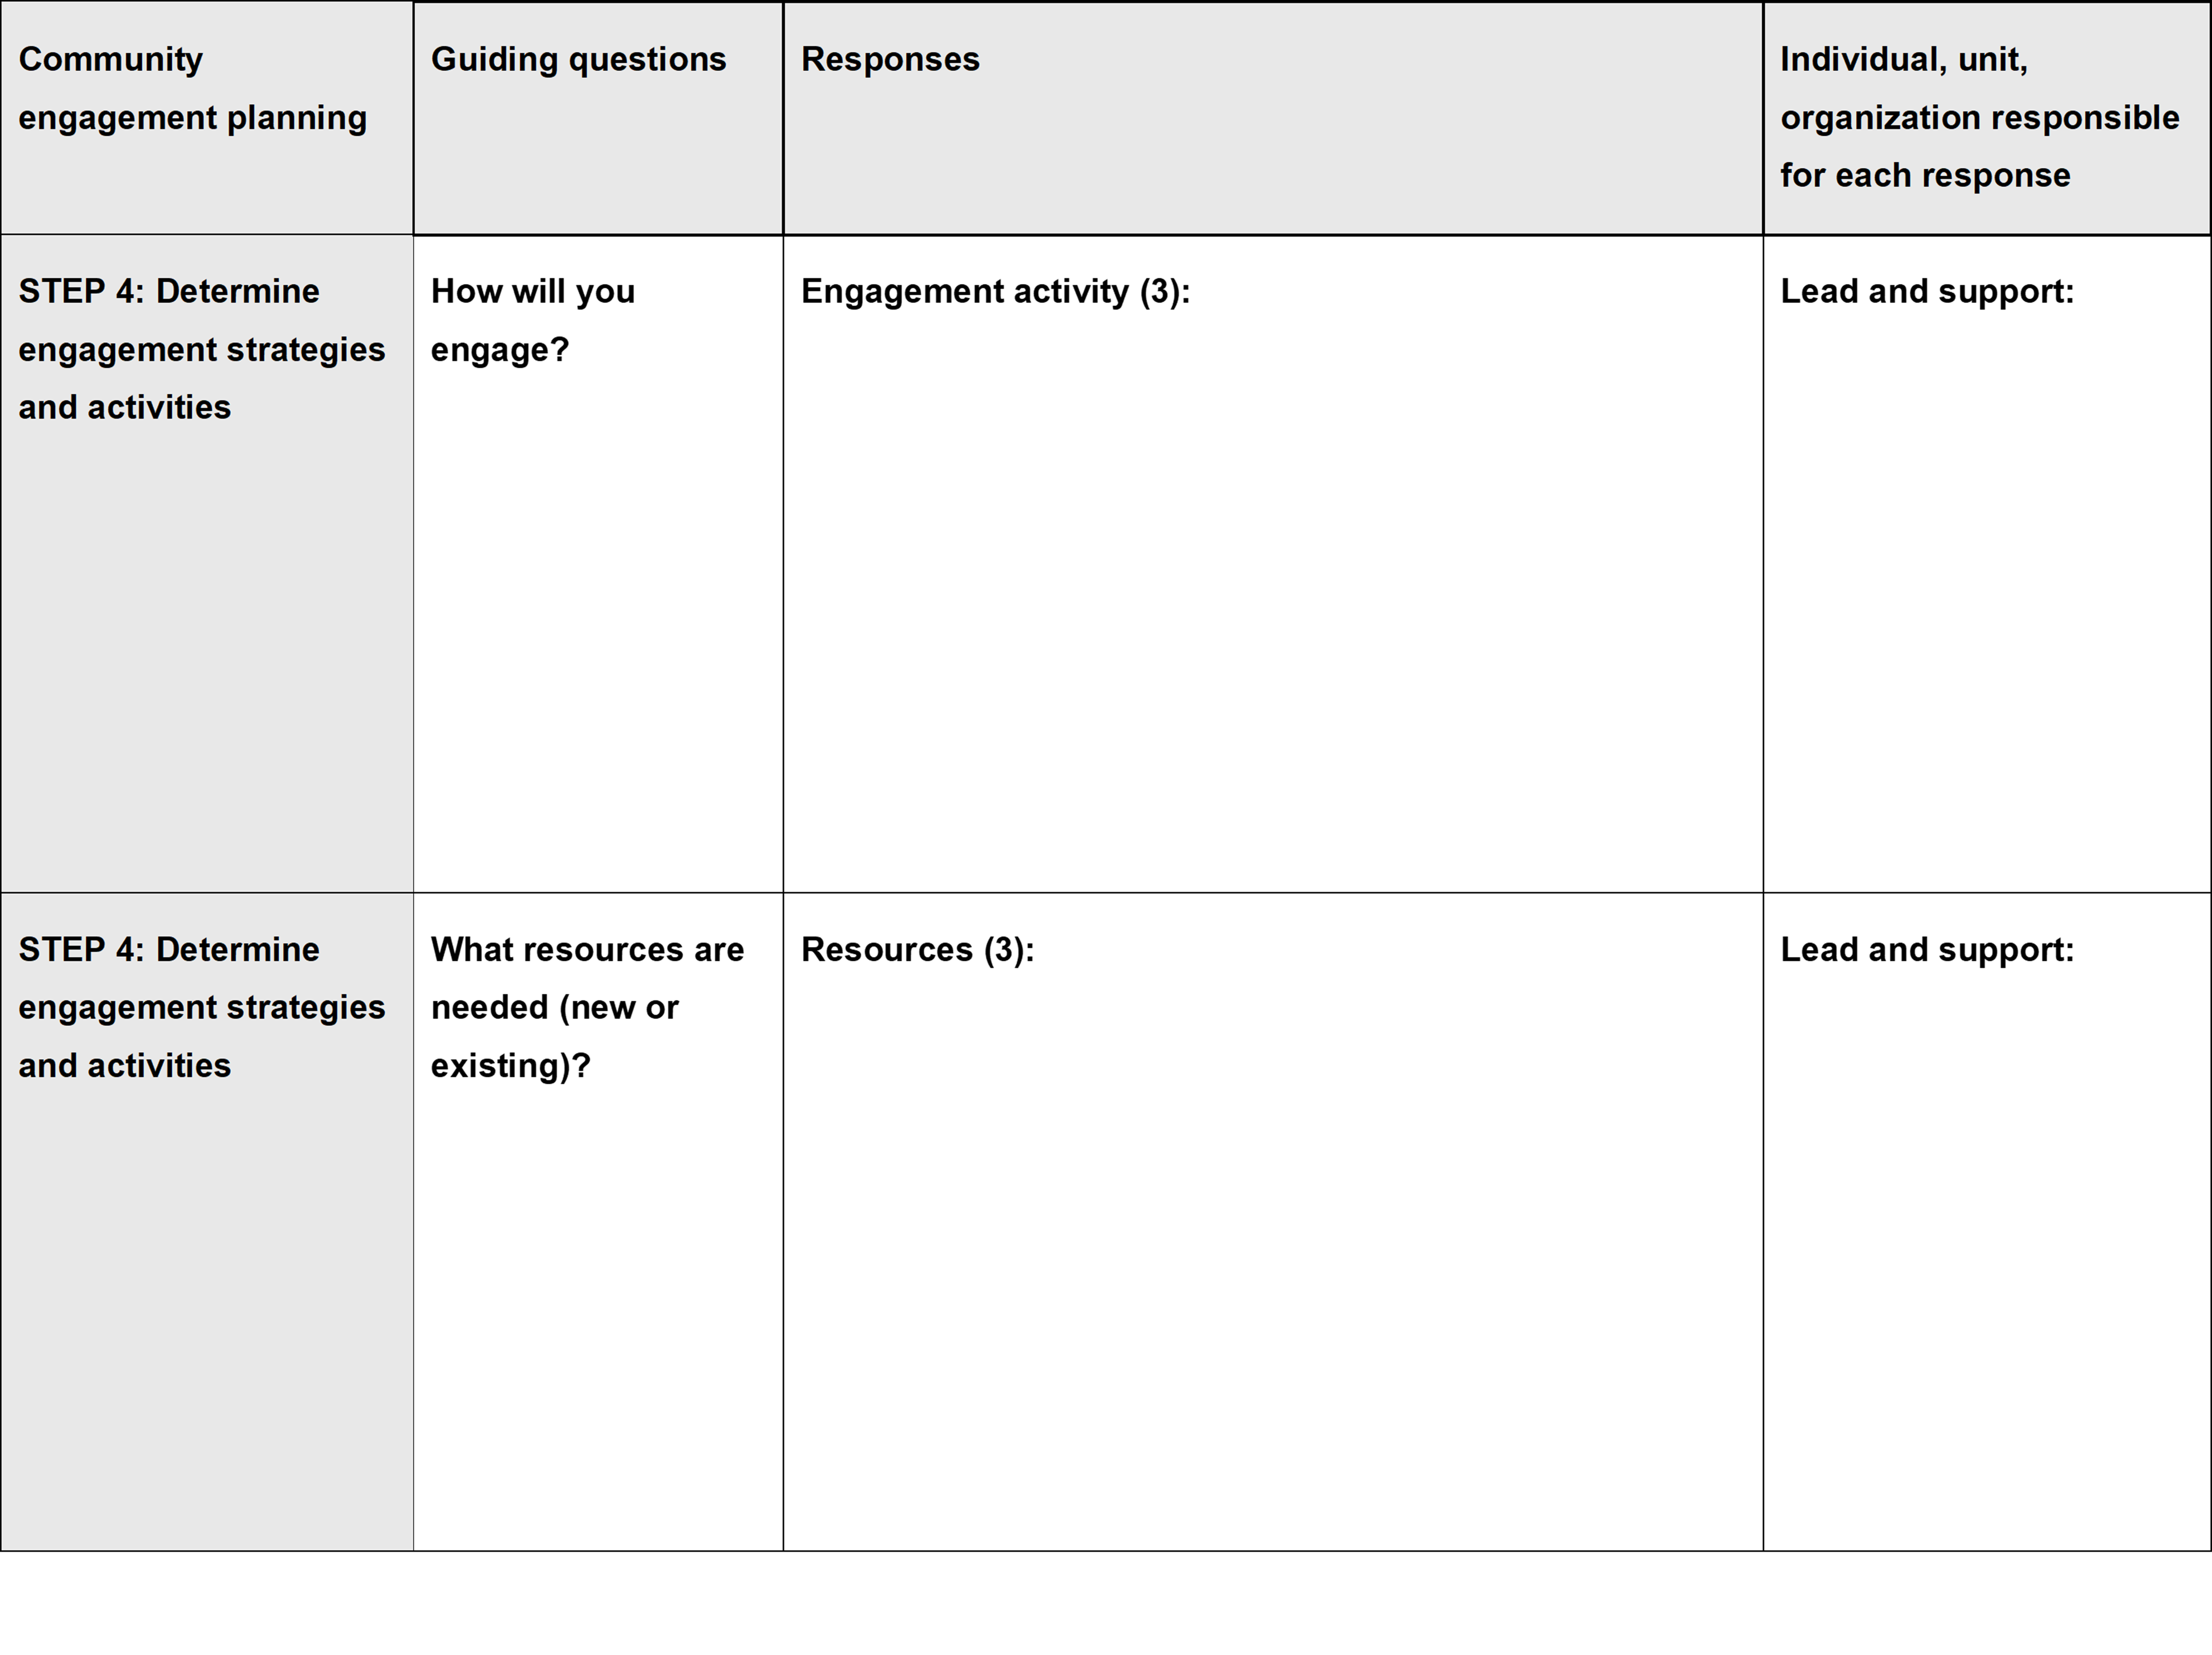
In Appendix A you will find an Engagement Planning Worksheet that offers a starting point for developing your engagement plan. The worksheet includes questions that you can ask yourself throughout each of the five steps. The following sections elaborate on these steps and considerations.
STEP 1: Establish the Goals and Objectives of Engagement
Before beginning to develop the engagement sessions, identify what part of the flood mapping process you are in:
- Priority setting helps identify high-risk areas that require updated maps.
- Data acquisition gathers meteorological, hydrological, historical, and elevation data to support modelling.
- Hazard assessment analyzes past precipitation and flow patterns to predict future flood scenarios.
- Modelling and mapping use hydrologic and hydraulic models to establish flood levels and spatially identify potential flood areas.
- Communication and dissemination seek to ensure that maps are accessible, and that information is disseminated so that communities can be engaged throughout the process.
- Risk assessment helps to identify high risk zones.
- Mitigation seeks to enforce zoning regulations, such as reducing the impervious surface ratio (ISR) of sites, restricting land use and development in flood hazard areas, and allocating resources toward flood mitigation strategies.
Goals
Establishing clear goals for community engagement throughout the flood mapping process is essential to ensuring that the resulting flood risk assessments are inclusive, transparent, and actionable.
A goal is the big picture result that your organization wants to achieve. Engagement goals should align with the needs and priorities of affected communities, ensuring that flood mapping efforts are not only scientifically rigorous but also socially relevant. Such goals respond to the question of Why? Ask yourself:
- Why do we want to engage the community?
The following provides an example of a goal at each level of engagement:
- A goal for informing community members may be to provide relevant and timely information, including avenues for recipients to reach out with questions or to seek clarification.
- A goal for consulting with communities could be to obtain feedback on concerns, priorities, analysis, and decisions.
- A goal for involving communities might be to establish a direct working relationship with community members to ensure that their needs and assets are integrated into maps, processes, and planning.
- A goal for collaborating with communities might be to seek out opportunities to work together with them at each step of the decision-making process.
- A goal for empowering might be to ensure that it is the community who is determining project priorities and exercising agency over decision-making.
Referring to the CES outlined in Table 3 can help you define your goals based on the level of engagement that is sought.
Objectives
In addition to establishing a clear goal, you will also need to establish clear objectives. Objectives are the specific steps or actions that will help you achieve your goal. They are measurable, clear, and have timelines. A goal can have several objectives.
For example, if the goal is to involve community members to ensure that their needs and assets are integrated into maps, processes, and planning, ask yourself:
- What specific actions will help make that happen?
Potential objectives include the following examples:
- Identify a point of contact for each subset of a population you want to engage.
- Reach at least 5% of the community members in specific neighbourhoods by the end of the project.
Once objectives are clearly defined, identifying engagement activities to accomplish each objective will be easier.
Collective learning outcomes or objectives, like enhancing risk awareness, building skills and capacity, motivating behavioural changes, and co-creating shared values can also be supported by engagement activities across the CES (Duffy, 2011).
STEP 2: Identify the Audiences for Engagement
Communities are diverse, shaped by distinct social, cultural, and economic factors that influence how they experience and respond to environmental risks like flooding. Their lived experiences—rooted in daily interactions with local landscapes, infrastructure, and climate variability—offer invaluable insights that standardized flood mapping approaches often overlook. Actively involving communities in mapping efforts ensures that these firsthand accounts inform data collection and decision-making, leading to more accurate assessments of flood patterns, vulnerabilities, and adaptive strategies.
To obtain the best response from the public, first ask yourself:
- Who will be engaged and for what purpose?
The answer cannot be everyone, and not everyone needs to be engaged throughout the entire process. You can determine key audiences by considering your understanding of the community’s values, dynamics, and pressing issues.
To help you identify who to engage, it can be useful to identify your various audience groups, which can be grouped in three different segments (Federal Emergency Management Agency, 2021):
- Critical: Those essential to achieving the goals and objectives previously defined. This will be the primary audience and will help you guide your focus and primary messaging.
- Important: Those who are not vital to achieving your goals and objectives but who can make the process run more efficiently and easily. This list will be longer than the critical one.
- Considered: Those interested in the process and who need to be kept aware, but do not necessarily possess high stakes in the process.
Table 5 provides an overview of audiences you may consider engaging. The table provides examples of different levels of government and other entities, highlighting of the types of input they can provide. The list is meant to illustrate the types of potential actors to be considered but it is not exhaustive and will need to be tailored to each case.
Table 5: Potential actors and the types of information they can provide.
| CATEGORY | ACTORS (EXAMPLES) | TYPES OF INPUT (EXAMPLES) |
|---|---|---|
| Local Governments | Elected officials, townships, cities, villages, regional municipalities, counties, regional districts |
|
| Provincial Governments, Ministries, and Agencies | Municipal Affairs and Housing, Immigration, Public Works, Public Health, Parks and Recreation (e.g., Ecosystems Lead), Water Stewardship Officers |
|
| Federal Government | Public Safety Canada, Indigenous Services Canada, Transport Canada, Environment and Climate Change Canada, Natural Resources Canada, Parks Canada |
|
| First Nations, Métis, and Inuit Governments | Elders, leaders, other Indigenous community members |
|
| Emergency Response Services |
Federal: Royal Canadian Mounted Police, Canadian Armed Forces, Navy, Coast Guard Provincial: emergency health services, ground search and rescue Regional: fire and emergency, regional police, emergency management officials |
|
| Non-governmental Organizations (NGOs), Researchers, and Other Specialists | Environmental NGOs, academics, research institutes |
|
| Agricultural and Social Service Organizations | agricultural organizations, friendship centres, family resource centres, immigrant services, YMCA |
|
| Public/Community Organizations and Local Knowledge Experts | Neighbourhood associations, long-term residents, historical societies |
|
| Industry and Business | Tourism representatives, Chamber of Commerce, insurance providers, Insurance Bureau of Canada |
|
| Utilities, Commissions, and Authorities | Telecommunications companies, energy utilities |
|
Source: Adapted from O’Toole, 2023.
Engaging Equity-Deserving Communities
Fully realising the benefits of engaging communities in flood mapping in a respectful and reciprocal manner requires an intentionally inclusive and reflexive approach. This largely means considering nuances like demographic shifts, disproportionately impacted groups, equity concerns within the community, and how these dynamics interface with the different stages of the flood mapping process (Partners for Action, 2024). Including members of equity-deserving and disproportionately impacted groups in the flood mapping process can help to ensure that all community members feel that their diverse experiences, values, concerns, and priorities are embedded within maps and reflective of their lived experiences (Sparling et al., 2024). Additionally, ensuring flood risk communication is accessible, transparent, and timely is key for empowering disproportionately impacted communities to make informed decisions (Partners for Action, 2024).
Engaging Indigenous Communities
Engaging Indigenous communities at the onset of a project is essential to ensuring that your project upholds inherent Indigenous Rights and Title, respects the nation’s sovereignty, and contributes to reconciliation and decolonization efforts. Engaging First Nations, Inuit, and Métis communities early and often allows for the early identification of potential impacts, allowing for project leaders to develop plans to accommodate and protect rights, reduce risks, and avoid project delays (NRCan, 2024).
Braiding flood mapping processes with cultural practices, perspectives, and Traditional Ecological Knowledge can also expand the possibilities of engagement, enrich the insights and efficacy of the mapping process, and cultivate trust between Indigenous community members and policy practitioners (St. Amour Gomes et al., 2018; NRCan, 2024; Huynh & Lueck, 2025). Taking a relational approach is fundamental to building trusted partnerships, sustaining collaboration, and ensuring that flood mapping efforts align with each community’s lived realities, worldviews, and priorities.
Additional Resources
Understand more about how to engage with disproportionately impacted groups through Partners for Action and Canadian Red Cross’s Inclusive Resilience reports:
- Pathways to Building Awareness and Preparedness Among At-Risk Populations in Canada (Wright et al., 2022).
- A Socio-economic Vulnerability Index to Map Flood Risks for Targeted Communications and Disaster Risk Reduction (Partners for Action, 2024).
Read more about the uneven tolls of flooding in marginalized communities in Partners for Action and Co-operator’s Disaster and Disparity: The uneven toll of floods and climate hazards in Canada (Watterodt, 2025) report.
To learn more about Traditional Knowledge and Indigenous-led climate initiatives grounded in Indigenous worldviews, visit: Indigenous Climate Action (n.d.), Indigenous Climate Hub (2025), Yellowhead Institute (n.d.), Centre for Indigenous Environmental Resources (n.d.), Climate Atlas of Canada (2024), Assembly of First Nations (2025), Inuit Tapiriit Kanatami (2026),and Métis National Council (2025).
To learn more about how climate change is impacting Indigenous communities, as well as the unique strengths that Indigenous Peoples are contributing to climate resilience throughout the country, refer to For Our Future: Indigenous Resilience Report (Reed et al., 2024).
For guidance on engaging Indigenous communities, please refer to the Indigenous Engagement Guidelines for Flood Mapping (NRCan, 2024).
For more information about First Nations’ data sovereignty, please visit the First Nations Information Governance Centre (2025).
STEP 3: Development Engagement Messages
Once the audiences have been identified, it is important to understand their concerns, motivations, values, worldviews, identities, and priorities, keeping in mind that these are continuously evolving and need to be constantly reassessed. You can ask yourself:
- What does the community or audience care about?
- What message do I need to convey?
As specialists working in flood mapping, you are probably already aware of the main characteristics of your audiences. This basis is a good starting point to start drafting your messages. However, if an audience is new or unfamiliar, you can use different tools, such as community conversations or surveys, to understand their interests, values, perceptions, and barriers. Alternatively, you can reach out to organizations and community champions who can guide you in the process. These methods can be particularly helpful if you are working with equity-denied, underrepresented, and underprivileged communities.
Many communication approaches recognize that messaging needs to be tailored to specific audiences so that you can meet people where they are and so that each message appeals to their interests, values, and lived experiences (ICLEI Canada, 2025). Similarly, identifying both where the project is situated within the engagement spectrum (see Figure 3) and the goals and objectives of your engagement (see Table 4) can help you focus and further refine your messages.
Examples of the underlying messages to audiences across the engagement spectrum:
- Inform: “We will keep you informed.”
- Consult: “Your concerns are reflected, and public input is considered.”
- Involve: “Your input helps develop alternatives.”
- Collaborate: “You provide advice and innovation to formulate solutions.”
- Empower: “We will implement what you decide.”
When developing messages, aim for language and meaning that resonates with your target audiences and motivates them to take whatever action you are aiming for. In doing so, you may draft several communications using different wording and framing in order to match each audience’s specific needs, unique worldviews, knowledge systems, experiences, and level of familiarity with the topic. Knowing what your audiences care about, and how your engagement goals align with the community’s values, can help you narrow down the tone, word choice, and framing of your messages. Similarly, you can frame your messages by drawing connections with local issues, current events and priorities.
Word communications using plain language—concise, clear language without acronyms, industry jargon, or technical terms (e.g., engineering terms) (Federal Emergency Management Agency, 2021). Storytelling can be a powerful tool for translating abstract concepts and data into relatable narratives.
Finally, when aiming to share and spread messages, it is important to ensure that the messenger is trusted, credible and relevant. Trusted community organizations, allies, and community champions are reliable messengers that can influence how a message is received (ICLEI Canada, 2025).
Calls to Action
Establishing clear calls to action in the main message can encourage audiences to take necessary action. When developing a call to action, consider what you would you like your audience to do next.
Examples of calls to action (ICLEI Canada, 2025):
- Learn more
- Learn how
- Visit our website
- Watch now
- See our work
- Read our FAQs
- Meet our partners
- Share your story
- Try now
- Get started
- Share your feedback
- Help us spread the word
- Register
- Volunteer
- Leave a review
- Read reviews
- Contact us
- Follow us
- Join our newsletter or email list
- Stay informed
- Download
- Apply
Additional Resources
ICLEI Canada’s Climate Communications Playbook (2025) offers actionable strategies for creating communication campaigns, including examples of framing and templates for messaging.
The Federal Emergency Management Agency’s Flood Risk and Communication Toolkit for Community Officials (2021) is another useful resource with transferable strategies for the Canadian context.
STEP 4: Determine Engagement Strategies and Activities
Now that messages have been crafted, it is necessary to plan which communication channels and mediums to use, as well as the engagement activities to achieve the goals and objectives identified at the beginning of the planning journey. Ask yourself:
- How will I engage with my audiences?
Every engagement session or initiative will look different. Regardless of these differences, it is important to provide audience members with a variety of options to best support their ability to fully participate in the engagement in an inclusive and barrier-free way. The goal of the engagement, in tandem with understanding the group being engaged, will help inform the engagement activities. Keep in mind that engagement methods will need to be tailored to each community’s or audience’s unique needs, and the use of interactive tools can increase interest and participation in the flood mapping process (St. Amour Gomes et al., 2018).
The availability of capacity and resources will also play a role in determining the best approaches for your audiences. For example, if resources are limited, it might be better to focus on a single engagement activity with the potential for a bigger impact. If multiple activities are conducted, consider activities that complement each other (Federal Emergency Management Agency, 2021).
Engagement activities can be online, in-person, or a combination of both, and can include a range of digital, print and audio-visual communications. Table 6 provides examples of engagement activities based on your engagement goals and available resources. Consider what is feasible based on the overall allocation of resources by engagement type.
It is useful to note that communication methods used to inform communities can be used concurrently with all other levels of engagement.
In-Person Events
Conducting public outreach and spreading awareness of upcoming events is key, especially for in-person events. When communicating upcoming events to the public, include a variety of methods to maximize reach and minimize barriers.
Examples of activities to invite or notify public audiences of in-person events:
- mailing printed newsletters to residents
- promoting the event via local news channels (e.g., newspaper, radio, television)
- posting information on community boards in public spaces (e.g., community centres, public libraries)
- partnering with trusted community organizations to help spread the word among their networks
- sharing the event details on municipal websites and social media platforms.
Be sure to consider the accessibility of in-person events and what you can provide to make them more accessible to more people. Examples include providing resources in multiple languages, accounting for audio or visual impairments, facilitating childcare, or providing transportation to be able to attend the event. Depending on the capacity of your team and the extent of the project, compensation could also be offered to attendees, such as refreshments and honoraria.
Table 6: Selecting engagement activities by goal and feasibility across the Community Engagement Spectrum.
| INFORM | CONSULT | INVOLVE | COLLABORATE | EMPOWER | |
|---|---|---|---|---|---|
| Message to Community | We will keep you informed | Your concerns are reflected, and public input is considered | Your input helps address community needs and priorities and develop alternatives | You iteratively co-develop solutions | We will implement what you decide |
| Community Engagement Goals | Provide relevant and timely information, including ways community members can reach out with questions | Obtain feedback on concerns, priorities, analysis, and decisions | Work directly with people to ensure community needs and assets are integrated into maps, processes, and planning | Work together with community at each step of the decision-making process | Ensure that community drives priorities and controls decision-making |
| Engagement Activities |
Online: Social media (e.g., posts), project website, direct emails (e.g., listserv), newsletters, media releases In-person/Online: Information booths, public meetings, open houses, townhalls (e.g., presentations) Audio-visual: Radio, television ads Visual/Print: Newspaper (e.g., ads, articles), direct mail (e.g., letter), handouts (e.g., postcards, pamphlets, fact sheets), community bulletins, displays (e.g., poster, banner), billboards |
Online: Social media (e.g., posts), project website, surveys, comment forums In-person/Online: Public meetings, townhalls (e.g., presentations), information booths, focus groups, polls, interviews, community forums Audio-visual: Phone (e.g., calls, surveys) |
Online: Social media (e.g., posts, photos, videos, communities of practice), storytelling, story maps In-person/Online: Focus groups, workshops, polls, community forums, house meetings, interactive galleries/stations |
Online: Social media (e.g., communities of practice) In-person/Online: Workshops, community planning, participatory budgeting, open planning forums, citizen advisory committees, working sessions, participatory community mapping |
Online: social media (as required) In-person/Online: Workshops, community planning, participatory budgeting, open planning forums, deliberative polls, participatory action research, citizen science, citizen advisory committees, working sessions |
|
Feasibility (Resource Allocation) Typical distribution of project time/resources |
70-90% Systems admin 10-30% Promotions and publicity |
60-80% Systems admin 20-40% Consultation activities |
50-60% Systems admin 40-50% Community involvement |
30-50% Systems admin 50-70% Community partnerships |
80-100% Community partners and community-driven processes ideally generate new value and resources that can be invested in solutions |
Sources: Adapted from SPARC BC, 2013; IAP2, 2024; Gonzalez, 2019; Fang et al., 2022; Belotti et al., 2022.
Community Engagement Toolkits
The following additional resources and examples will help you develop interactive, creative, equitable, and inclusive engagement activities:
- Virtual Community Engagement on Climate Change Adaptation (Belotti et al., 2022) provides case study examples of the following virtual engagement methods: storytelling, participatory community-based mapping, serious games/roleplay scenarios, community-based social marketing, kitchen table talks, photovoice, and landscape visualizations. This guide was used to inform climate change awareness and flood preparedness workshops in the City of Dawson Creek.
- SPARC BC’s Community Engagement Toolkit (2013) designed to help municipal planners design their communications and engagement processes, provides detailed information on various types of outreach activities.
- Halifax Regional Municipality’s Public Engagement Guidebook, Planning and Development (2022) is intended to provide local government staff with resources and key considerations for designing and delivering accessible public engagement processes.
- Shift Collaborative’s Practice Guide for Advancing Climate Equity in Coastal Adaptation Planning (2024) outlines best practices for centring climate equity in community engagement and adaptation planning, highlighting Canadian success stories.
- Tamarack Institute’s 10: A Guide for Advancing Climate Equity Through Place-Based Collaboration (2024) provides guidance on engaging in equity-informed local climate action.
- The Morris J. Wosk Centre for Dialogue’s Public Engagement Toolkit (2019) includes strategic considerations for designing inclusive public engagements with examples and planning worksheets.
- Vivo’s Place Matters: Community Engagement Toolkit (2025a) includes lessons learned from Place Matters: A North Calgary Project (2025b), which sought to build a sense of belonging within the community. It includes practical guidance on the resources needed to plan and implement public outreach activities and how public spaces were utilized.
STEP 5: Follow Up, Share, and Stay in Touch
After completing engagement activities or completing the flood mapping, it is good practice—and helpful to your project—to update the public and engagement participants and maintain these relationships. Participants will want to know:
- What were the results?
- What happens next?
Appoint one or two team members to be responsible for relationship management and follow-up. When an engagement initiative has taken place, get in touch to thank attendees for their time and to share contact details to support a two-way flow of communication. This can be done through a simple thank-you email and could include a quick summary of the information provided at the session as well as the ways in which participants can stay in touch and receive updates on the project. Additionally, following up with comments, concerns, or inquiries from community members is best done promptly. If a commitment is made, follow through in a timely, transparent manner.
When you have reached the stage in the project where you have enough information or data to share it more broadly with the community, consider how these results could best be publicly communicated. Again, ensure that this process is done with accessibility and inclusion principles in mind. Using multimedia methods and presenting data in different forms can help to combat a variety of accessibility concerns. It is important to remember that people learn and interpret new information in a variety of ways, meaning that you may wish to consider incorporating different learning styles (e.g., tactile, auditory, visual) and needs (e.g., visual aids, interactive communications). Translations and links to further information may also be helpful. If you are hoping to receive feedback on preliminary maps or plans, work through the engagement stages again to ensure the best result.
As you near project completion and before making all information publicly available, consider what information is sensitive and how to share it with clear messaging (e.g., data that may affect property values and insurance rates). If the benefits of risk awareness outweigh the costs of making the risk information and maps publicly available, be equipped to answer any potential concerns. Additional public communications may be needed to convey these messages.
Finally, when a project is completed, the relationship with the community can continue, especially in situations where the project has lasting effects beyond its lifespan. Relationships are an ongoing investment in trust-building and community capacity-building, rather than transactional and finite within the lifespan of the project. If applicable, it may be helpful to share a timeline for project updates, evaluation benchmarks, and upcoming projects to promote lasting engagement. Maintaining relationships can also create opportunities for potential initiatives in the future. Sustaining connections with different communities can help ensure that flood mitigation plans are periodically revisited, making it easier to engage in future activities as environmental conditions, community dynamics, and preferences change over time.
Evaluate the Engagement Plan
Consider whether the engagement plan’s goals and objectives are being met—is it living up to expectations? The engagement plan can identify ways to measure and assess the engagement work at set intervals (e.g., midway, end of the engagement). This may include both formal and informal methods for evaluating engagement, such as brief surveys, discussions with residents while canvassing neighborhoods, assessing web page analytics (including metrics such as total site visits and time spent on the site) and engagement on a social media channel.
Part 4: get inspired
Build confidence in the tools from case study examplesS
7.0 Case Studies: How Engagement Tools Have Been Used in Flood Mapping and Other Initiatives
Through select case studies, this section provides examples of how different community engagement activities have been used in flood mapping and to build community resilience. These case studies were chosen to highlight engagement strategies and activities for mapping at provincial/territorial and local/regional levels for different regions across Canada, with different purposes and audiences. There are many more examples that could be showcased. These are a select few to provide ideas and inspiration on the range of community engagement activities could be planned.
- Lower Fraser and Coquihalla Rivers Floodplain Mapping, Lower Fraser and Coquihalla, BC
- Southern Lakes Flood Hazard Mapping Study, Southern Lakes, YK
- Tuktoyaktuk Community Climate Resilience Project, Tuktoyaktuk, NT
- False Creek Coastal Adaptation Plan and Sea2City Design Challenge, Vancouver, BC
- Sackville and Little Sackville Rivers Floodplain Mapping, Halifax Regional Municipality, NS
- EPCOR’s Stormwater Integrated Resource Plan, Edmonton, AB
- Flood Resilience Challenge, Various use cases.
7.1 Case Study: Lower Fraser and Coquihalla Rivers Floodplain Mapping
Community Involvement and Local Knowledge Adds Value for Future Planning
The region that includes the Lower Fraser River and Coquihalla River is one of six regions participating in a flood hazard mapping initiative that began in 2022, managed by the Fraser Basin Council. Funded by the Province of British Columbia and the Government of Canada through the Flood Hazard Identification and Mapping Program (FHIMP), communities along the rivers (Figure 6, Figure 7) were invited to participate due to their high flood risk and lack of up-to-date flood hazard maps. The aim of the initiative was to generate high-quality flood hazard maps that reflect current and potential future conditions and would support First Nations and local governments in their regulatory and decision-making processes (Fraser Basin Council, 2026). See Table 7 for case study characteristics.
Table 7: Case Study Characteristics of Lower Fraser and Coquihalla Rivers Floodplain Mapping
| LOWER FRASER AND COQUIHALLA RIVERS FLOODPLAIN MAPPING | |
|---|---|
| Scale |
|
| Flood Hazard |
|
| Levels of Community Engagement |
|
| Flood Mapping Components |
|
| Actors |
|
| People Engaged |
|
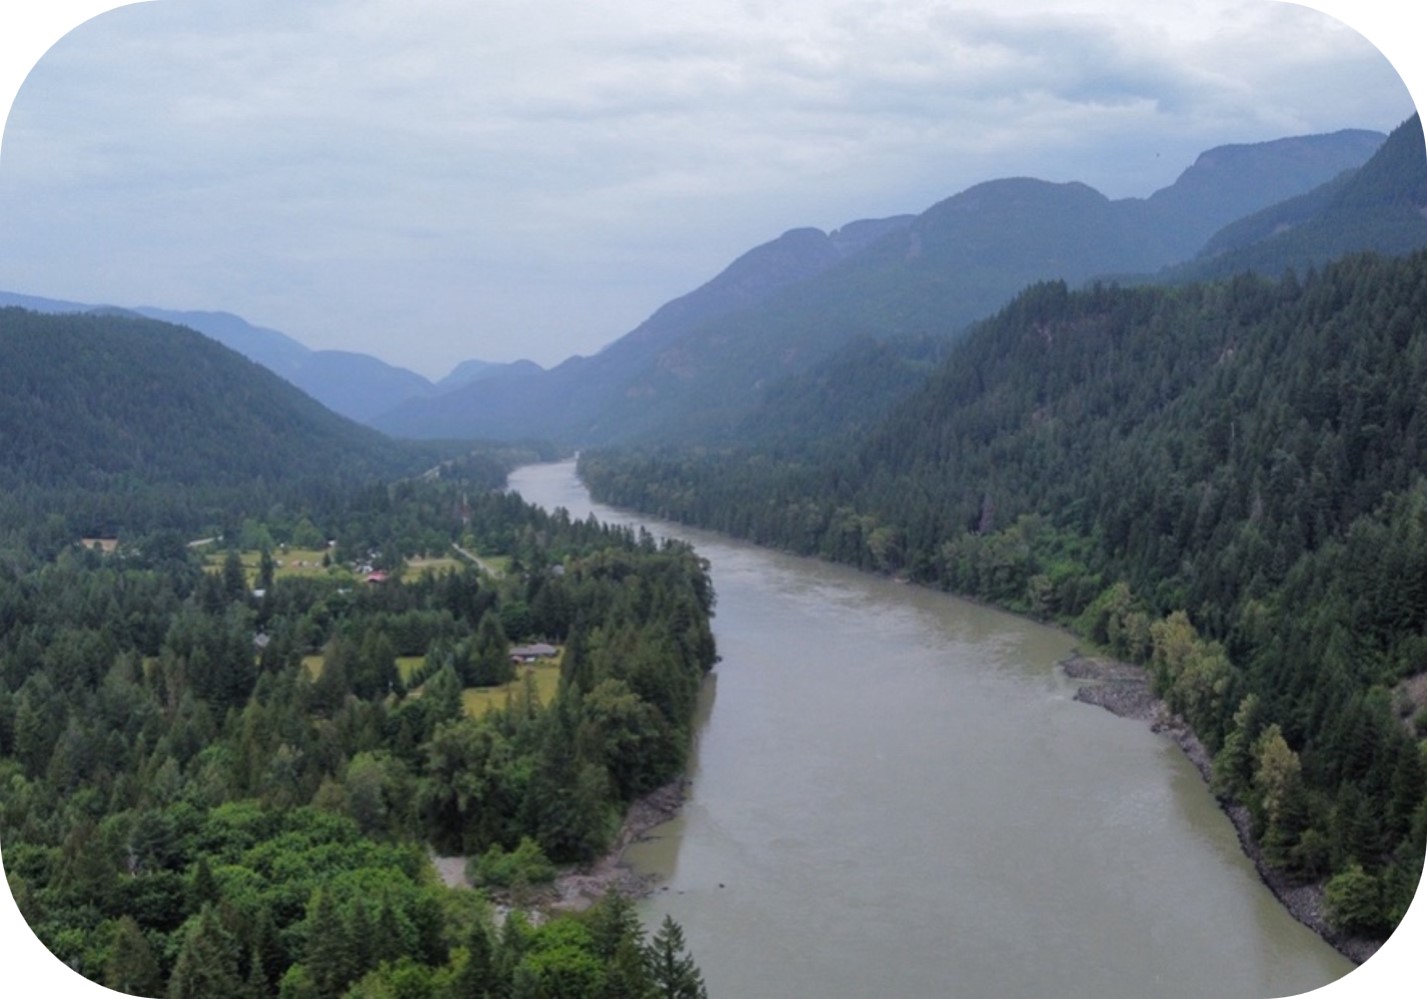
Figure 6: Fraser River at Yale First Nation (Stullawheets 8), looking north (NHC, 2023).
Text version
An aerial view of the Fraser River at Yale First Nation looking north into the distance through a mountainous, forested landscape. The river appears grey-green and is bordered by dense evergreen trees on both sides. Steep, dark green hills and mountains rise along the river valley, with multiple ridgelines fading into the background under a cloudy sky.
On the left side of the river, small clusters of buildings and open grassy areas are visible, suggesting rural development or farmland set back from the riverbank. The right side of the river appears more densely forested, with fewer signs of structures.
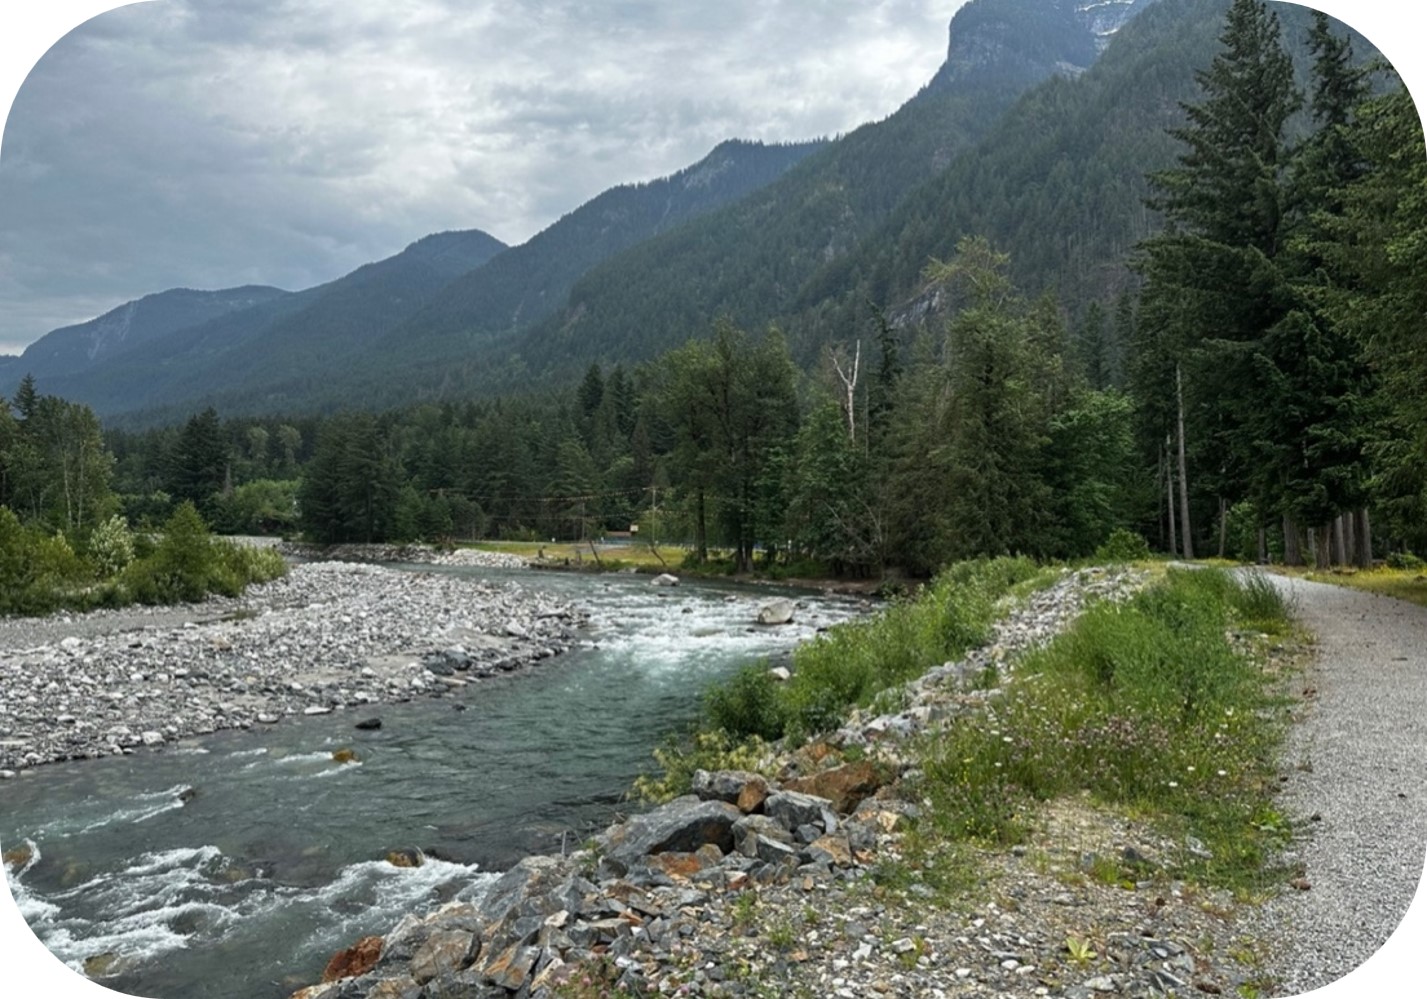
Figure 7: Coquihalla River, looking upstream at Hospital Bend (NHC, 2023).
Text version
A view of the Coquihalla River from ground level, looking upstream with a forested mountain valley in the distance. The river is shallow and fast moving as it flows from the background toward the foreground, with visible ripples and small whitewater areas around exposed rocks. The riverbed is wide and covered with light-grey stones and gravel, especially along the left bank.
On the right side of the image, a gravel walking path runs parallel to the river, separated from the water by low vegetation, shrubs, and rocks placed along the bank. Dense evergreen trees line both sides of the river, extending into the middle distance.
In the background, steep, forested mountains rise on both sides of the valley, with layered ridgelines partly fading into the distance. The sky is cloudy.
Engagement
Updated flood hazard maps were developed by Northwest Hydraulic Consultants (NHC) with input from participating communities. Community engagement was planned and implemented by the NHC project team. The engagement activities were divided into two phases. Phase one, which began in 2023, included building relationships, developing project documents and protocols, and consultingFootnote 2 with participating communities to gather data.
Lower Fraser and Coquihalla Rivers Floodplain Mapping Engagement Plan, Phase One
Engagement plan activities for phase one included:
- Refining the project contact list
- Community outreach via phone, letter mail, or email
- Preparing internal background documents
- Creating project documents for First Nations and local governments
- Scheduling virtual start-up meetings
- Facilitating start-up meetings
- Preparing and distributing meeting notes
- Sending follow-up emails regarding data requests, community information and other action items as identified during the start-up meeting
- Developing an Information Stewardship Protocol for the gathering and care of local knowledge and Indigenous Knowledge
- Facilitating access to participation funding for First Nations
- Scheduling, preparing, and follow-up for site visits to meet community leaders and review community infrastructure
- Requesting, gathering, and tracking interim expressions of interest and opt-in letters
- Sharing information with a local partner organization
- Compiling metrics and responding to information requests from project leads
Virtual start-up meetings and site visits were key engagement activities in phase one. Start-up meetings provided an opportunity for the project team to share information about the project (e.g., goals, methods, timelines, outputs), request existing data (e.g., previous site survey data, relevant prior studies), ask questions, and confirm best methods for ongoing communication. During the start-up meeting, the project team led communities through a virtual walkthrough of the area on Google Earth to gather information on community infrastructure, past studies, the role of tributaries, erosion and sedimentation history, human alterations to watercourses, and areas of interest or concern. Site visits were carried out as requested by participating communities to clarify conditions to support hydraulic modelling. The site visits provided an opportunity for in-person relationship development with community leaders and to ground-truth community infrastructure.
Phase two of the engagement, that began in 2024 and continued into 2025, focused on maintaining communication and sharing and receiving feedback on draft maps. Communication was maintained via a short quarterly newsletter to provide communities with project updates. Virtual meetings allowed the project team to communicate methods, assumptions, and findings, as well as involve communities in finalizing the maps and reports. Answers and clarifications were provided to communities through emails or additional virtual meetings.
The key engagement activity for phase two included hosting community meetings to present the mapping products, describe the methods, assumptions, and findings, answer questions, and gather input. Communities were asked to review the maps and provide feedback (e.g., identify any mistakes or inaccuracies in map labels, or flood extents that differ from past floods extents).
Lower Fraser and Coquihalla Rivers Floodplain Mapping Engagement Plan, Phase Two
Engagement plan activities for phase two included:
- Maintaining communication via a short quarterly newsletter that provided updates on project work, invited feedback, and maintained connection
- Scheduling, facilitating, and reporting on virtual meetings with communities
- Sharing draft maps and communicating study methods, assumptions, and findings
- Sharing information about the process and next steps
- Gathering feedback and input on the maps and report before finalizing deliverables
- Answering communities’ questions and providing clarification through email or additional virtual meetings
- Supporting Fraser Basin Council in the administration of participation funding for First Nations
Outcome
Communities provided technical information, made requests for terminology changes to better reflect local history and to place people at the centre of key terms, confirmed clarity of information being communicated by the maps, and shared interest in receiving final maps in digital format along with supporting plain-language documents for sharing with the larger community. Input and feedback received from participating communities will help to ensure maps provide communities with clear and relevant information needed to implement next steps, such as emergency planning, flood mitigation, or other community work.
NHC reported (NHC, 2023, 2025) that throughout the project they heard great appreciation for the work and trust in the products being delivered. Local governments and First Nations generously provided their time, prior reports, and community knowledge to help develop the maps. At the end of phase one, NHC reflected that the Information Stewardship Protocol was essential as local knowledge about past flooding and flood vulnerability is Indigenous Knowledge. As discussions with First Nations continued, the decision was made to provide editable digital deliverables, as well as pdfs, which meant that community-owned information (i.e., cultural heritage sites, burial sites) would not be added by NHC but could be added by communities to the final digital maps.
This ability to shape the final digital products to reflect communities’ needs and regional priorities supported data sovereignty and the stewardship of Indigenous Knowledge. Participating communities maintained ongoing involvement over the three-year duration of the project, providing their time, information, and resources. Participation funding was important to reflect the value of participants’ time and acknowledge their ongoing commitment.
Additional Resources
Learn more about how the Fraser Basin Council is coordinating the BC Floodplain Mapping (Fraser Basin Council, 2026) initiative and how better flood preparation will help protect BC communities (Government of BC, 2023).
7.2 Case Study: Southern Lakes Flood Hazard Mapping Study
Online and In-Person Engagement Provides Validation for New Flood Hazards Maps and Space for Community Discussion on Flood Risk Reduction
The Government of Yukon’s Water Resources Branch (WRB) commissioned flood hazard maps for the Southern Lakes region, which includes communities and First Nations Settlement Land located around Lake Laberge, Marsh Lake, Nares/Bennett Lake, and Tagish Lake. In 2024, the WRB worked with a local consultancy to engage the public through an online map viewer with comment board, an online survey, and a series of in-person open houses, while also meeting with staff representatives from local First Nations. The aim of engagement was to validate the modelled flood extents and to incorporate feedback into the final iteration of the flood hazard map (Figure 8). See Table 8 for case study characteristics.
Table 8: Case Study Characteristics of Southern Lakes Flood Hazard Mapping Study
| SOUTHERN LAKES FLOOD HAZARD MAPPING STUDY | |
|---|---|
| Scale |
|
| Flood Hazard |
|
| Levels of Community Engagement |
|
| Flood Mapping Components |
|
| Actors |
|
| People Engaged |
|
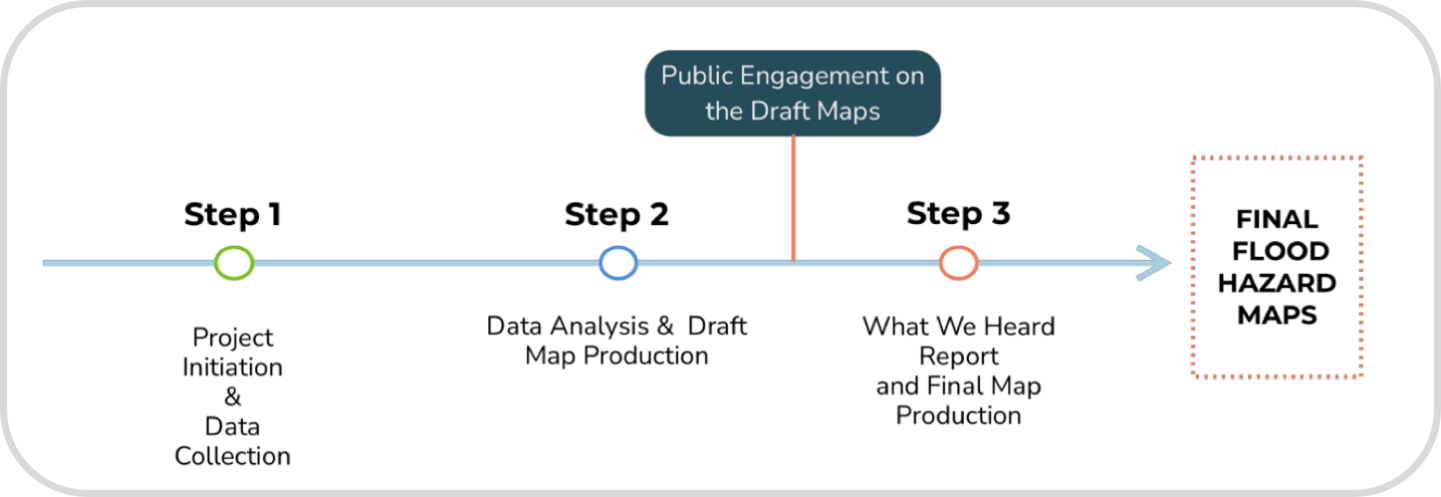
Figure 8: The Southern Lakes Flood Hazard Mapping Study process (Government of Yukon, 2024a).
Text version
A horizontal process diagram showing the steps involved in producing final flood hazard maps. A single horizontal blue arrow runs from left to right.
On the left, Step 1 is labelled “Project Initiation & Data Collection.” It is marked by a small green circle positioned on the horizontal line.
Moving right, Step 2 is labelled “Data Analysis & Draft Map Production.” This step is indicated by a blue circle on the same line.
Between Step 2 and Step 3, a round-cornered rectangular box above the line reads “Public Engagement on the Draft Maps.” A vertical orange line connects this label down to the timeline.
Next, Step 3 is labelled “What We Heard Report and Final Map Production.” This step is marked by an orange circle on the line.
At the far right, the arrow points to an orange dashed rectangular box labelled “FINAL FLOOD HAZARD MAPS.”
Engagement
The territorial government obtained public feedback through consultation, allowing residents to provide input on the draft flood hazard maps produced by the KGS Group engineering firm. These maps were uploaded to the Government of Yukon’s Flood Hub, a publicly accessible portal that houses all flood hazard maps for the territory. Using an online map viewer tool, community members were able to navigate the draft maps, submit comments on a comment board, and download the maps. Feedback was also elicited through an online survey. Residents were notified of the engagement opportunity through a news release posted on the government website and advertisements on social media. This communication informed the public about the project, directed people to the Flood Hub, and provided information about four open houses that were held throughout the region.
Open houses were held at the Haa Shagóon Hídi in Carcross, the Marsh Lake Community Centre in Marsh Lake, the Hootalinqua Fire Hall in Lake Laberge, and the Tagish Community Centre in Tagish. A range of products were used to communicate concepts and information to community members, including illustrations and maps (Figure 9). Community members were invited to share their local knowledge and lived experiences, offering feedback on how accurately the flood levels and extents modelled in the draft maps had reflected their observations from past flood events, including the 2021 (Figure 10) and 2022 floods. Participants provided input on the clarity and readability of the maps, highlighting the importance of clear visuals within risk communications. The open houses also served as an opportunity for community members to raise questions, share observations and experiences, and voice their needs and concerns on related topics, such as flood mitigation strategies, emergency response, historical context, property values, shoreline erosion, changing environmental conditions, and concerns for the future.
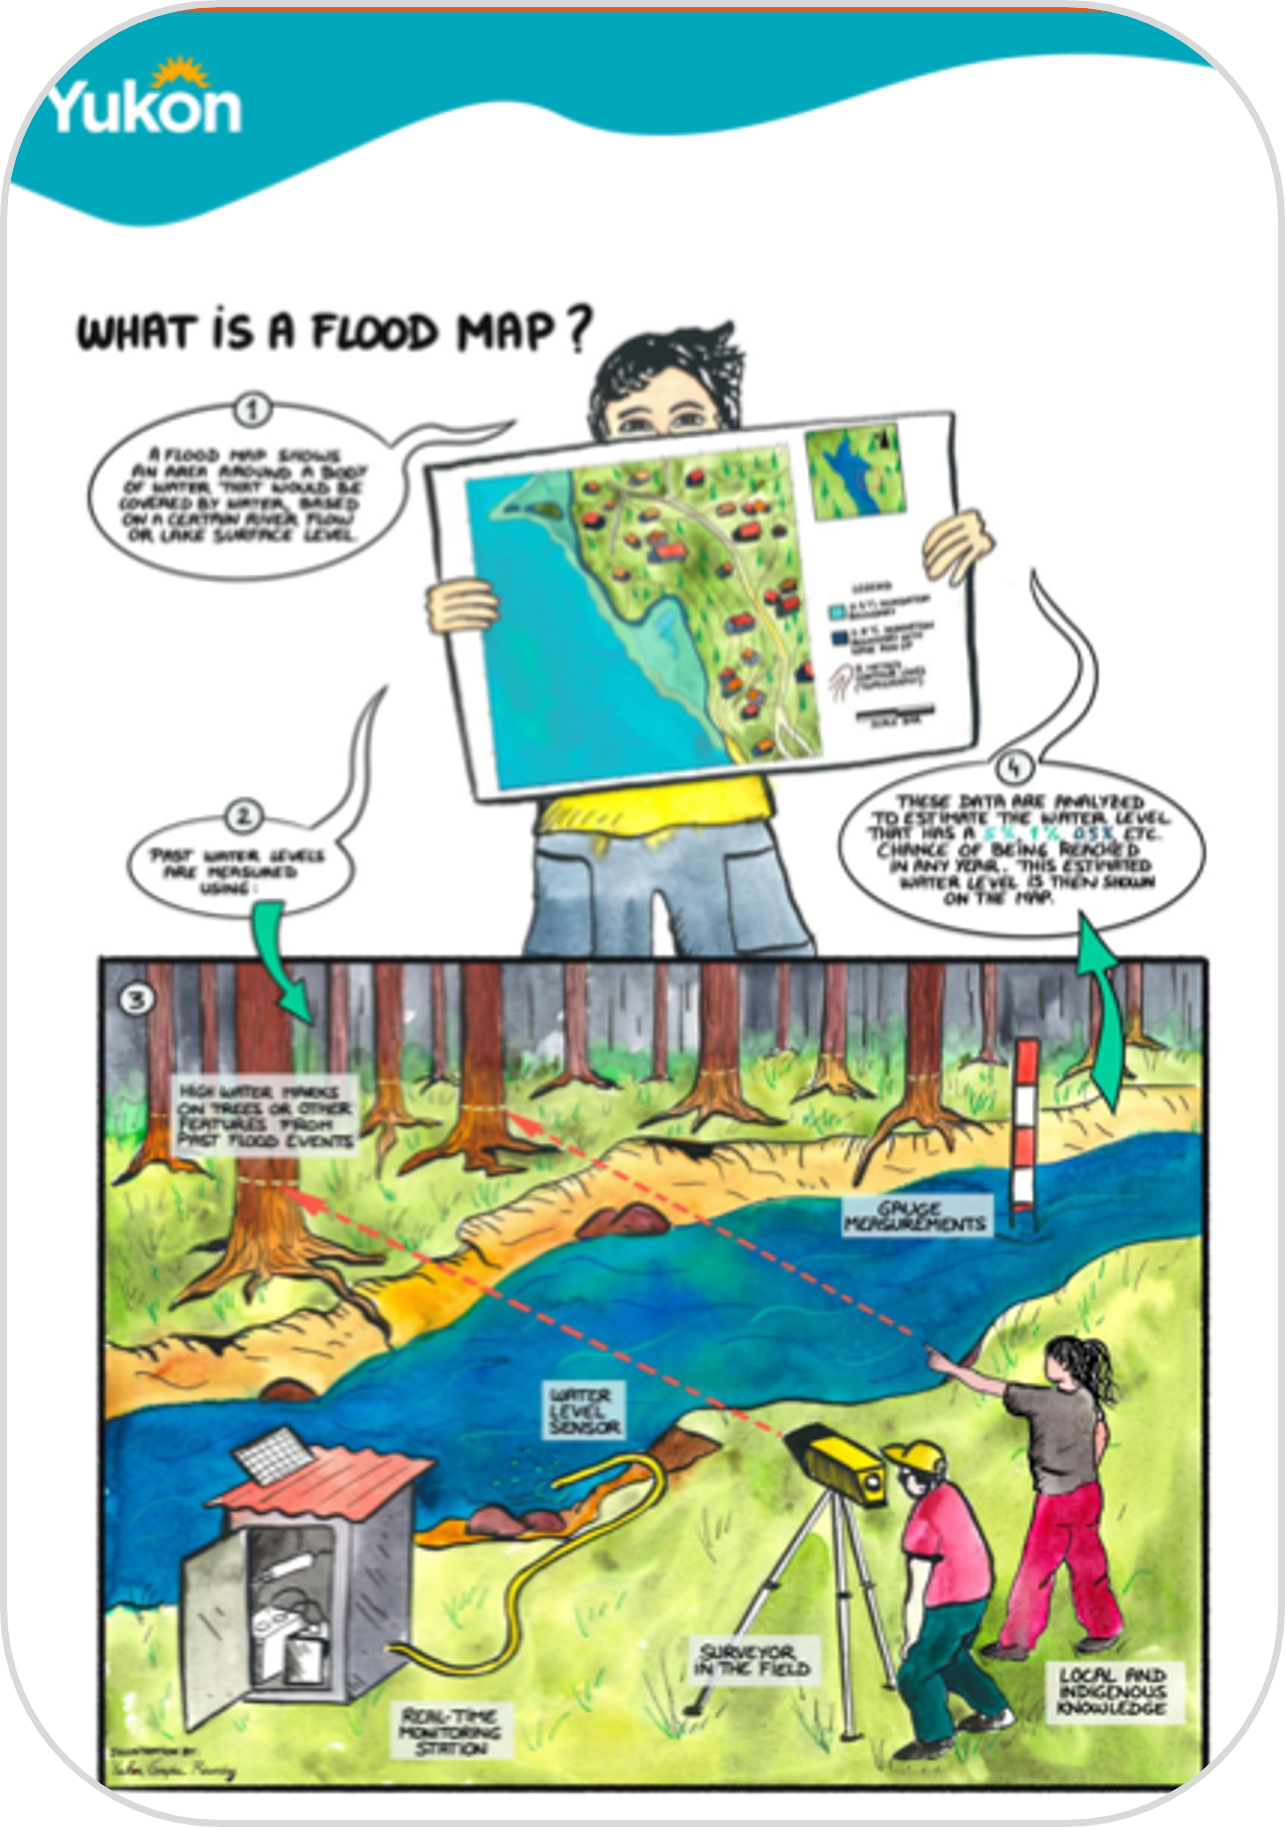
Figure 9: Illustrations were used for enhancing public understanding (Government of Yukon, 2024b).
Text version
A cartoon-style illustration titled “What is a Flood Map?”, displayed beneath a teal header featuring the Yukon wordmark with its stylized sun icon.
At the top centre, a person is shown holding a large flood map. The map displays a river, surrounding land, buildings, and flood zones marked with different colours and symbols. A legend on the map identifies mapped features and flood-related information.
Speech bubbles and numbered callouts explain key concepts. One callout states that a flood map shows areas affected by flood events that would be expected to occur during a certain water level or flooding scenario. Another callout explains that past water levels are measured and recorded.
The lower half of the image shows a cross-section of a river and surrounding forested area. Trees line the riverbanks, and dashed lines indicate flood extents across the landscape. Text notes that high water marks on trees or structures indicate past flood events.
Several measurement tools are illustrated near the river with 2 people working. These include a water-level sensor placed in the river, a real-time monitoring station housed in a small structure on the riverbank, and a survey tripod with equipment used by a field surveyor. A vertical measuring staff labelled “gauge measurements” stands in the river to show water height.
Another callout explains that these data are combined to estimate water levels during events such as a 1-in-200-year flood, and that observed water levels are then shown on the map. A final label notes the use of local and Indigenous Knowledge as part of the mapping process.
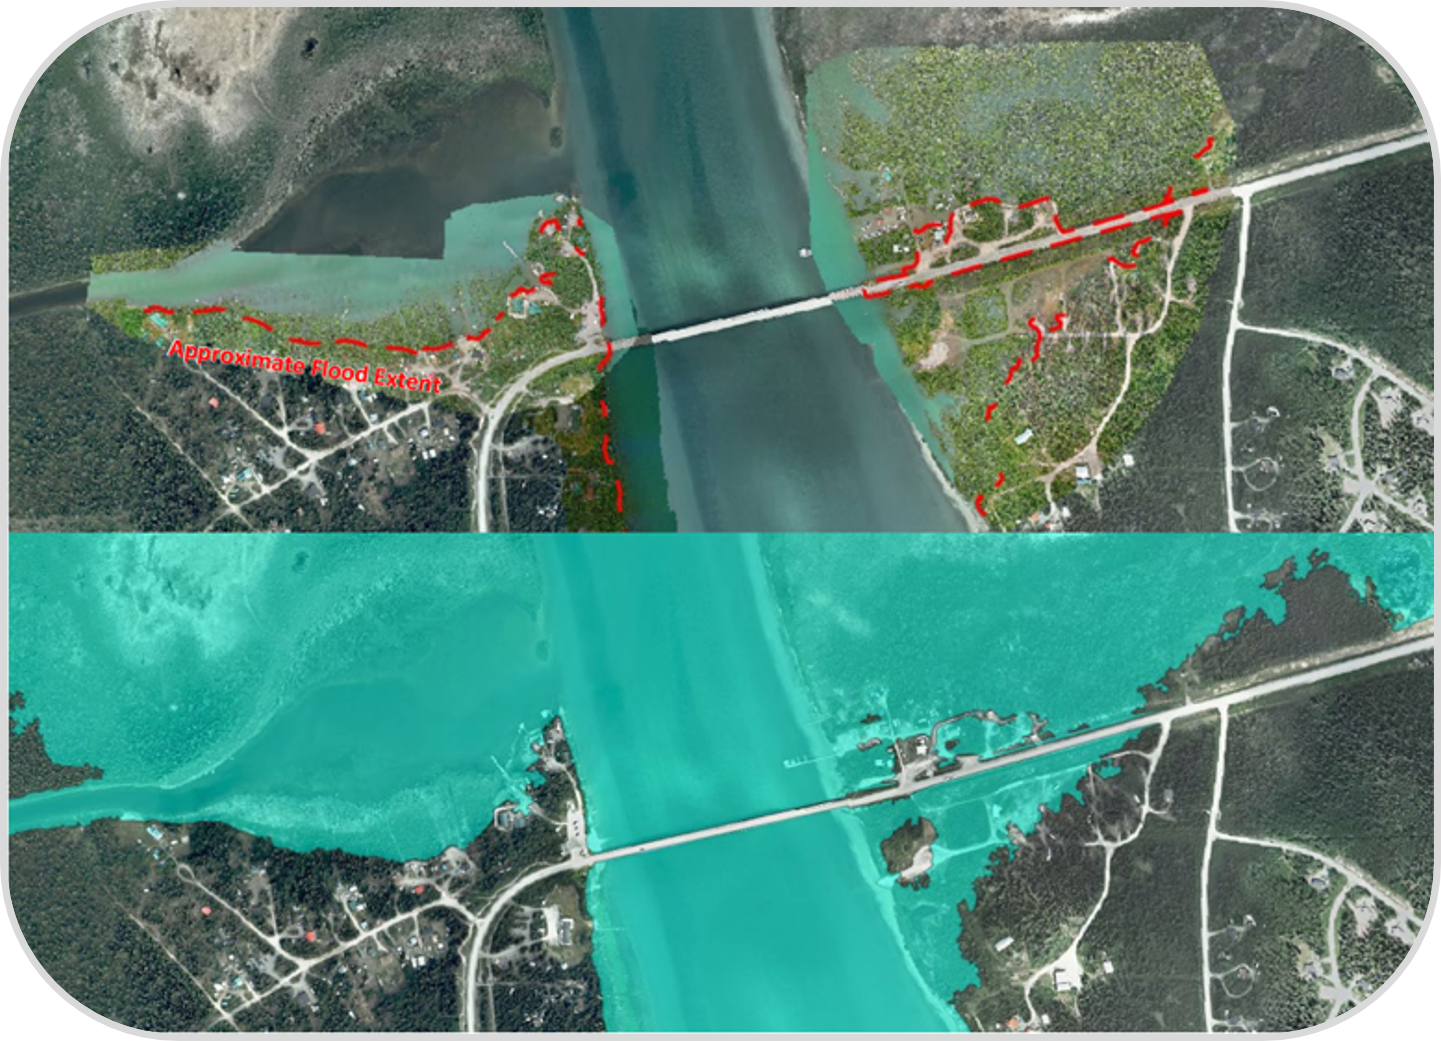
Figure 10: A comparison of the 2021 flood extent and the 1% annual exceedance probability (AEP) in Tagish (Government of Yukon, 2024c).
Text version
A side-by-side comparison of aerial map imagery showing a river crossing and surrounding land, divided horizontally into two sections.
The top half shows a satellite image of a river with a bridge crossing from left to right. Roads, scattered buildings, and forested areas are visible on both sides of the river. Over this image, dashed lines mark areas labelled “Approximate Flood Extent”.
The bottom half shows a similar aerial view of the same area, but with a coloured overlay covering large portions of land near the river and wetlands. The bridge, roads, and nearby development remain visible beneath the overlay.
The Government of Yukon sought First Nations involvement from the onset of the project to ensure that the map boundaries encompassed areas of importance. The Government of Yukon provided formal notices to the governments of Carcross/Tagish First Nation (C/TFN), Ta’an Kwäch’än Council (TKC), and Kwanlin Dün First Nation (KDFN). Meetings were held with staff representatives of the TKC Lands, Resources, and Heritage department and the KDFN Heritage, Lands, and Resources department. The WRB has committed to engaging in further collaboration to support the three local First Nations on land-use planning and additional flood mapping activities within First Nation territories.
Outcome
The engagement sessions prompted productive conversations about flood risk reduction, and feedback received improved the way information was presented on the maps. Public input was incorporated into the updated final flood hazard maps, which have since been published through the Flood Hub. The WRB also responded to requests for more details on the data and methodology used to prepare the maps, committing to the release of technical and plain language summaries for enhanced transparency. In addition to ongoing work with C/TFN, TKC, and KDFN, the WRB plans to continue to engage with Local Advisory Councils, relaying information to the communities and responding to follow-up questions. The engagement process and input received was documented by WRB (Government of Yukon, 2024a) in a What We Heard report, linked below.
Additional Resources
Learn more about the public engagement process in the What We Heard Report (Government of Yukon, 2024a) and read the plain language summary, Southern Lakes flood hazard mapping (2024b), which includes the graphic illustrations and other public risk communications information used by project team.
7.3 Case Study: Tuktoyaktuk Community Climate Resilience Project
Community Climate Monitoring to Enhance Local Adaptation Planning
The Tuktoyaktuk Community Climate Resilience Project (TCCRP) is an initiative that was launched in 2018 by the Tuktoyaktuk Community Corporation, in Tuktoyaktuk, Northwest Territories (Figure 11). Faced with escalating challenges from coastal erosion, permafrost thaw, and increased flooding due to climate change, the project engages members of the local Inuvialuit community to observe and measure environmental changes. With seed funding provided by Crown-Indigenous Relations and Northern Affairs Canada and additional support received through the 2021 Artic Inspiration Prize competition, the TCCRP focuses on disseminating scientific and local knowledge to enhance climate resilience and prepare the community for future decision-making. See Table 9 for case study characteristics.
Table 9: Case Study Characteristics of Tuktoyaktuk Community Climate Resilience Project
| TUKTOYAKTUK COMMUNITY CLIMATE RESILIENCE PROJECT | |
|---|---|
| Scale |
|
| Flood Hazard |
|
| Levels of Community Engagement |
|
| Flood Mapping Components |
|
| Actors |
|
| People Engaged |
|
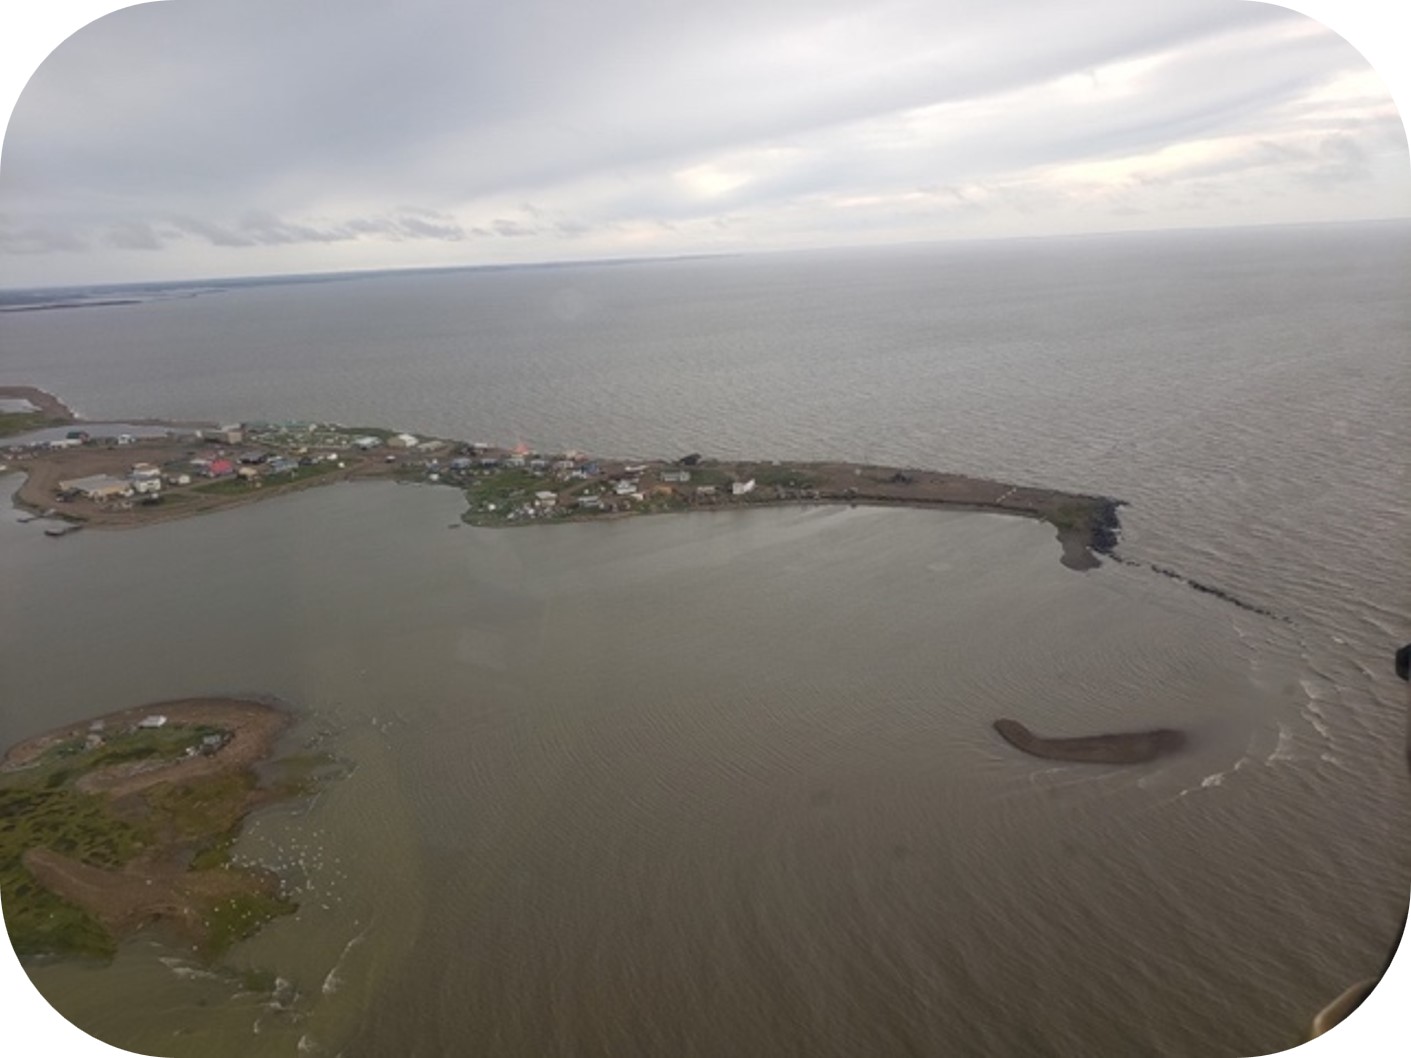
Figure 11: Tuktoyaktuk, located on a peninsula in the Beaufort Sea, is experiencing rapid land loss due to coastal erosion processes and sea-level rise (Tuktoyaktuk Community Corporation Resilience Project, 2019a).
Text version
An aerial view of Tuktoyaktuk, a small coastal community situated on a narrow strip of land extending into open water. The landform curves outward, forming a peninsula or barrier that separates calmer, shallow water on the left from larger open water on the right.
Several small buildings and houses are clustered near the centre of the land, connected by roads or paths. Sparse vegetation and bare ground are visible across the peninsula, with rock or soil near the shoreline. A few small, low-lying islands or sandbars appear in the water nearby.
The horizon line is visible in the distance, where the water meets an overcast sky.
Engagement
The TCCRP uses a multifaceted engagement approach that includes community collaboration and empowerment through citizen science and youth and elder involvement.
Community members are engaged through climate monitoring. Interested community members are trained (Figure 12, Figure 13) in various geospatial and data collection methods to support the collection, management, and dissemination of environmental indicators, such as ice thickness, permafrost depth, air temperature, water temperature, plant leaf and bloom dates, harvest yields, ice forming and thaw dates, and distance from land to sea ice. Local issues are also documented through the program, such as erosion, extreme weather, and flooding events. Including the community in the research team ensures local needs and values are recognized and integrated into monitoring and field work (Murray, 2019). Community collaboration and empowerment is achieved by working together with the community and ensuring the community drives priorities.
Partnerships with the Mangilaluk School and the Junior Rangers involved students in hands-on monitoring activities to increase their knowledge about climate change adaptation and share their ideas. Elders were involved by contributing Traditional Knowledge and observations on environmental changes, providing context to scientific data, and ensuring cultural relevance in monitoring practices (Tuktoyaktuk Community Corporation, 2018).
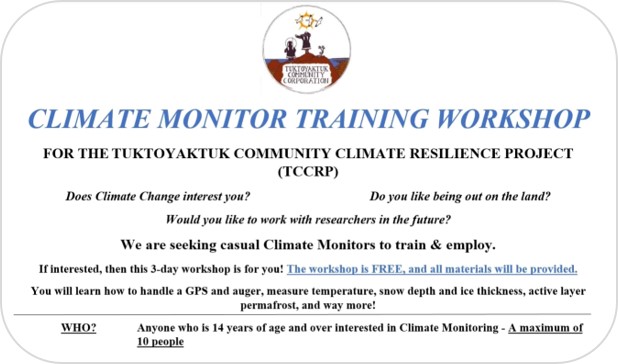
Figure 12: Recruitment poster for the TCCRP Climate Monitory Training Workshop, a skill-building initiative administered by the Aurora Research Institute (Tuktoyaktuk Community Corporation Resilience Project, 2019b).
Text version
A poster announcing a training event. At the top centre is a circular logo with illustrated people and reads “TUKTOYAKTUK COMMUNITY CORPORATION”. The main heading below the logo reads “CLIMATE MONITOR TRAINING WORKSHOP”. A subheading beneath it reads “FOR THE TUKTOYAKTUK COMMUNITY CLIMATE RESILIENCE PROJECT (TCCRP)”.
Below the headings, several questions appear, arranged as short prompts:
“Does climate change interest you?”
“Would you like to work with researchers in the future?”
“Do you like being out on the land?”
A paragraph underneath states that the organizers are seeking Casual Climate Monitors to train and employ. It notes that those interested in the three-day workshop will receive hands-on training, and that all necessary equipment will be provided. The text explains that participants will learn how to handle GPS units, measure temperature, snow depth and ice thickness, and perform active-layer measurements.
Near the bottom, eligibility information appears under the heading “WHO?” stating that anyone who is 14 years of age and over and interested in Climate Monitoring may apply, to a maximum of 10 people.
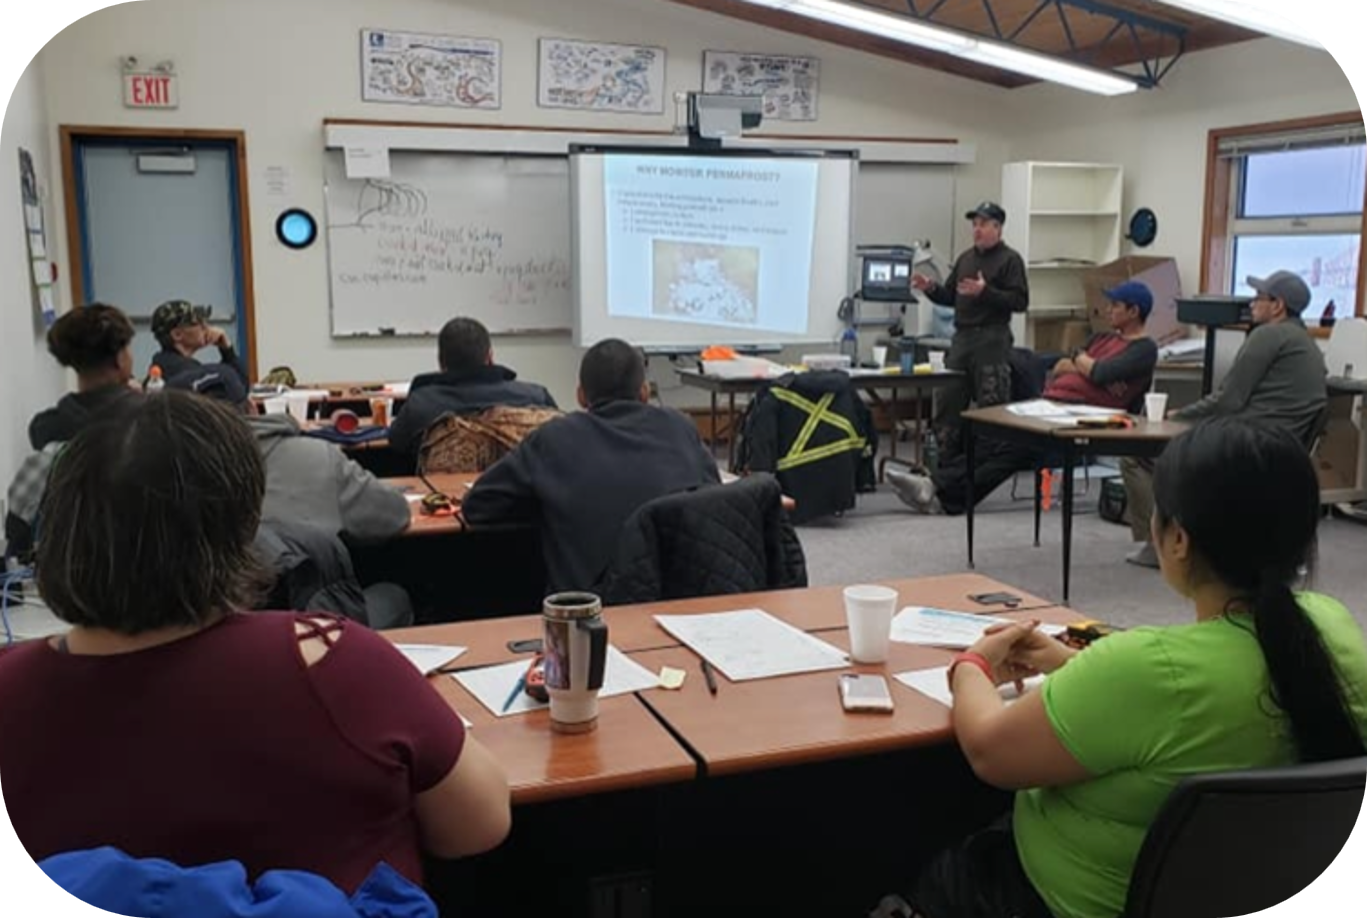
Figure 13: Data collection workshop held with community members (Aurora Research Institute, 2021).
Outcome
Community-based data collection (Figure 14) allows for long-term, continuous, and reliable data collection. The integration of Traditional Knowledge with scientific methods results in comprehensive datasets on climate indicators, strengthening local decision-making. Data collected through the project has supported local discussions on the location for new infrastructure and adaptation planning. For example, TCCRP data was used to help provide a brief assessment of the flooding potential and thermal conditions of two proposed sites for the Tuktuyaaqtuuq Centre for Arts and Culture.
Community-collected data informs local and regional climate adaptation strategies, such as potential community relocation due to coastal erosion, ensuring discussions are grounded in both scientific evidence and community values. The success of the TCCRP serves as a model for other Indigenous and northern communities facing similar climate challenges, demonstrating the benefits of community-based approaches.
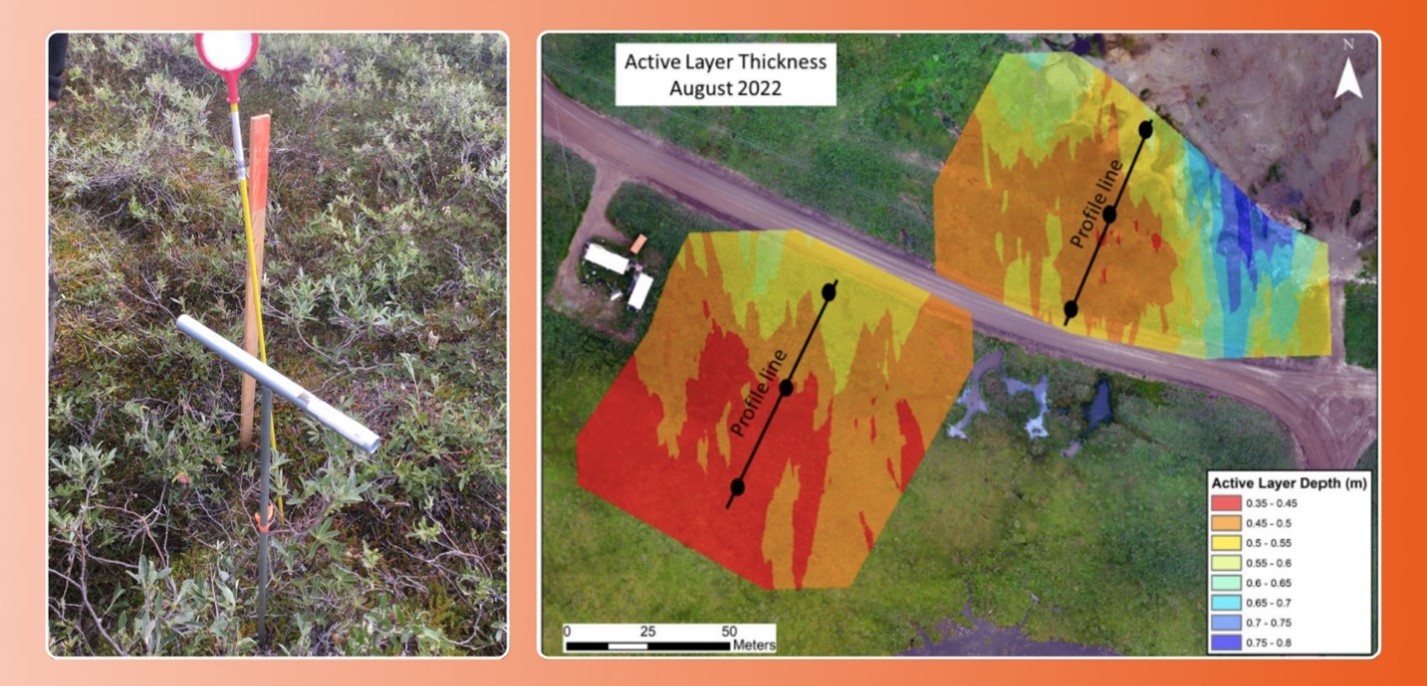
Figure 14: Community data-collection methods, such as permafrost sampling (left) (Tuktoyaktuk Community Corporation Resilience Project, 2019c), have contributed to a preliminary geophysical assessment for the Tuktuyaaqtuuq Centre for Arts and Culture. Maps were produced to show seasonal thaw conditions (right), storm surge water levels, and the ground temperature profile (Whalen et al., 2022).
Text version
A side-by-side panels of two images, presenting field measurement and mapped results related to permafrost active layer thickness.
The left panel shows a close-up photograph of field equipment installed in low vegetation. A vertical measuring probe is inserted into the ground, surrounded by shrubs and moss. A horizontal bar is attached partway up the vertical rod. The ground surface appears uneven and vegetated.
The right panel shows a colour-coded aerial map titled “Active Layer Thickness August 2022.”
A legend uses eight colours to represent the active layer thickness. Red represents 0.35 to 0.45 m, orange represents 0.45 to 0.50 m, dark yellow represents 0.50 to 0.55 m, light yellow represents 0.55 to 0.60 m, light green represents 0.60 to 0.65 m, light turquoise represents 0.65 to 0.70 m, light blue represents 0.70 to 0.75 m, and dark blue represents 0.75 to 0.80 m.
The map displays two polygon areas on either side of a road. Each polygon is shaded in graduated colours ranging from red and orange to yellow, green, and blue.
Black dots connected by lines labelled “Profile line” run across each polygon, indicating measurement transects. A north arrow and a scale bar labelled ranges from 0 to 50 metres appear on the map.
7.4 Case Study: False Creek Coastal Adaptation Plan and Sea2City Design Challenge
Multifaceted Engagement Blends Arts, Culture, and Science
Since 2012, the City of Vancouver (CoV) has been involved in a multi-stage coastal adaptation planning process to adapt highly urbanized areas along the Fraser River, Burrard Inlet, English Bay, and False Creek to sea level rise. A key component of this work was the Sea2City Design Challenge (Sea2City), a design exercise where the City hired consultants to work with staff, Host Nation representatives, public, youth, and technical experts to re-imagine, decolonize, and revitalize the False Creek shoreline (CoV, 2022). As part of its innovative “values-based planning” process, CoV developed a set of values-based planning and design principles to guide the City’s coastal adaptation work, which are based on Indigenous perspectives that Host Nation representatives shared, and local community values elicited through public engagement (Figure 15) (CoV, 2021b, 2022).
Multidisciplinary teams of architects, designers, planners, and cultural advisors worked with municipal and First Nations government staff to co-create shared visions of climate-resilient waterfront designs. This work created renderings and visualizations of a range of mitigation options (CoV, 2022; Mithūn et al., 2022). Municipal staff further engaged community members and interested parties through a targeted public outreach campaign to enhance risk awareness and seek input. Through decolonial, collaborative planning, CoV sought to engage in meaningful acts of reconciliation with leadership and staff from Musqueam, Tsleil-Waututh, and Squamish First Nations. See Table 10 for case study characteristics.
Table 10: Case Study Characteristics of False Creek Coastal Adaptation Plan and Sea2City Design Challenge
| FALSE CREEK COASTAL ADAPTATION PLAN AND SEA2CITY DESIGN CHALLENGE | |
|---|---|
| Scale |
|
| Flood Hazard |
|
| Levels of Community Engagement |
|
| Flood Mapping Components |
|
| Actors |
|
| People Engaged |
|
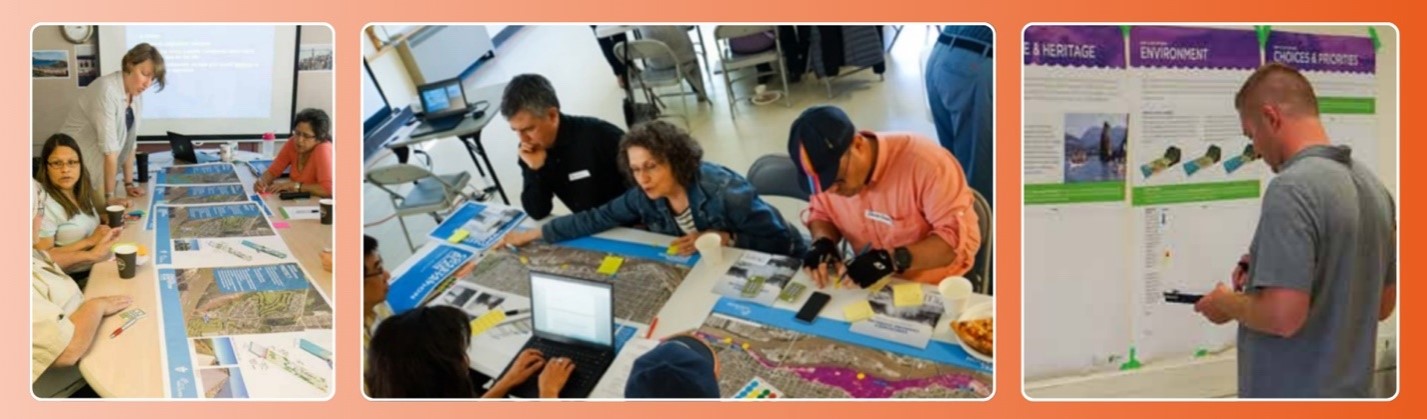
Figure 15: Prior engagements with the Host Nations (left), as well as community workshops (centre) and open houses (right) identified a guiding set of community values that informed subsequent phases of planning (CoV, 2018, 2021a).
Text version
A composite of three photographs arranged side by side.
The left photograph shows several people seated around a large table indoors. Large, printed maps and aerial photos are spread across the table, along with notebooks and sticky notes. A person stands and leans over the table. A projected slide is visible on a screen in the background.
The centre photograph shows another group gathered closely around a table covered with large-format maps and documents. Some participants lean forward, examining details on the maps, while one person uses a laptop placed on the table and another person is pointing or gesturing toward the maps. Sticky notes and writing tools are visible.
The right photograph shows a person standing near a wall-mounted display with posters and maps. The person appears to be reading or recording information from the display using a handheld device.
Engagement
CoV’s coastal adaptation planning has been grounded in a bottom-up, values-based approach that centres local lived experiences, youth voices, and Indigenous worldviews (CoV, 2021b). Through an iterative and multifaceted engagement process, CoV has partnered with the Host Nations, community organizations, schools, local artists, and the business community to maximize community outreach and engagement, engaging over 2,000 residents (CoV, 2021b, 2022).
Staff informed the community, sharing online communications and engaging in a targeted public information campaign to build risk awareness. Activities included a dedicated website with plain-language resources, interactive web-based maps and a map atlas (Figure 16), a social media campaign, the “Conversations in Canoes” video series, signage in high-traffic public spaces along False Creek, pop-up displays at community centres, student lectures, and a youth activity book (CoV, n.d., 2020, 2025). CoV partnered with artists and students to incorporate live performances and art installations to enhance public interest and reach a wider audience.
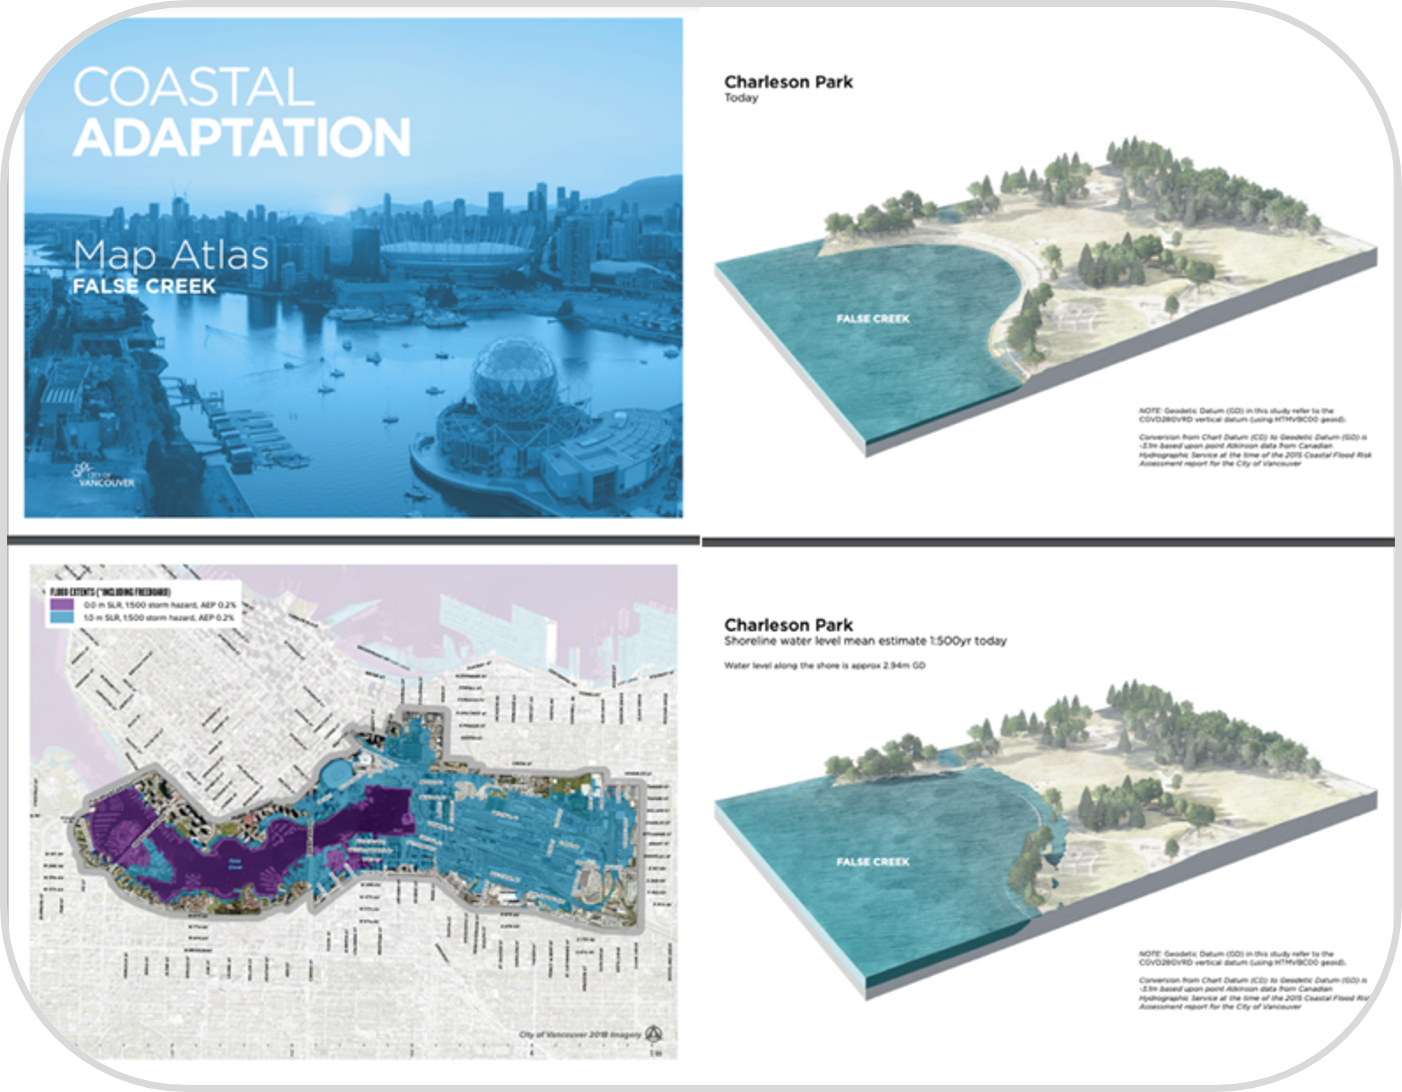
Figure 16: Landscape visualizations and flood maps of at-risk areas, found in a “map atlas,” were used to enhance public risk awareness (CoV, n.d.).
Text version
A four-panel composite.
The top-left panel shows an aerial photograph of an urban waterfront with high-density buildings surrounding a body of water. Large text reads “COASTAL ADAPTATION” and “Map Atlas—False Creek.”
The top-right panel is a three-dimensional landscape rendering labelled “Charleson Park—Today.” It shows shoreline land, trees, pathways, and adjacent water labelled “FALSE CREEK.” The water level appears relatively low.
The bottom-left panel presents a detailed plan-view map of False Creek with colour-shaded areas, representing different flood hazard or water-level scenarios. Streets, waterways, and surrounding urban features are visible, with a legend indicating modelled water levels. Some of the streets are flooded.
The bottom-right panel shows another three-dimensional rendering labelled “Charleson Park—Shoreline water level mean estimate 1:500 yr today.” The water surface is visibly higher along the shoreline compared to the top-right panel.
The project team consulted community, both virtually and in person. CoV leveraged its existing “Shape Your City” platform for online input, hosted an interactive online message board, and created a participatory map of False Creek where residents could link comments to specific sites (CoV, 2020). CoV also administered an online survey and hosted multiple open houses (Figure 17). The Sea2City design teams consulted with multiple advisory groups: the City Advisory Team, Technical Advisory Group, Community Advisory Group, and the Youth Adaptation Lab.
Community members were involved through “Community Conversations” workshops (Figure 18) held with neighbourhood groups and community organizations as well as through industry-specific sessions with facilities managers, asset owners, and infrastructure operators. CoV partnered with CityHive to co-deliver youth engagement workshops. CoV co-hosted seven “Decolonization and Indigenous Perspectives” workshops and events with the Host Nations.
CoV collaborated with universities to further explore innovative coastal adaptation planning approaches. City staff engaged as “solution seekers” in the Pacific Institute for Climate Solutions (PICS) project Living with Water, working with an interdisciplinary network of researchers, non-profit organizations, Host Nations, and other local governments aiming to decolonize the coastal adaptation solution space and bridge regional flood risk governance gaps (Living with Water, n.d.). Through the collaboration, CoV staff learned from global best practices related to innovative mitigation approaches (e.g., nature-based solutions, managed retreat), brainstormed and validated ideas, and partnered with researchers (PICS, 2024).
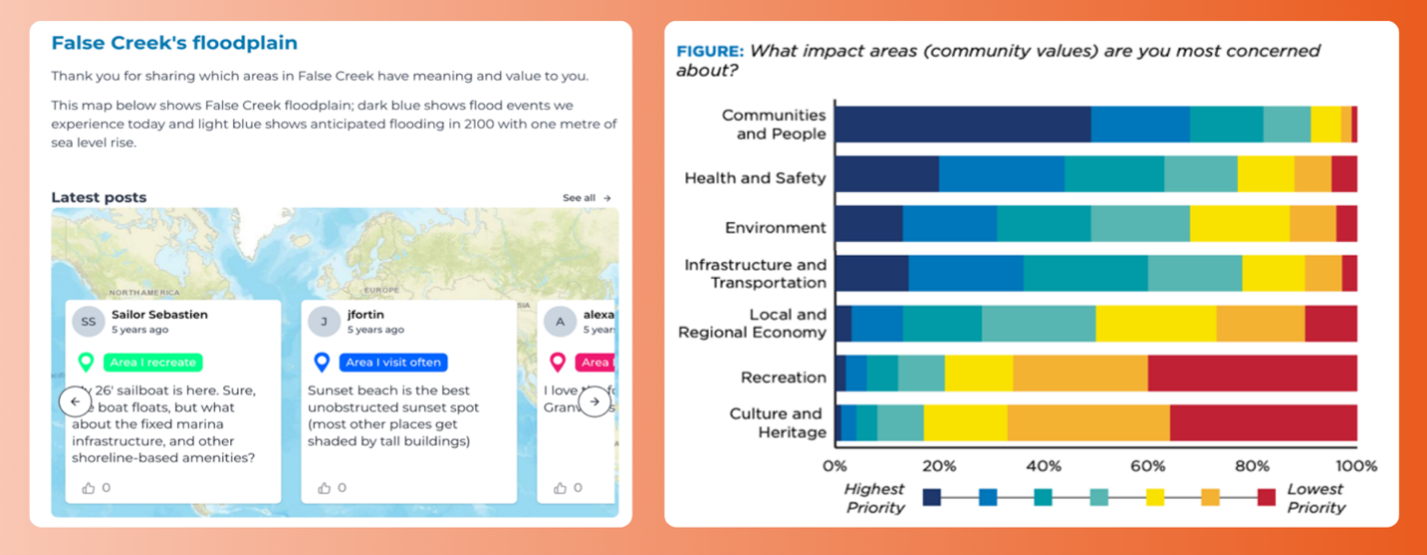
Figure 17: A participatory map of False Creek (left) and surveys were used to elicit local values (right) (CoV, 2020, 2021a).
Text version
A two-panel layout presenting community input and priorities.
The left panel is titled “False Creek’s floodplain.” It includes explanatory text thanking participants for sharing areas of meaning and value in False Creek. The text explains that dark blue on the map represents flood events experienced today, while light blue shows anticipated flooding in the year 2100 with one metre of sea-level rise.
Below the text is an interactive map interface. Over the map are comment cards from participants, each associated with a location pin. The cards include short statements such as places people recreate, visit often, or value for amenities like marinas and shoreline access. Each card shows a user icon, a time reference (for example, “5 years ago”), and a category labels such as recreation or frequent use.
The right panel contains a horizontal bar chart titled “What impact areas (community values) are you most concerned about?” The chart lists categories on the vertical axis: Communities and People, Health and Safety, Environment, Infrastructure and Transportation, Local and Regional Economy, Recreation, and Culture and Heritage.
Each category is represented by a segmented bar with multiple colours indicating different priority levels. The chart uses a colour scale ranging from dark blue to red to represent the level of priority assigned to each community value. Shades of blue correspond to the highest priorities, while shades of yellow, orange, and red represent lower priorities. The horizontal axis is graduated from 0% to 100%.
The categories Communities and People, Health and Safety, Environment, and Infrastructure and Transportation contain a large proportion of blue and green segments, indicating higher priority rankings. The categories Recreation and Culture and Heritage contain a greater proportion of yellow, orange, and red segments, indicating lower priority rankings.
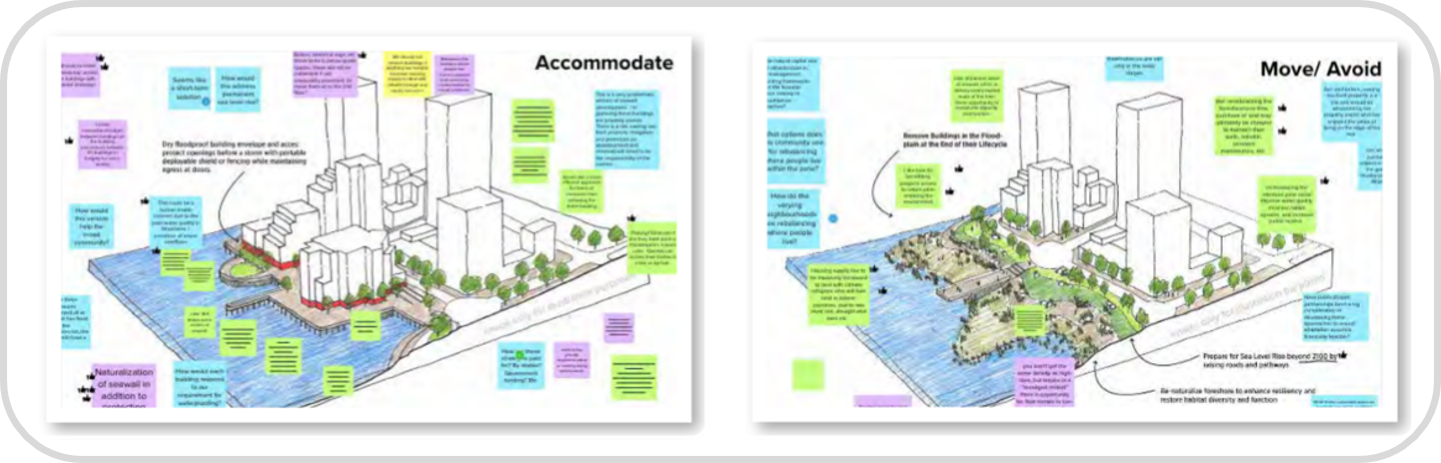
Figure 18: During one Community Conversation workshop, participants explored potential mitigation options through virtual whiteboards (CoV, 2021a).
Text version
A two side-by-side conceptual diagrams illustrating contrasting coastal flood adaptation approaches for an urban waterfront area. Both diagrams show the same stylized city block with buildings, streets, shorelines, and adjacent water, viewed from an elevated perspective.
The left diagram is titled “Accommodate.” It shows buildings along the waterfront. The shoreline includes raised edges, naturalized areas, and water channels integrated into the urban landscape. Numerous coloured text notes are placed throughout the diagram.
The right diagram is titled “Move/Avoid.” It shows a reshaped shoreline with fewer or no buildings in areas closest to the water. Development appears set farther back, while the waterfront is converted into naturalized landforms, wetlands, and open green spaces. The diagram includes similar coloured text notes explaining relocation, avoidance of high-risk areas, and use of nature-based features to reduce flood risk.
CoV collaborated with the Host Nations, signing a Memorandum of Understanding in 2020 and working with leadership, staff, and cultural advisors to co-create a vision for shoreline resilience that reflected Coast Salish values and priorities (CoV, 2021a). To centre youth perspectives in the decision-making process, CoV partnered with CityHive to lead the Youth Adaptation Lab, which sought to inspire youth to become climate leaders, engaging them in action-oriented dialogue and problem-solving activities with experts and project mentors, and enabling them to contribute insights that will be incorporated into CoV’s ongoing adaptation processes (CityHive, 2022).
“Collaboratoriums” were another key component of the Sea2City Design Challenge, fostering collaboration between multidisciplinary design teams, city staff, technical experts, Host Nation cultural advisors and representatives, and youth. These sessions aimed to engage in interactive problem-solving, co-create innovative adaptation solutions, integrate Indigenous Knowledge, foster interdisciplinary thinking, and engage in a series of hands-on learning activities (CoV, 2022). These sessions ensured that the final design concepts were grounded in local knowledge and priorities and allowed the project’s designers, planners, and architects to integrate public input (CoV, 2022).
Outcome
The iterative nature of CoV’s engagement with diverse knowledge holders and partners is reflected in the final Sea2City design concepts and project learnings (CoV, 2022). Through the multi-year award-winning process, CoV integrated flood mapping and risk assessments with outreach and engagement activities that transparently, creatively, and inclusively engaged community members. Through the design process, the Sea2City project team co-created decolonial adaptation language and framings, developed landscape visualizations, scoped future mitigative actions, and provided a guiding framework of coastal adaptation principles to integrate within CoV’s broader Climate Adaptation Strategy (CoV, 2022, 2024). This multifaceted engagement and blend of arts, culture, and science is being used to identify priority actions for the next phase of developing and implementing pilot projects (Figure 19) (CoV, 2022).
Additional Resources
Learn more about the City of Vancouver’s plan to adapt to sea-level rise, including the City of Vancouver’s Coastal Adaptation: False Creek and Coastal Adaptation Plan: Fraser River Foreshore.
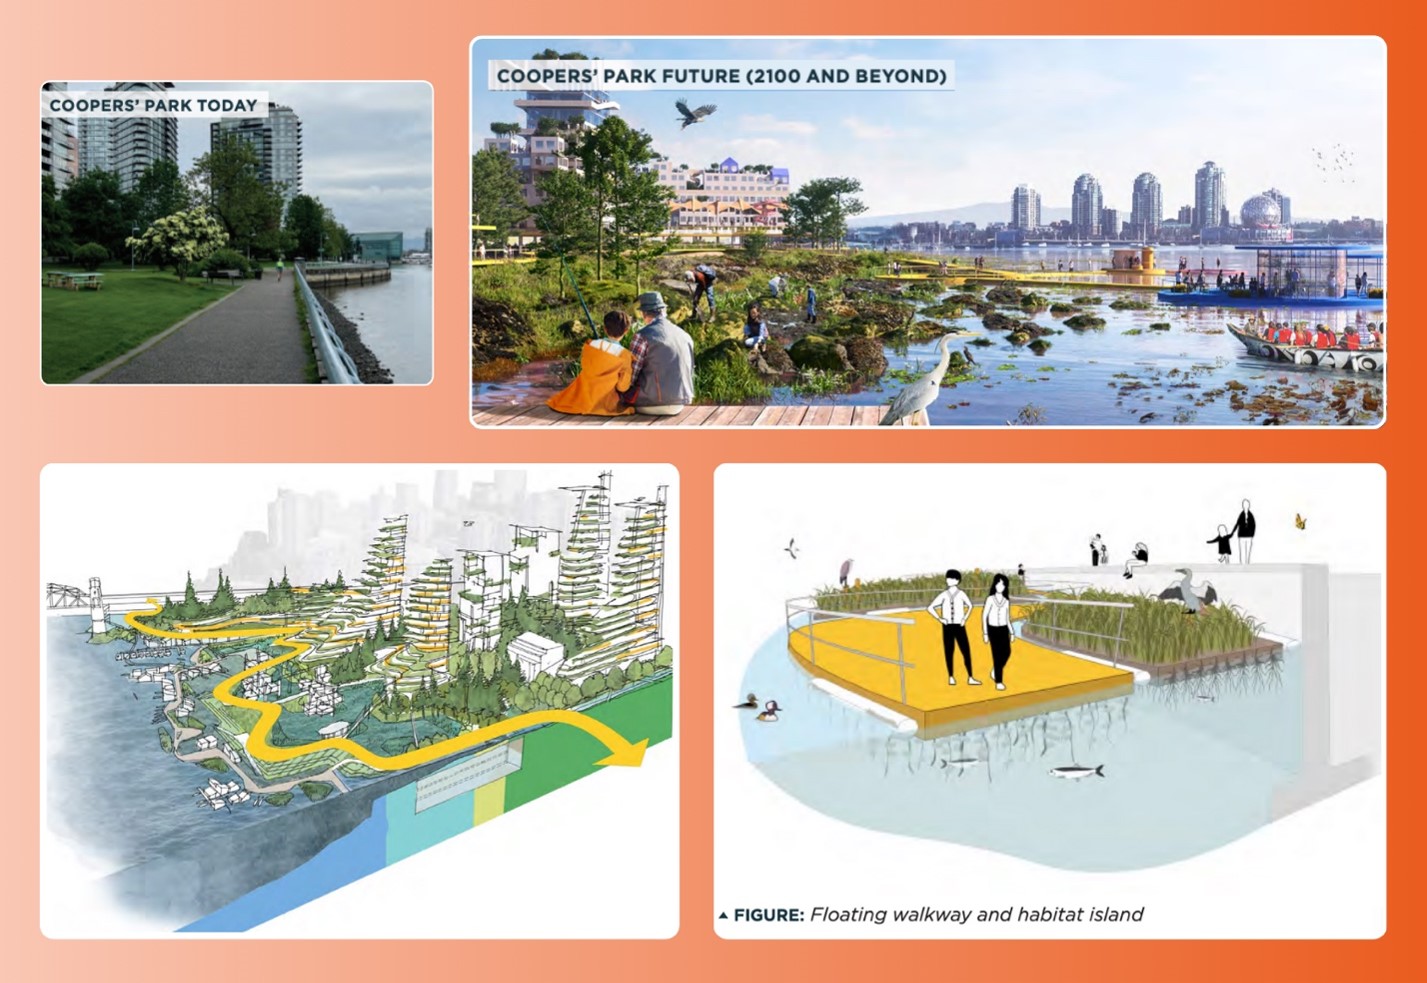
Figure 19: The Sea2City project teams developed site-specific visualizations and proposed pilot projects that aligned with community values (CoV, 2022).
Text version
A four-panel composite illustrating present and future visions for Coopers’ Park and waterfront adaptation.
The top left panel labelled “Coopers’ Park Today,” shows an existing waterfront park with a paved walking path, grass, trees, and high-rise buildings in the background along the shoreline.
The top right panel labelled “Coopers’ Park Future (2100 and Beyond),” shows a conceptual rendering of a transformed waterfront. Naturalized shorelines, shallow water areas, vegetation, and people using boardwalks and paths are visible. Buildings remain in the background.
The bottom-left panel is an illustrated axonometric and cross-section view showing a redesigned waterfront edge. Elevated pathways, terraced landscapes, water channels, and planted areas are integrated with buildings. A yellow arrow runs along the relief.
The bottom-right panel is a conceptual illustration labelled “Floating walkway and habitat island.” It shows a floating platform with a railing connected to vegetate floating islands. People stand on the walkway while birds and aquatic life are depicted in and around the water below.
7.5 Case Study: Sackville and Little Sackville Rivers Floodplain Mapping
Public Meetings Provide Residents with a Valuable Opportunity to Share Concerns with Each Other and for Municipal Staff to Listen, Understand, and Respond
Floodplain maps, and corresponding planning regulations, for Sackville River and Little Sackville River were developed in the 1980s. Like many Canadian cities and municipalities, changes to land use and weather patterns are altering flood risk areas, rendering existing floodplain maps outdated. In 2018, the Halifax Regional Municipality (HRM) began the legislative process to update the floodplain land-use policies and regulations for the Sackville River and Little Sackville River based on a 2017 floodplain study completed by CBCL Limited Consulting Engineers. In 2024, a new floodplain study was completed by DesignPoint Engineering and Survey based on feedback received from the public during open houses and meetings held in 2018.
The 2024 floodplain study incorporated new survey and hydraulic information, as well as new lidar data and a digital elevation model that had only become available after the 2017 study was completed. Building on the 2017 study and model, DesignPoint's 2024 study included floodplain maps for the 1:20 and 1:100 floods with climate change projections to 2100. See Table 11 for case study characteristics.
Table 11: Case Study Characteristics of Sackville and Little Sackville Rivers Floodplain Mapping
| SACKVILLE AND LITTLE SACKVILLE RIVERS FLOODPLAIN MAPPING | |
|---|---|
| Scale |
|
| Flood Hazard |
|
| Levels of Community Engagement |
|
| Flood Mapping Components |
|
| Actors |
|
| People Engaged |
|
Engagement
In August 2024, HRM held six public information meetings over two days to inform and consult with HRM residents on the outcomes of the updated floodplain maps and draft regulations. Three invitation letters were sent to over 2,655 property owners, residents, tenants, businesses (e.g., Bedford Mall) and organizations (e.g., Sackville Rivers Association) whose property was completely or partially located within the updated floodplain maps. Public service announcements were sent to local radio and television stations. Businesses, organizations, residents, and property owners also received open invitations to meet with the HRM project team to ask questions or share concerns.
The first three meetings took place on August 21, 2024, in Bedford, NS, and the second three meetings took place on August 28, 2024, in Lower Sackville, NS. Before each meeting, there was an open house where attendees could view posters with information about the Sackville Rivers Watershed, the Sackville Rivers Floodplain Studies, and the proposed draft regulations. This provided an opportunity for attendees to ask HRM staff questions. Following the open houses, meetings began with a presentation followed by a question-and-answer period where attendees could ask questions and receive answers directly from the project team. A total of 241 people attended the meetings.
Comments and suggestions from the public meetings were compiled into a What We Heard report. Many concerns were raised during the meeting, including general concerns for flooding and the impacts of flooding on the community, changes to property values, limits to future development, access to insurance, and the timing and prioritizing of flood mitigation measures.
Outcome
The number of properties in the 1:20 floodplain increased from ~500 identified in the maps from the 1980s to ~900 in the 2024 maps, underscoring the need for updated flood maps to help identify and communicate flood risk (Figure 20). A member of HRM’s planning staff underscored how valuable engagement is in informing the project team of the public’s priorities, as well as in helping to ensure the project team delivers appropriate levels of information (HRM, 2025). HRM planning staff also commented that with such a large project it is important to maintain a focused process by providing clear information with specific items for the public to respond to.
Suggestions received during the public meetings were used by HRM staff to refine and improve the proposed policies and regulations (Figure 21). The new regulations designate the 1:20 floodplain as a floodway, restricting all new structural development that would obstruct the floodway or pose a risk to public safety. Non-structural development such as trails, parks, roads, public utilities, and parking lots are permitted. In April 2025, HRM Council approved the revised floodplain zones, and they were incorporated into municipal planning documents that came into effect in May 2025.
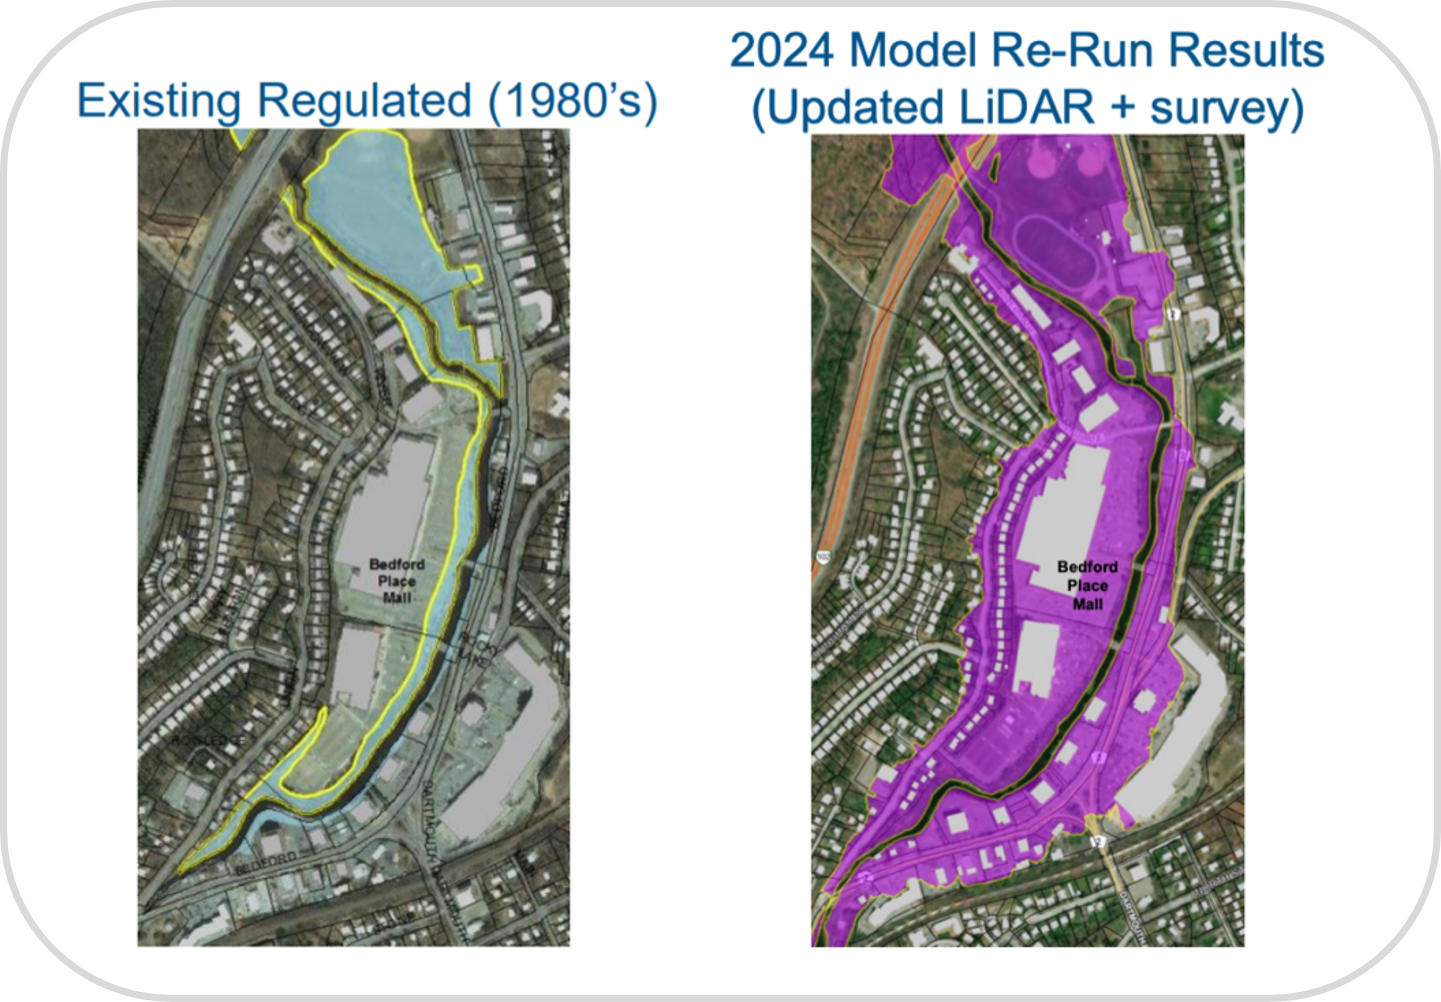
Figure 20: The 1980 and 2024 flood hazard maps (HRM, 2024).
Text version
A side-by-side comparison of two flood maps for the same urban area displayed on aerial imagery.
The left map is titled “Existing Regulated (1980s).” It shows a narrow flood corridor following a river through a developed area. The flood is highlighted mainly in light blue, with a yellow outline. Surrounding features include residential streets, buildings, and a commercial area labelled “Bedford Place Mall.” The flood extent appears limited and closely follows the watercourse.
The right map is titled “2024 Model Re-Run Results (Updated LiDAR + survey).” It shows the same area, but with a much larger flood extent displayed in purple shading. The updated flood covers wider areas on both sides of the watercourse, extending into residential neighbourhoods and around the Bedford Place Mall. A darker outlined channel indicates the main flow path.
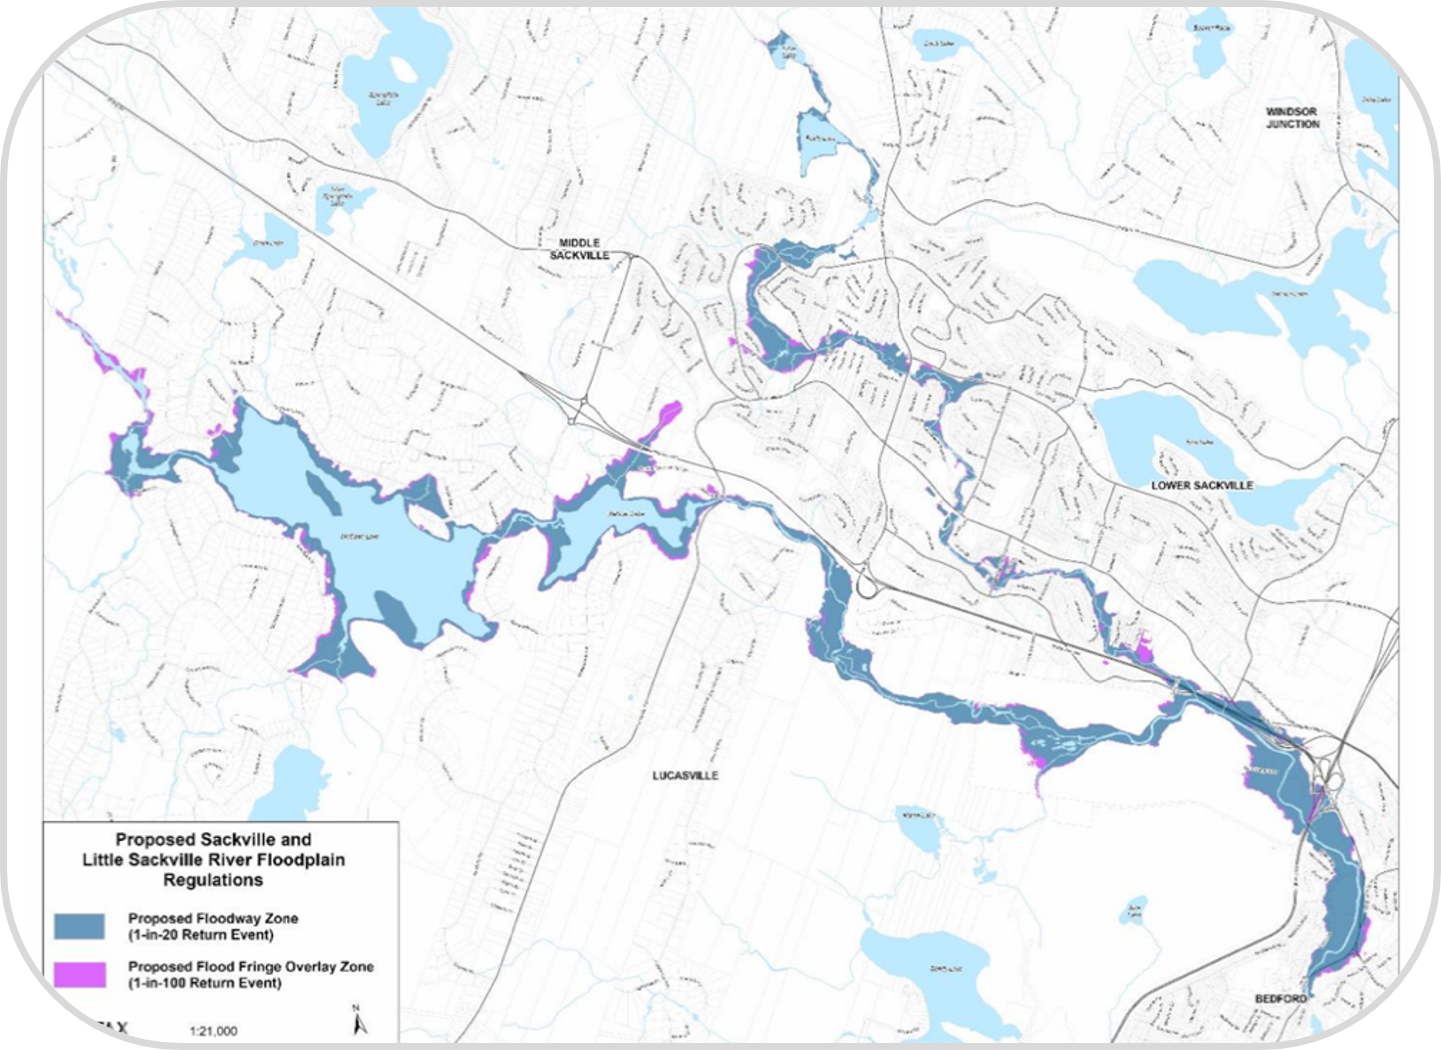
Figure 21: The proposed Sackville and Little Sackville River Floodplain Regulations shown to residents (HRM, 2024).
Text version
A floodplain regulation map showing proposed flood hazard zones for the Sackville River and Little Sackville River area. The map is oriented with a north arrow at the bottom of the legend.
The map shows streets, neighbourhood names and the hydrographic network in urban and suburban areas. Place names visible include Middle Sackville, Lower Sackville, Lucasville, Windsor Junction, and Bedford. Roads and residential areas are shown in light grey, while water bodies such as rivers and lakes are shown in light blue.
Two flood hazard overlays are displayed along the river corridors. The Proposed Floodway Zone (1-in-20 return event) is shown in dark blue and follows the main river channels closely. Surrounding this area, the Proposed Flood Fringe Overlay Zone (1-in-100 return event) is shown in purple, extending farther into adjacent neighbourhoods and low-lying areas.
A legend in the lower left corner identifies the two proposed flood zones by colour and return period.
7.6 Case Study: EPCOR’s Stormwater Integrated Resource Plan
Edmontonians Help Prioritize Flood Mitigation Efforts
EPCOR is a municipally owned utility corporation based in Alberta that provides water and energy services to the City of Edmonton. In 2017, EPCOR took responsibility for the City of Edmonton’s wastewater and stormwater management services (Rawluk & Méthot, 2024), putting management of the entire water cycle into EPCOR’s oversight (Clean50, 2026).
Due to increases in extreme weather and the subsequent increases in flood risk, EPCOR set out to work with residents, businesses, industry, and the City of Edmonton to develop a Stormwater Integrated Resource Plan (SIRP). The goals of the plan (Ancel, 2021) were to:
- Identify areas of Edmonton that have the highest risk of impact from stormwater flooding.
- Develop drainage infrastructure and programs to effectively address those risks.
- Educate homeowners on the actions they can take to reduce their risks.
See Table 12 for case study characteristics.
Table 12: Case Study Characteristics of EPCOR’s Stormwater Integrated Resource Plan
| EPCOR’S STORMWATER INTEGRATED RESOURCE PLAN | |
|---|---|
| Scale |
|
| Flood Hazard |
|
| Levels of Community Engagement |
|
| Flood Mapping Components |
|
| Actors |
|
| People Engaged |
|
Engagement
In 2018, EPCOR conducted a city-wide survey to consult citizens on their priorities and incorporate the public’s input into the risk ranking framework across the four categories of Health and Safety, Environment, Social Impacts, and Financial (EPCOR, 2018). The survey was an online public opinion survey that used statistically reliable sampling methods to assess and validate public preferences for mitigation and determine what infrastructure the public cares most about protecting from flood impacts (EPCOR, 2018).
As of August 2018, 1,500 Edmontonians had completed the survey (Ancel, 2021). Survey results showed that the greatest priority to residents was protecting against health and safety impacts (30%) and social impacts (30%) of flooding. Financial (25%) and environmental (15%) impacts were ranked as less important, and impacts that were reversible, temporary, or insurable were of lower relative importance (EPCOR, n.d.).
The survey results were used to help identify priority sub-basins for flood mitigation efforts. Based on Edmontonians’ priorities as identified through the survey, higher-risk areas were targeted by the plan for protection (EPCOR, n.d.):
- Hospitals and urgent care facilities, and essential services such as fire, police, emergency services and utilities
- Human life and agencies that provide support for vulnerable populations
- Health and safety and social impacts from flooding for the city overall
In developing the plan, EPCOR used existing engineering studies, stormwater and climate models, flood maps available from the insurance sector, and historical flooding and maintenance records to identify current risk exposure rankings of approximately 1,300 stormwater sub-basins (EPCOR, 2018). Risk rankings (Figure 22, Figure 23) took into consideration the impacts to the community (“No Impact, Negligible, Minor, Moderate, Major, and Extreme”) for five storm scenarios (1:20, 1:50, 1:75, 1:100, and 1:200) and four aspects of risk (“Health and Safety, Environment, Social Impact, and Financial”) (EPCOR, 2019).
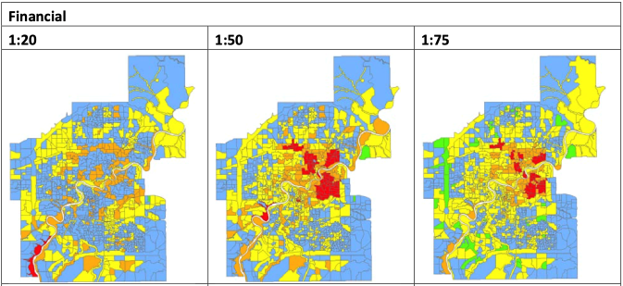
Figure 22: A risk analysis of the sub-basins was completed by identifying the risk exposure for the four risk categories—Health and Safety, Environment, Social, and Financial—in each of the five storm scenarios (1:20, 1:50, 1:75, 1:100 and 1:200). The results were then mapped. The risk exposure for a sub-basin reflects the potential for this risk level to be present within the sub-basin boundary; it does not mean that every property is exposed to the same level of risk within the sub-basin. Above are the maps created for the Financial risk category in the 1:20, 1:50, and 1:75 storm scenarios (EPCOR, 2018). Risk Exposure Levels: Red = High Risk, Orange = Medium High Risk, Yellow = Medium Risk. Green = Medium Low Risk. Blue = Low Risk
Text version
Three side-by-side maps under the heading “Financial,” comparing financial risk exposure levels for the same urban area using three storm scenarios: 1:20, 1:50, and 1:75.
Each map displays the city divided into small parcels, colour-coded by risk exposure levels. The colour scale is as follows: Red indicates High Risk, Orange indicates Medium High Risk, Yellow indicates Medium Risk, Green indicates Medium Low Risk, and Blue indicates Low Risk.
In the 1:20 map (left), most areas are shown in blue and yellow, with limited orange and red concentrated near central corridors.
In the 1:50 map (centre), red and orange areas increases significantly, forming larger clusters in the central and adjacent neighbourhoods.
In the 1:75 map (right), colours are more dispersed, with a mix of yellow, green, and orange areas and fewer continuous red clusters.
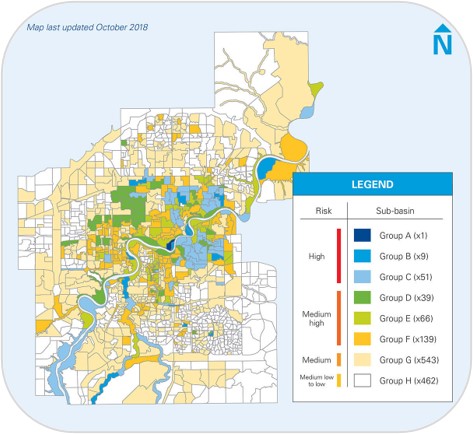
Figure 23: Priority sub-basins were identified for each risk category based on risk exposure to critical infrastructure. Results were combined into the above risk scenario map. The risk scenario map shows the prioritization of stormwater sub-basins weighted based on the results of the public opinion survey (30% Health and Safety, 30% Social, 25% Financial, and 15% Environment). Focused flood mitigation initiatives have been identified for sub-basins in Group A to Group E. Flood mitigation opportunities for sub-basins in Group F to Group H will align with other planned construction activities (EPCOR, 2018).
Text version
A thematic map of an urban area, illustrating risk levels by sub-watershed. A note in the upper left-hand corner reads “Map last updated in October 2018.” A north arrow appears in the upper right.
The legend divides the areas of the territory into eight groups of sub-watersheds, identified by different colours and associated with varying levels of risk.
Sub-basin A is shown in dark blue and has one zone. Sub-basin B is shown in blue and has nine zones. Sub-basin C is shown in light blue and contains 51 zones. Sub-pools A, B and C are associated with the high-risk category.
Sub-basin D is shown in dark green and has 39 zones. Sub-basin E is shown in light green and has 66 zones. Sub-basin F is shown in orange and has 139 areas. Sub-basins D, E and F are associated with the medium-high-risk category.
Sub-basin D is shown in dark green and has 39 zones. Sub-basin E is shown in light green and has 66 zones. Sub-basin F is shown in orange and has 139 areas. Sub-basins D, E and F are associated with the high-risk category.
Sub-basin G is shown in beige, has 543 areas and is associated with the medium-risk category.
Sub-basin H is shown in white and has 462 areas and is associated with the medium, low to low-risk category.
The map includes the rivers and channels that cross the region and the surrounding neighbourhoods. The higher-risk areas seem to be more concentrated around the water system, while the lower-risk categories cover most of the mapped area. Large portions of the territory are shaded in beige and several areas are white. Groupings of yellow, light green, light blue and dark blue areas appear especially near the central river. The darkest and most contrasting colours are concentrated near the banks and some bodies of water.
Outcome
In 2019, EPCOR released its SIRP, a 20-year, $1.6-billion plan that aimed to mitigate flood risk from health and safety, environmental, social, and financial perspectives. Primary flood drivers addressed by the SIRP include topographical low points and storm patterns. The SIRP attempts to reduce flood impacts from these drivers by strategically implementing a combination of green and grey infrastructure, low-impact development, and operational programs. The plan includes five themes to reduce flooding in Edmonton neighbourhoods.
Edmonton’s Stormwater Integrated Resource Plan
Five themes to reduce flooding in Edmonton neighbourhoods:
- Slow – We slow the entry of stormwater into the drainage network by absorbing it in green infrastructure and holding it in ponds, creating space in the collection system during storm events.
- Move – We move excess water safely away from areas at risk, quickly and efficiently, by increasing capacity in the drainage system to handle peak water flow.
- Secure – We help secure individual properties in higher-risk areas against sewer backups, overland flooding, and river flooding.
- Predict – We predict and manage the movement of stormwater through smart sensors and technologies that integrate into the collection system.
- Respond – We respond through the fast rollout of flood barriers, traffic diversions, and public communications to protect life, safety, and property.
The SIRP is a dynamic plan that will adapt over time as new information is collected and the public’s needs change. In 2021, EPCOR received the Clean50 – Top Project award for its SIRP, recognizing the community flood project program as innovative and cost-effective. The plan is an integrated approach to flood resilience that combines municipal infrastructure, engineering, and community values with transparent program development and delivery.
Additional Resources
Learn more about the City of Edmonton’s award-winning Stormwater Integrated Resource Plan.
7.7 Case Study: Flood Resilience Challenge
Preparing for Floods Through a Serious Role-Playing Game
The Flood Resilience Challenge (FRC) is a serious role-playing game. Developed as an educational and engagement tool, it aims to increase flood literacy, foster social learning, and create a safe space to explore risk management and communication strategies.
The FRC game employs an interactive, experiential learning approach where participants assume roles of diverse actors—such as government officials, scientists, insurers, developers, and media representatives—to collaboratively address flood risk scenarios.
The game unfolds over two to three rounds, each including four phases:
- Phase 1 — Choose Flood Risk Measures: Players plan for different types of flooding and interact to decide which flood risk management measures to employ.
- Phase 2 — Check for Flood Event: There is a flooding event (six types to choose from), and players re-evaluate their past decisions and make future flood management plans.
- Phase 3 — Update Budget: Players calculate their losses and gains following the flooding event and prepare a new budget for the next round.
- Phase 4 — Vote: Players take a vote of confidence for the mayor, premier, and prime minister based on their interactions with the politicians and their opinions on the outcomes of the round.
At the end, players debrief about their strategies and experiences, providing further opportunities for learning. See Table 13 for case study characteristics.
Table 13: Case Study Characteristics of Flood Resilience Challenge
| FLOOD RESILIENCE CHALLENGE | |
|---|---|
| Scale |
|
| Flood Hazard |
|
| Levels of Community Engagement |
|
| Flood Mapping Components |
|
| Actors |
May include:
|
| People Engaged |
May include:
|
Engagement
In the flood mapping process, the FRC game can be used as a way of deepening participants’ understanding of flood-related issues to elicit more nuanced input and strengthen collective decision-making. The FRC game is often played using the fictional town of “Hydrason” that allows participants to explore complex socioenvironmental problems and diverse perspectives in a low-pressure environment (Figure 24). The game can be played as an opening activity prior to a focus group, workshop, or meeting to build participants’ flood literacy, foster trust, and encourage participant interaction. The game can also be played online (Figure 25).
Alternatively, the game can be used as an engagement activity using real maps and tailored questions to consult, involve, collaborate and/or empower participants to provide input, co-develop solutions, and lead decision-making for the purposes of priority setting, data collection, communication of information, hazard identification, and the identification of flood mitigation strategies.
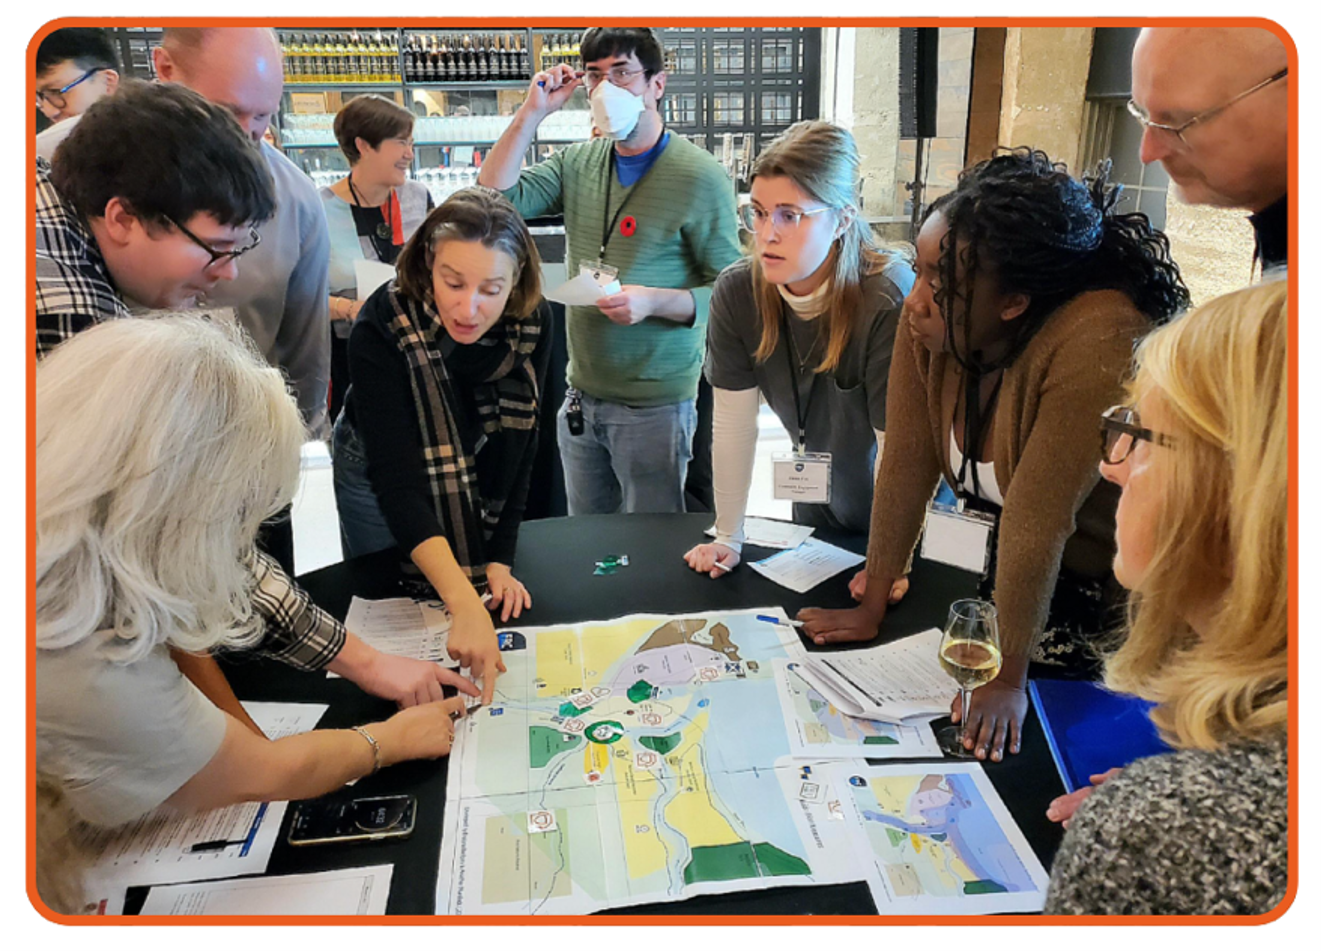
Figure 24: Community leaders and local business owners play the FRC game in Cambridge, ON, engaging in dialogue and learning about flood risk mitigation solutions in the lead up to the 50-year anniversary of the Great Flood of’74 (Flood Resilience Challenge Team & P4A, 2024).
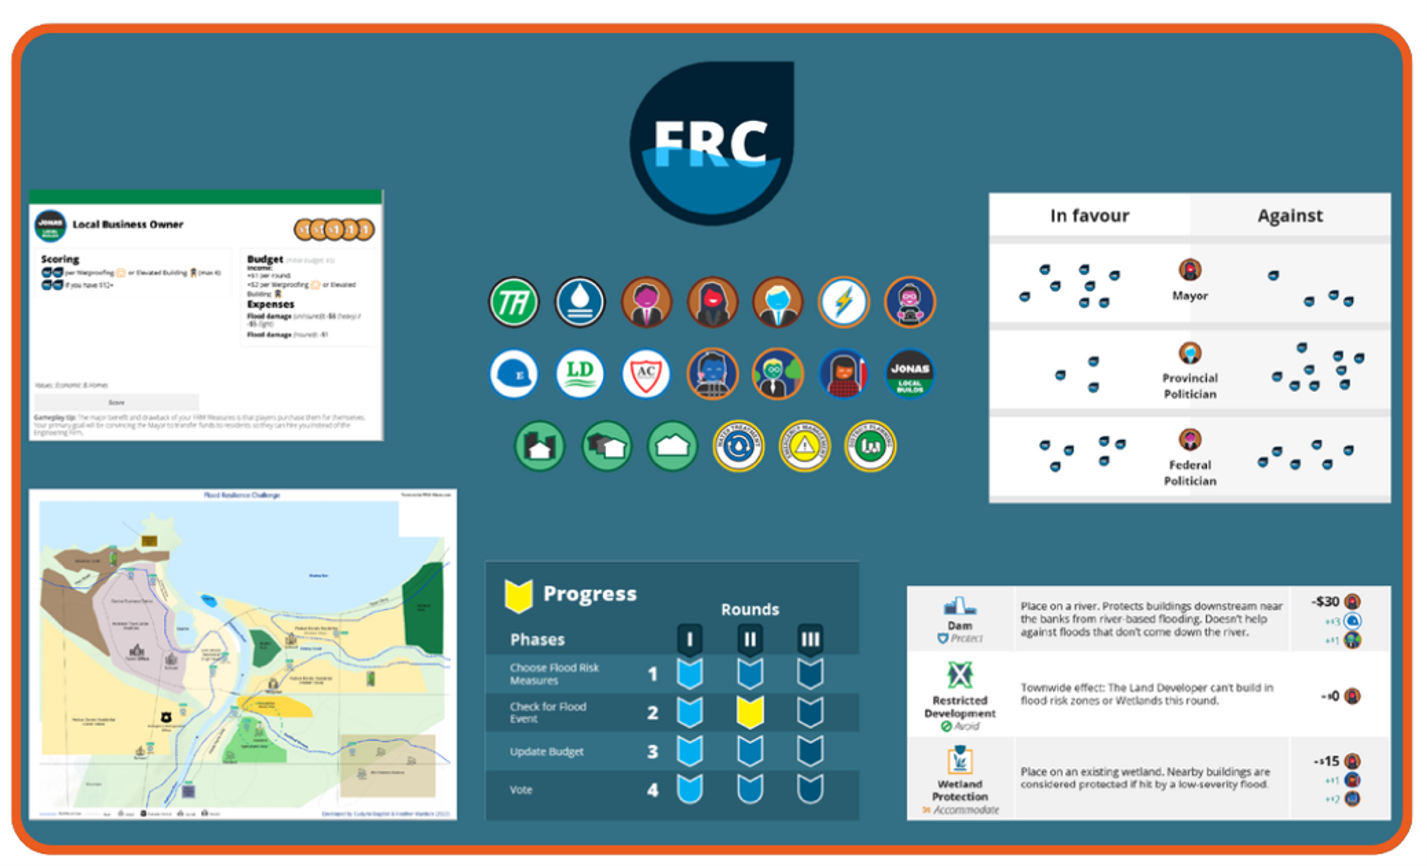
Figure 25: The FRC game can be facilitated as an in-person or online activity (FRC Game, 2023).
Text version
A screen-style composite graphic showing elements of a digital decision-making tool. The layout is framed with multiple panels arranged around a central title.
At the top centre is a circular logo labelled “FRC.” Beneath the logo is a row of round icons representing different roles, assets, or system components, such as infrastructure, buildings, services, and emergency or environmental elements. Each icon is colour-coded and visually distinct.
In the centre bottom, a “Progress” panel shows four project phases and three rounds. The progress phases listed include choosing flood risk measures, checking for flood events, updating the budget, and voting. Progress indicators show which rounds and phases have been completed. The other four elements of the graphic represent the four phases of progress.
On the left side, a panel titled “Local Business Owner” addresses flood risk measures, displaying budget and scoring information, including costs, expenses, and flood damage values. The panel resembles a dashboard with text, icons, and numerical indicators.
At the bottom left, a local-area map panel shows rivers, roads, and surrounding land uses.
At the bottom right, a budget option panel lists flood mitigation measures, such as dam protection, restricted development, and wetland protection. Each option includes a short description and associated cost or benefit values indicated with plus or minus symbols.
On the right side, a vote table labelled “In favour / Against” compares vote responses from different decision-makers, such as municipal, provincial, and federal levels, using grouped dots to indicate relative positions.
Impacts and Outcomes
By simulating real-world scenarios, the FRC game helps communities to proactively engage and think critically about flood resilience planning while fostering a culture of preparedness and collaboration. Since its inception, the FRC game has been played across Canada and internationally, engaging over 700 participants from various sectors, including government, academia, NGOs, and the private sector. The game has also been incorporated into academic curricula, such as a third-year engineering course at the University of Waterloo, enhancing students’ engagement and understanding of complex socioenvironmental issues.
The FRC game has been proven successful in increasing understanding of flooding issues and facilitating discussion. Participants from regional governments have noted that the game parallels the challenges that public officials are confronted with, such as balancing interests and navigating broader flood risk management priorities.
Additional Resources
Learn more about the Flood Resilience Challenge Game (FRC Game, 2023) and explore The Flood Resilience Challenge Cambridge (Flood Resilience Challenge Team & Partners for Action, 2024) to see how the serious role-playing game is being used to foster dialogue and collaboration within communities.
Request an in-person or online workshop through CIFAL York University (n.d.).
References
Ancel, S. (2021, July 16). Stormwater integrated resource planning (SIRP). [ICLR Friday Forum Presentation]. https://www.iclr.org/wp-content/uploads/2021/07/ICLR-EPCOR-SIRP-July-2021.pdf
Applied Geomatics Research Group. (2017). Maritime coastal flood risk map. Nova Scotia Community College. https://agrgims.cogs.nscc.ca/CoastalFlooding/Map/
Armitage, D., Berkes, F., Dale, A., Kocho-Schellenberg, E., & Patton, E. (2011). Co-management and the co-production of knowledge: Learning to adapt in Canada's Arctic. Global Environmental Change, 21(3), 955-1004. https://doi.org/10.1016/j.gloenvcha.2011.04.006
Assembly of First Nations. (2025). Environmental protection and climate action. https://afn.ca/environment/environmental-protection-climate-action/
Aslin, H.J., & Brown, V.A. (2004). Towards whole of community engagement: A practical toolkit. Murray-Darling Basin Commission. http://hdl.handle.net/1885/77450
Aurora Research Institute. (2021). A GIS to support community monitoring of the effects of climate change in Tuktoyaktuk. https://nwtresearch.com/gis-support-community-monitoring-effects-climate-change-tuktoyaktuk
Belotti, G., Pustova, M., & Parent, M. (2022, August). Virtual community engagement on climate change adaptation. UBC Sustainability Scholars. https://sustain.ubc.ca/sites/default/files/2022-002_Virtual%20Community%20Engagement%20on%20Climate_Belotti_Pustova_Parent%20v2.pdf
Bogdan, E.A., Roszko, A.M., Beckie, M.A., & Conway, A. (2021). We’re ready! Effectiveness of community disaster preparedness workshops across different community groups in Alberta, Canada. International Journal of Disaster Risk Reduction (55), 102060. https://doi.org/10.1016/j.ijdrr.2021.102060
Bogdan, E., & Cottar, S. (2022). A serious role-playing game as a pedagogical innovation to strengthen flood resilience. IEEE Society and Technology Magazine. https://doi.org/10.1109/MTS.2022.3197124
Campaign for Trauma-Informed Policy and Practice. (n.d.). Resource center. https://www.ctipp.org/resource-center
Canadian Climate Institute. (n.d.). Turning the tide: How flood risk transparency can drive equitable outcomes in Canada. https://climateinstitute.ca/wp-content/uploads/2024/01/Turning-the-tide.pdf
Canadian Climate Institute. (2024, September 4). Fact sheet: Climate change and flooding. Canadian Climate Institute. https://climateinstitute.ca/news/fact-sheet-climate-change-and-flooding/
Carmen, E., Fazey, I., Ross, H., Bedinger, M., Smith, F. M., Prager, K., McClymont, K., & Morrison, D. (2022). Building community resilience in a context of climate change: The role of social capital. Ambio, 51(6), 1371-1387. https://doi.org/10.1007/s13280-021-01678-9
CBCL Limited Consulting Engineers. (2017). Sackville rivers flood plain study – phase II. https://www.halifax.ca/media/61276
Centre for Indigenous Environmental Resources. (n.d.). Land is memory. Water is sacred. All living things are connected [Website home page]. https://yourcier.org
Chatham House. (n.d.). Chatham House Rule. https://www.chathamhouse.org/about-us/chatham-house-rule
CIFAL York. (n.d.). Flood Resilience Challenge (FRC) serious game. York University. https://www.yorku.ca/cifal/flood-resilience-challenge-frc-serious-game/
CityHive. (2022, August). Youth Adaptation Lab: Accelerating coastal adaptation planning with youth in False Creek. https://vancouver.ca/files/cov/sea2city-youth-adaptation-lab-summary-report.pdf/
City of Vancouver. (n.d.). Coastal adaptation map atlas False Creek. https://ehq-production-canada.s3.ca-central-1.amazonaws.com/dda025212840547f660cbead707dc39bd700b57e/original/1622154366/829f712ad8600
b4b08c6cf91d5a26c26_Sea2City_False_Creek_Map_Atlas_large_20210223.pdf
City of Vancouver. (2018). Coastal adaptation plan: Fraser River foreshore. https://vancouver.ca/files/cov/coastal-adaptation-plan-final-report.pdf
City of Vancouver. (2020). False Creek coastal adaptation plan. Shape Your City. https://www.shapeyourcity.ca/sea2city
City of Vancouver. (2021a, February). Coastal adaptation: False Creek. https://syc.vancouver.ca/projects/false-creek-coastal-adaptation-plan/final-report.pdf
City of Vancouver. (2021b, August). Coastal adaptation: Values-based planning primer. https://vancouver.ca/files/cov/sea2city-primer.pdf
City of Vancouver. (2022, November). Sea2City design challenge: Project report. https://vancouver.ca/files/cov/sea2city-design-challenge-project-report.pdf
City of Vancouver. (2024). Climate change adaptation strategy: 2024–2025 update and action plan. https://vancouver.ca/files/cov/vancouver-climate-change-adaptation-strategy-2024-25.pdf
City of Vancouver. (2025). Adapting to sea level rise. https://vancouver.ca/green-vancouver/sea-level-rise.aspx
Clean50. (2026). SIRP – Edmonton's stormwater integrated resource plan: EPCOR. https://clean50.com/projects/sirp-edmontons-stormwater-integrated-resource-plan-epcor/
Climate Atlas of Canada. (2024). Indigenous knowledges. https://climateatlas.ca/indigenous
Climigration Network. (2021). Lead with listening: A guidebook for community conversations on climate migration. https://www.climigration.org/guidebook
Cone, J., Rowe, S., Borberg, J., Stancioff, E., Doore, B., & Grant, K. (2013). Reframing engagement methods for climate change adaptation. Coastal Management 41, 345-360. https://doi.org/10.1080/08920753.2013.803926
Cooke Insurance Group. (2017). Government of Canada reintroduces floodplain maps. https://cooke.ca/government-canada-reintroduces-floodplain-maps/
Darlington, C., Raikes, J., Henstra, D., Thistlethwaite, J., & Raven, E. K. (2024). Mapping current and future flood exposure using a 5 m flood model and climate change projections. Natural Hazards and Earth System Sciences, 24(2), 699-714. https://doi.org/10.5194/nhess-24-699-2024
DesignPoint Engineering and Survey. (2024). Sackville rivers floodplain model updates – structure investigation and survey and updated mapping. https://www.halifax.ca/media/87444
Duffy, N. (2011). Engagement or education? Australian Journal of Emergency Management, 26(3), 35-39. https://knowledge.aidr.org.au/media/2705/ajem-26-03-08.pdf
Dulic, A., Schroth, O., Shirley, M., & Sheppard, S. (2011). Future Delta motivating climate change action grounded in place [Conference paper]. In J.C. Anacleto, S. Fels, N. Graham, B. Kapralos, M.S. El-Nasr, & K. Stanley (Eds.), Entertainment computing: ICEC 2011 lecture notes in computer science (Vol. 6972). Springer. https://doi.org/10.1007/978-3-642-24500-8_24
Environment and Climate Change Canada (ECCC). (2013, July 22). Causes of flooding. https://www.canada.ca/en/environment-climate-change/services/water-overview/quantity/causes-of-flooding.html#icejams
Environment and Climate Change Canada (ECCC). (2023). Canada’s National Adaptation Strategy. Government of Canada. https://www.canada.ca/en/services/environment/weather/climatechange/climate-plan/national-adaptation-strategy/full-strategy.html
EPCOR. (n.d.). Our awards and recognition. https://www.epcor.com/ca/en/about/our-company/awards.html
EPCOR. (2018, October). Stormwater integrated resource plan (SIRP) – Finalizing the risk framework. https://www.epcor.com/content/dam/epcor/documents/construction-projects/flood-mitigation/2018-10_stormwater-integrated-resource-plan_utility-committee-report.pdf
EPCOR. (2019). Stormwater integrated resource plan (SIRP) – Capital and operational plan alternatives. https://www.epcor.com/content/dam/epcor/documents/construction-projects/flood-mitigation/2019_stormwater-integrated-resource-plan_utility-committee-report.pdf
Fang, C., Hench, J., Daniels, C., & Walton, A.A. (2022). Centering equity in climate resilience planning and action: A practitioner’s guide. Climate-Smart Communities Series, Vol. 3. Antioch University. https://doi.org/10.25923/765q-zp33
Federal Emergency Management Agency. (2021). FEMA flood risk communication toolkit for community officials: Communication plan guide. https://www.fema.gov/sites/default/files/documents/fema_cx-toolkit-communications-plan-guide.pdf
First Nations Information Governance Centre. (2025). The First Nations principles of OCAP®. https://fnigc.ca/ocap-training/
FRC Game. (2023). Play your way to preparedness: Welcome to the Flood Resilience Challenge game. https://www.frcgame.com/
Flood Resilience Challenge Team & Partners for Action. (2024, May 2). The Flood Resilience Challenge Cambridge. https://arcg.is/1y9Sm4
Fraser Basin Council. (2026). BC floodplain mapping. https://www.fraserbasin.bc.ca/bc-wide-work/watersheds-water-resources/bc-floodplain-mapping/
Geekiyanage, D., Fernando, T., & Keraminiyage, K. (2021). Mapping participatory methods in the urban development process: A systematic review and case-based evidence analysis. Sustainability, 13(16), 8992. https://doi.org/10.3390/su13168992
Gonzalez, R. (2019). The Spectrum of Community Engagement to Ownership. Movement Strategy Center. https://movementstrategy.org/resources/the-spectrum-of-community-engagement-to-ownership/
Government of British Columbia. (2023, April 21). Better flood preparation will help protect B.C. communities. BC Gov News. https://news.gov.bc.ca/releases/2023FOR0020-000569
Government of Canada. (2022, March 28). Guide on equity, diversity and inclusion terminology. https://www.noslangues-ourlanguages.gc.ca/en/publications/equite-diversite-inclusion-equity-diversity-inclusion-eng - lettre-letter-E
Government of Yukon. (2024a). Southern Lakes flood hazard mapping public engagement: What we heard. https://yukon.ca/sites/default/files/env/1._what_we_heard_report_-_southern_lakes_-_flood_hazard_mapping.pdf
Government of Yukon. (2024b). Southern Lakes flood hazard mapping. https://map-data.service.yukon.ca/WRB_Flood_Maps/Southern_Lakes/20241004-Southern_Lakes-Plain_language_summary.pdf
Government of Yukon. (2024c, May 1). Southern Lakes flood mapping study: Final report. https://map-data.service.yukon.ca/WRB_Flood_Maps/Southern_Lakes/Final%20RPT%20-%20Southern%20Lakes%20Flood%20Mapping%20Study.pdf
Hafferty, C., Pool, U., & Obani, P. (2024, May 7). Should we stop using the word “stakeholder” in research? Impact of Social Sciences. https://blogs.lse.ac.uk/impactofsocialsciences/2024/05/07/should-we-stop-using-the-word-stakeholder-in-research/
Haida Nation v. British Columbia, 2004 SCC 73. https://decisions.scc-csc.ca/scc-csc/scc-csc/en/item/2189/index.do
Halifax Regional Municipality (HRM). (2022). Public engagement guidebook. https://cdn.halifax.ca/sites/default/files/documents/business/planning-development/cc_planninganddevelopment_publicengagementguidebook_8.5x11-web-fillable.pdf
Halifax Regional Municipality (HRM). (2024). Sackville rivers floodplain proposed development, regulations, case 21402. https://cdn.halifax.ca/sites/default/files/documents/business/planning-development/applications/sackville-floodlines-pim-pres-23-aug-2024-hl.pdf
Halifax Regional Municipality. (HRM). (2025). Personal communications from HRM planning staff, June 6, 2025.
Henstra, D., Minano, A., & Thistlethwaite, J. (2019). Communicating disaster risk? An evaluation of the availability and quality of flood maps. Natural Hazards and Earth System Sciences, 19(1), 313–323. https://doi.org/10.5194/nhess-19-313-2019
Henstra, D., & Thistlethwaite, J. (2018). Flood risk mapping in Canada: Moving forward on a national priority. International Governance Innovation. https://www.jstor.org/stable/resrep24942
Howard, S. C., & Sherren, K. (2023). Flood risk mapping in southwestern Nova Scotia: Perceptions and concerns. Canadian Geographies / Géographies Canadiennes, 67(4), 499–512. https://doi.org/10.1111/cag.12836
Huynh, T., & Lueck, V. (2025, February 14). Mapping the future of flood resilience: A participatory guide for strengthening flood governance in B.C. Pacific Institute for Climate Solutions. https://pics.uvic.ca/explainers/mapping-the-future-of-flood-resilience/?utm_source=linkedin&utm_medium=social&utm_campaign=hootsuite
ICLEI Canada. (2025). Climate communications playbook: Behavioural strategies for community action. https://icleicanada.org/project/climate-communications-playbook/
Indigenous Climate Action. (n.d.). Climate justice. Indigenous led. https://www.indigenousclimateaction.com/
Indigenous Climate Hub. (2025). Climate change adaptation. https://indigenousclimatehub.ca/
Indigenous Climate Hub. (2026). The effects of climate change on landscapes. https://indigenousclimatehub.ca/effect-of-climate-change-on-landscapes/
Indigenous Corporate Training. (2025). What you need to know about the duty to consult in Canada. https://www.ictinc.ca/blog/aboriginal-rights-title-and-the-duty-to-consult-a-primer
Institute for Catastrophic Loss Reduction. (2021, April 16). Focus on types of flooding. https://www.iclr.org/wp-content/uploads/2021/04/ICLR_Flooding_2021.pdf
International Association for Public Participation (IAP2). (2024). IAP2 spectrum of public participation. https://cdn.ymaws.com/www.iap2.org/resource/resmgr/pillars/iap2_spectrum_2024.pdf
International Institute for Environment and Development. (2009, December 1). Participatory learning and action: Community-based adaptation to climate change. https://www.researchgate.net/publication/40644750_Community-Based_Adaptation_to_Climate_Change
Inuit Tapiriit Kanatami. (2026). https://itk.ca/
Karunamuni, N., Imayama, I., & Goonetilleke, D. (2020). Pathways to well-being: Untangling the causal relationships among biopsychosocial variables. Social Science & Medicine, 272. https://doi.org/10.1016/j.socscimed.2020.112846
Katz, J. E. (2017). Mobile communication: Dimensions of social policy. Routledge.
Khoury, M., Gibson, M., Savic, D., Chen, A.S., Vamvakeridou-Lyroudia, L., Langford, H., & Wigley, S. (2018). A serious game designed to explore and understand the complexities of flood mitigation options in urban-rural catchments. Water, 10(12), 1885. https://doi.org/10.3390/w10121885
Living with Water Project. (n.d.). https://www.livingwithwater.ca/
Lueck, V., Milne, C., Huynh, T., Watterodt, F., & Rees, A. (2024). Flood governance mapping report: Participatory timeline mapping guide. Living with Water Project. https://static1.squarespace.com/static/624b1c21ed90eb4638eb3dcf/t/672d0933a68d0c2eef716771/1731004732857/Digital+-+Gov.+Mapping+Report+BC.pdf
Lyle, T. S., Fang, L. L., & Hund, S. V. (2024). Implications of disclosure and non-disclosure of flood hazard maps — a synthesis for the Canadian context. Canadian Water Resources Journal / Revue Canadienne Des Ressources Hydriques, 49(3), 282–299. https://doi.org/10.1080/07011784.2023.2287462
Marris, W., & Braden, L. (2023, January 22). Guide: Trauma-informed meetings, discussions, & conversations. Campaign for Trauma-informed Policy and Practice. https://www.ctipp.org/post/guide-to-trauma-informed-meetings-discussions-conversations
Métis National Council. (2025). Climate change. https://www.metisnation.ca/what-we-do/environment/climate-change
Meyer, V., Kuhlicke, C., Luther, J., Fuchs, S., Priest, S., Dorner, W., Serrhini, K., Pardoe, J., McCarthy, S., Seidel, J.S., Palka, G., Unnerstall, H., Viavattene, C., & Scheuer, S. (2012). Recommendations for the user-specific enhancement of flood maps. Natural Hazards and Earth Systems Sciences, 12(1), 1701-1716. https://doi.org/10.5194/nhess-12-1701-2012
Minano, A., Johnson, P. A., & Wandel, J. (2017). Visualizing flood risk, enabling participation and supporting climate change adaptation using the Geoweb: The case of coastal communities in Nova Scotia, Canada. GeoJournal, 83(3), 413–425. https://doi.org/10.1007/s10708-017-9777-8
Minano, A., & Peddle, S. (2018). Using flood maps for community flood risk communication. Partners for Action, University of Waterloo. https://uwaterloo.ca/partners-for-action/sites/default/files/uploads/files/using_flood_maps_for_community_flood_risk_communication_24jan18_fnl_3.pdf.
Minano, A., Thistlethwaite, J., Henstra, D., & Scott, D. (2021). Governance of flood risk data: A comparative analysis of government and insurance geospatial data for identifying properties at risk of flood. Computers, Environment and Urban Systems, 88, 101636. https://doi.org/10.1016/j.compenvurbsys.2021.101636
Minow, M. (2021). Equality vs. equity. American Journal of Law and Equality, 1(1), 167–193. https://doi.org/10.1162/ajle_a_00019
Mirza, R., Vodden, K., & Collins, G. (2012). Developing innovative approaches for community engagement. Memorial University. https://ruralresilience.ca/wp-content/uploads/2012/07/Community-Engagement-Project-Report-GC-Final-April-13b.pdf
Mithūn, One Architecture, Modern Formline, Herrera, and Moffatt & Nichol. (2022, December). Sea2City design challenge: South False Creek coastal adaptation design report. https://vancouver.ca/files/cov/sea2city-south-false-creek-concepts-report.pdf
Mohanty, M.P., & Simonovic, S.P. (2021). Changes in floodplain regimes over Canada due to climate change impacts: Observations from CMIP6 models. Science of the Total Environment, 792, 148323. https://doi.org/10.1016/j.scitotenv.2021.148323
Morris J. Wosk Centre for Dialogue. (2019). Public engagement toolkit. Simon Fraser University. https://www.sfu.ca/content/dam/sfu/dialogue/ImagesAndFiles/SharedLearni…
Murray, W. (2019, September 20). ‘Beyond what our instruments can tell us’: Merging Indigenous knowledge and western science at the edge of the world. The Narwhal. https://thenarwhal.ca/beyond-instruments-can-tell-us-merging-indigenous-knowledge-western-science-end-world/
National Research Council (NRC). (2012). Dam and levee safety and community resilience: A vision for future practice. The National Academies Press. https://doi.org/10.17226/13393
Natural Resources Canada (NRCan). (2021). Federal flood damage estimation guidelines for buildings and infrastructure. https://natural-resources.canada.ca/science-data/science-research/flood-mapping/federal-flood-damage-estimation-guidelines-buildings-infrastructure
Natural Resources Canada (NRCan). (2024). Indigenous engagement guidelines for flood mapping. https://natural-resources.canada.ca/science-data/science-research/natural-hazards/flood-mapping/indigenous-engagement-guidelines-flood-mapping
Natural Resources Canada. (2025, March 21). Flood Hazard Identification and Mapping Program. https://natural-resources.canada.ca/science-data/science-research/natural-hazards/flood-mapping/flood-hazard-identification-mapping-program
Natural Resources Canada (NRCan). (2026a). Federal flood mapping guidelines. https://natural-resources.canada.ca/science-data/science-research/natural-hazards/federal-flood-mapping-guidelines
Natural Resources Canada (NRCan). (2026b). Flood mapping roles and resources. https://natural-resources.canada.ca/science-data/science-research/natural-hazards/flood-mapping/flood-mapping-roles-resources
Natural Resources Canada (NRCan). (2026c). Flood mapping types and process. https://natural-resources.canada.ca/science-data/science-research/flood-mapping/flood-mapping-types-process
Natural Resources Canada (NRCan) & Public Safety Canada. (2019). Federal geomatics guidelines for flood mapping. https://doi.org/10.4095/299810
Northwest Hydraulic Consultants. (2023). Personal communications to Fraser Basin Council staff [Photograph], October 26, 2023.
Northwest Hydraulic Consultants. (2025). Personal communications to Fraser Basin Council staff, April 23, 2025.
O’Brien, K., & Wolf, J. (2010). A values-based approach to vulnerability and adaptation to climate change. WIRES Climate Change, 1(2), 232-242. https://doi.org/10.1002/wcc.30
Ojala, M. (2023). Hope and climate-change engagement from a psychological perspective. Current Opinion in Psychology, 49, 101514. https://doi.org/10.1016/j.copsyc.2022.101514
Okamoto, T., & Doyon, A. (2024). Equity and justice in urban coastal adaptation planning: New evaluation framework. Buildings and Cities, 5(1), 101-116. https://doi.org/10.5334/bc.377
O’Toole, C. (2023, June 9). Hazard, risk, and vulnerability assessment: Information report. Halifax Regional Municipality. https://cdn.halifax.ca/sites/default/files/documents/city-hall/regional…
Oulahen, G., Mortsch, L., Tang, K., & Harford, D. (2015). Unequal vulnerability to flood hazards: “Ground truthing” a social vulnerability index of five municipalities in Metro Vancouver, Canada. Annals of the Association of American Geographers, 105(3), 473-495. https://doi.org/10.1080/00045608.2015.1012634
Oxford Review. (2024, October 15). Disenfranchised — definition and explanation [Video]. https://oxford-review.com/the-oxford-review-dei-diversity-equity-and-inclusion-dictionary/disenfranchised-definition-and-explanation/
Pacific Institute for Climate Solutions. (2024, June 13). Living with water [Video]. YouTube. https://www.youtube.com/watch?v=366cBSyUQY8
Partners for Action. (2024). Inclusive resilience: A socio-economic vulnerability index (SoVI) to map flood risk for targeted communications and disaster risk reduction. University of Waterloo. https://uwaterloo.ca/inclusive-resilience/sites/default/files/uploads/documents/june-2024_p4a-sovi-report_en_final_.pdf.
Phipps, D. (2022, December 5). Switching from stakeholder. Research Impact Canada. https://researchimpact.ca/featured/switching-from-stakeholder/
Pralle, S. (2019). Drawing lines: FEMA and the politics of mapping flood zones. Climatic Change, 152(2), 227-237. https://doi.org/10.1007/s10584-018-2287-y
Public Safety Canada (PS). (2022). Adapting to rising flood risk: An analysis of insurance solutions for Canada. https://www.publicsafety.gc.ca/cnt/rsrcs/pblctns/dptng-rsng-fld-rsk-2022/index-en.aspx#s0.1
Rawlik, A & Méthot, J. (2024). A scan of natural infrastructure approaches: Bright spots from the City of Nelson, Halifax Regional Municipality, and EPCOR. International Institute of Sustainable Development. https://www.iisd.org/system/files/2024-05/natural-infrastructure-approaches.pdf
Reed, G., Fox, S., Littlechild, D., McGregor, D., Lewis, D., Popp, J., Wray, K., Kassi, N., Ruben, R., Morales, S., & Lonsdale, S. (2024). For our future: Indigenous resilience report. https://changingclimate.ca/indigenous-resilience/
Rees, A., & Doyon, A. (2023). Unsettling NbS: A pathway towards shifting colonial power relations in nature-based solutions research and practice. PLOS Climate, 2(11), e0000307. https://doi.org/10.1371/journal.pclm.0000307
Ryder, S., Walker, C., Batel, S., Devine-Wright, H., Devine-Wright, P., & Sherry-Brennan, F. (2023). Do the ends justify the means? Problematizing social acceptance and instrumentally-driven community engagement in proposed energy projects. Socio-Ecological Practice Research, 5, 189-204. https://doi.org/10.1007/s42532-023-00148-8
Sayers, P., Li, Y., Galloway, G., Penning-Rowsell, E., Shen, F., Wen, K., Chen, Y., & Le Quesne, T. (2013). Flood risk management: A strategic approach. UNESCO. https://unesdoc.unesco.org/ark:/48223/pf0000220870
Shift Collaborative. (2024). Practice guide for advancing climate equity in coastal climate change adaptation. Natural Resources Canada. https://shiftcollaborative.ca/wp-content/uploads/2024/06/PracticeGuide_ClimateEquity.pdf
Social Planning and Research Council of British Columbia (SPARC BC). (2013). Community engagement toolkit. Burnaby, BC. https://cdn2.hubspot.net/hubfs/316071/Tamarack_New_Website/A_CE_toolkit.pdf
Sparling, E., Eyzaguirre, J., & Wale, J. (2024, March). Turning the tide on flood risks: How can governments address the disproportionate impacts of flood risk on equity-deserving people? Canadian Climate Institute. https://climateinstitute.ca/publications/turning-the-tide/
Sufri, S., Dwirahmadi, F., Phung, D., & Rutherford, S. (2020). A systematic review of community engagement (CE) in disaster early warning systems (EWSs). Progress in Disaster Science, 5(1), 100058. https://doi.org/10.1016/j.pdisas.2019.100058
St. Amour Gomes, S., Peddle, S., & Heldsinger, N. (2018). Engaging community members in the floodplain mapping process. Prepared for Natural Resources Canada. Partners for Action, University of Waterloo. https://uwaterloo.ca/partners-for-action/past-projects/communicating-flood-maps
Sy, B., Frischknecht, C., Dao, H., Consuegra, D., & Giuliani, G. (2018). Flood hazard assessment and the role of citizen science. Journal of Flood Risk Management, 12(S2), e12519. https://doi.org/10.1111/jfr3.12519
Tamarack Institute. (2024). 10: A Guide to Advancing Climate Equity Through Place-Based Collaboration. https://www.tamarackcommunity.ca/hubfs/10-A-Guide-for-Advancing-Climate-Equity-Through-Place-Based-Collaboration.pdf?hsLang=en-us
Tamarack Institute. (2026). ABCD in Canada. https://www.tamarackcommunity.ca/skills-for-change/abcd-canada
Terpstra, T. (2011). Emotions, trust, and perceived risk: Affective and cognitive routes to flood preparedness behaviour. Risk Analysis, 31(10), 1658-1675. https://doi.org/10.1111/j.1539-6924.2011.01616.x
Thistlethwaite, J., Henstra, D., Minano, A., & Wilkinson, S. (2017). Engaging Canadians in flood risk management: Lessons from the international community. Centre for International Governance Innovation. https://www.cigionline.org/publications/engaging-canadians-flood-risk-management-lessons-international-community/
Tuktoyaktuk Community Corporation. (2018). Tuktoyaktuk community climate resilience project. https://thescca.ca/wordpress2021/wp-content/uploads/oldsite/images/2018/All_Candidates/Tuktoyaktuk_Community_Climate_Resilience_Project_Final.pdf
Tuktoyaktuk Community Corporation Resilience Project. (2019a, August 26). [Photograph of the point of Tuktoyaktuk]. Facebook. https://www.facebook.com/TCCRPClimateCoordinator/photos/pb.100067798542685.-2207520000/2150916941873901/?type=3
Tuktoyaktuk Community Corporation Resilience Project. (2019b, October 29). [Image of the Climate Monitor Training Workshop recruitment poster]. Facebook. https://www.facebook.com/TCCRPClimateCoordinator/photos/pb.100067798542685.-2207520000/2199893786976216/?type=3
Tuktoyaktuk Community Corporation Resilience Project. (2019c, August 26). [Photograph of permafrost sampling]. Facebook. https://www.facebook.com/TCCRPClimateCoordinator/photos/pb.100067798542685.-2207520000/2150913165207612/?type=3
United Nations Framework on Climate Change. (2025). Introduction: Adaptation and resilience. https://unfccc.int/topics/adaptation-and-resilience/the-big-picture/introduction
Vivo for Healthier Generations. (2025a). Community engagement toolkit. https://www.vivo.ca/wp-content/uploads/2025/06/Attach-2-Community-Engagement-Toolkit-EC2023-1157.pdf
Vivo for Healthier Generations. (2025b). Place matters: A North Calgary project. https://www.vivo.ca/the-collaboratory/place-matters/
Watterodt, F., Mendis-Millard, S., Mohtat, N., & Hill, S. (2025, February). Disaster and disparity: The uneven toll of floods and climate hazards in Canada: Selected insights. Partners for Action. Waterloo, ON: University of Waterloo. https://uwaterloo.ca/partners-for-action/sites/default/files/uploads/documents/feb-2025-p4a-disaster-and-disparity-selected-insights.pdf
Wehn, U., Rusca, M., Evers, J., & Lanfranchi, V. (2015). Participation in flood risk management and the potential of citizen observatories: A governance analysis. Environmental Science & Policy, 48(1), 225-236. https://doi.org/10.1016/j.envsci.2014.12.017
Whalen, D., Martin, J., Lee, R., & Lim, M. (2022). Preliminary geophysical assessment of Tuktuyaaqtuuq Centre for Arts and Culture. Natural Resources Canada & Northumbria University Newcastle.
World Bank. (2018). Social inclusion. https://www.worldbank.org/en/topic/social-inclusion
Wright, J., Bogdan, E., Hamilton, S., Krueger, R., & Andrey, J. (2022). Inclusive resilience: Pathways to building awareness and preparedness among at-risk populations in Canada. Partners for Action, University of Waterloo. https://uwaterloo.ca/inclusive-resilience/sites/default/files/uploads/documents/crc-p4a-finalreport-en.pdf.
Yellowhead Institute. (n.d.). Faculty of Arts, Toronto Metropolitan University. https://yellowheadinstitute.org/
Ziolecki, A., Thistlethwaite, J., Henstra, D., & Scott, D. (2020). Canadian voices on flood risk 2020: Findings from a national survey about how we should manage an increasingly costly and common peril. Partners for Action, University of Waterloo. https://uwaterloo.ca/partners-for-action/sites/default/files/uploads/files/finalreport_nationalsurvey_sept20.pdf
Appendix A: engagement planning worksheet
Sources: Developed by Partners for Action; adapted from SPARC BC, 2013, and FEMA, 2021.