
Volume 1, 2018
Natural Resources Canada, General Information Product 118e.
Natural Resources Canada, Public Safety Canada.
© His Majesty the King in Right of Canada, as represented by the Minister of Natural Resources, 2018
For information regarding reproduction rights, contact Natural Resources Canada at copyright-droitdauteur@nrcan-rncan.gc.ca.
Summary of case studies
As part of the Federal Flood Mapping Guidelines Series, this document aims to advance climate change considerations in floodplain mapping by providing examples of methods used by early adopters. This is an emerging science and due to the complexity of this type of analysis, qualified experts should be consulted when incorporating climate change in flood mapping exercises. The data sources, methods, and conclusions of the case studies serve as examples performed by subject matter experts and are not validated nor endorsed by Natural Resources Canada.
The document is complementary to the Climate Change section in the Federal Hydrologic and Hydraulic Procedures for Flood Hazard Delineation and is not intended to be prescriptive nor provide definitive guidance, but rather outline learning opportunities for flood mapping projects and activities across Canada. The examples are documented as case studies and were selected based on a review of current floodplain mapping methods in communities across Canada, identifying those that actively incorporate climate change and were willing to participate in developing the Guideline Series. This series of case studies will be updated periodically as new case studies become available.
The changing climate in Canada is projected to cause an increase in the intensity of wet and dry weather extremes and associated hazards such as floods and droughts (Bush et al., 2014). Projected impacts will vary across Canada and will be dependent on temperature, precipitation and other factors including the condition of the land surface (BC MFLNRO, 2012) and level of development. Recent studies show annual rainfall in Canada has increased on average 13% from 1950 to 2009 (Bush et al., 2014; see also Environment and Climate Change Canada, 2016), with large variations depending on the region and season. For example, British Columbia and Atlantic Canada are experiencing larger increases in total precipitation, including significant changes in spring and autumn rainfall. Several regions in Canada are experiencing a decrease in snowfall and an increase in rainfall (Bush et al., 2014). Furthermore, flooding along Canada’s marine coasts is affected by sea-level change, with observed rates varying across Canada due to vertical land motion (Atkinson et al., 2016). For example, while global sea level rose at about 1.7 mm per year from 1901 to 2010, measured sea level rose by 3.3 mm/yr at Halifax (NS) and fell by 9.3 mm/yr at Churchill (MB) over the same time period (Atkinson et al., 2016).
Quantifying trends for extreme weather events, compared to average or total annual trends, is challenging. By definition, these events are less frequent with less data available for analysis (Seneviratne et al., 2012). Currently there has been no consistent change observed in extreme precipitation for Canada as a whole (Bush et al., 2014), despite changes in annual precipitation. One trend that has been observed is the increase in the costs of floods (IBC, 2015). Population growth, increasing economic activities in flood-prone areas, and more extreme weather triggered by a changing climate contribute to these increased costs (Visser et al., 2014; Field et al., 2012). Disaster Financial Assistance Arrangement (DFAA) payments from the federal government to provinces and territories for flooding events over 10 year periods have increased from $399 million between 1975 and 1984, to $3.8 billion between 2005 and 2014, adjusted to 2014 dollars (PBO, 2016).Projected average annual DFAA payments are estimated to be $673 million between 2016 to 2020, adjusted to 2014 dollars (PBO, 2016). While current trends for precipitation extremes in Canada are not consistent, the 24-hour maximum rainfall event (with current return period of 20 years) is expected to increase over the next 50 years (Environment and Climate Change Canada, 2016). Furthermore, projected relative sea level rise by the year 2100 may exceed 1 m in some places of Canada (Atkinson et al., 2016). There is a growing widespread awareness that climate change considerations can be critical to incorporating hydrologic and sea level projections into floodplain maps (ASFPM, 2016; APEGBC, 2012; Khaliq et al., 2016). However, incorporating climate change projections is complex because there is uncertainty with modelling future climate change projections (Khaliq et al., 2016) and the precise nature of the changes are uncertain (ASFPM, 2016). As a result, there is currently no single established method or best practice for incorporating climate change projections into flood mapping.
It should be highlighted that incorporating climate change considerations in flood mapping does not eliminate the need for future mapping updates, necessitated by land development and river channel changes (e.g. avulsions, erosion, degradation or aggradation).
The case studies incorporating climate change into floodplain mapping are included in the Annexes and the methods used are briefly described below.
Flood Mapping and Climate Change: City of Surrey Case Study
In 2013, the City of Surrey adopted a Climate Adaptation Strategy that included an initiative to increase the community’s resilience to future flood risks. As a part of this work, the City developed floodplain maps for future conditions, incorporating climate change projections and land-use changes for the 2040, 2070, 2100 and 2200 time horizons. The area is subject to coastal flooding, and both the Serpentine and Nicomekl Rivers flow through the city.
A continuous simulation was developed to combine the effects of ocean and precipitation conditions. The US EPA’s “HSPF” continuous hydrologic model was used to estimate inflows for the Hydrologic Engineering Center’s River Analysis System (HEC-RAS) hydrologic model. Future ocean levels were estimated by adding 10 cm/decade based on sea level guidelines for BCFootnote 1. For precipitation, Global Climate Model precipitation projections were downscaled by the Pacific Climate Impacts ConsortiumFootnote 2. Projections using the Global Climate Model (GCM) CanESM2 were selected: one representing a “moderately high” scenario and one for a “severe scenario”. An “extreme scenario” using another model (GCM MPI-WSM-LR) was rejected because the authors deemed it unrealistic. Land use planning was estimated from the City of Surrey’s Official Community Plan. A floodplain map showing 200-year return period floodplain extents for present conditions, and future conditions for years 2040, 2070, 2100 and 2200 was produced. The analysis showed that for the low-lying floodplain areas, coastal flooding driven by sea level rise was most significant and reduced the return period for the current 200-year flood to less than 2 years by 2100, regardless of changes to precipitation. In the upper floodplain areas, the present 200-year flood level could occur on average every 5 to 10 years by the year 2100. While the case study found that these projections are realistic and useful for planning, the authors recommend that actual conditions be monitored frequently and flood management decisions and strategies adjusted as necessary.
Flood Mapping and Climate Change Case Study: Integration of Climate Change in Flood Mapping in British Columbia’s Lower Mainland – Fraser River and Coast
This case study examined flooding along the Lower Fraser River and the south Coast of British Columbia on the Lower Mainland. The Fraser River is the largest river on the west coast of Canada and climate change projections include increased peak flows due to earlier and more intense freshet snowmelt coupled with heavier rainfall. The area is also vulnerable to coastal flooding due to global sea level and winter storm surge events. Freshet flooding is projected to affect a much larger area than coastal flooding.
The study informs a Lower Mainland Flood Management Strategy initiative, which is intended to reduce and manage flood risk in communities in the Lower Mainland. The flood mapping was conducted to support a regional assessment of flood vulnerabilities and was not used for official designation of floodplains, new dike design profiles or Flood Construction Levels.
The case study looked at two types of flood hazards: Lower Fraser River flooding, and coastal flooding. The climate projections from a range of future greenhouse gas emission scenarios for regional temperature and precipitation were obtained from the Pacific Climate Impacts Consortium2 and a range of hydrologic models were reviewed. Two climate scenarios were selected based on recommendations from PCIC and included HadGEM A1B (Run 1) for an “intense climate change” scenario and HadCM3 BI (Run 1) for a “moderate climate change scenario”. The design flood for the river is the Fraser River Flood from 1894, which has an approximate 500 year return period. A projected sea level rise of 1 m by year 2100 was used based on provincially adopted guidelines. The study developed two maps: one showing present and future (2100) coastal flooding, and one showing present and future Fraser River freshet flooding. The future (2100) conditions represented the “moderate climate scenario”. Due to the topography of the river valley, the extent of inundation areas will not significantly change but the frequency and depth of inundation is expected to increase. For example, the Fraser River 50-year return period flood in year 2100 could have the same magnitude as the present design flood with a 500-year return period. Recommendations are provided for incorporating climate change projections into floodplain maps including the need for regular updating as tools improve and meteorological and physical conditions change.
Flood Mapping and Climate Change: Waterford River Case Study Analysis
In 2011, the Government of Newfoundland and Labrador updated and conducted new flood risk mapping studies as part of a new Climate Change Adaptation initiative. This initiative developed flood risk maps for the Waterford River and its tributaries in the municipalities of St. John’s Mount Pearl and Paradise. Developing the flood risk maps included selecting Intensity-Duration-Frequency (IDF) curves, flood flow estimation, hydraulic modelling, sensitivity analysis and overlaying the hydraulic modelling results onto topographic maps. The IDF curves used were developed and published by Conestoga-Rovers and Associates in 2015 and incorporated climate change projections using a tool developed by the University of Western Ontario. The IDF for 2071-2100 was selected for the case study because it projected the most conservative case: an increase in IDF rainfall of 26%. Hydrologic modeling was carried out using the Hydrologic Engineering Center’s Hydrologic Modeling System (HEC-HMS), developed by the US Army Corp of Engineers, and the geospatial modelling extension (HEC-GeoHMS) to estimate the flood flows for the 20 year return period and the 100 year return period. Flood flows were translated into water surface profiles for flood maps using the Hydrologic Engineering Center’s River Analysis System (HEC-RAS) and the geospatial modelling extension (HEC-GeoRAS) for the hydraulic modeling. The maps developed included comparisons of the current climate and development conditions and the future climate and development conditions for the 20 year return period and the 100 year return period. The case study provided recommendations for incorporating climate change considerations into floodplain mapping including updating IDF curves and maps as new data and information becomes available.
Future volumes of this document will include additional case studies as well as an updated introduction to incorporating climate change into floodplain mapping.
References
(APEGBC) Association of Professional Engineers and Geoscientists of BC (2017) Flood mapping in BC: APEGBC Professional Practice Guidelines.
(APEGBC) Association of Professional Engineers and Geoscientists of BC (2012) Professional Practice Guidelines – Legislated Flood Assessments in a Changing Climate in BC.
Atkinson, D.E., Forbes, D.L. and James, T.S. (2016): Dynamic coasts in a changing climate; in Canada’s Marine Coasts in a Changing Climate, (ed.) D.S. Lemmen, F.J. Warren, T.S. James and C.S.L. Mercer Clarke; Government of Canada, Ottawa, ON, p. 27-68.
(ASFPM) Association of State Floodplain Managers Foundation (2016) Meeting the Challenge of Change: Implementing the Federal Flood Risk Management Standard and a Climate-Informed Science Approach.
(BC MFLNRO) British Columbia Ministry of Forests, Lands and Natural Resource Operations (2012) Professional Practice Guidelines – legislated Flood Assessments in a Changing Climate in BC
Bush, E.J., Loder, J.W., James, T.S., Mortsch, L.D. and Cohen, S.J. (2014): An Overview of Canada’s Changing Climate; in Canada in a Changing Climate: Sector Perspectives on Impacts and Adaptation, (ed.) F.J. Warren and D.S. Lemmen; Government of Canada, Ottawa, ON, p. 23-64.
Environment and Climate Change Canada. (2016). Climate data and scenarios: synthesis of recent observation and modelling results.
Field, C. B., Barros, V., Stocker, T. F., & Dahe, Q. (Eds.). (2012). Managing the risks of extreme events and disasters to advance climate change adaptation: special report of the intergovernmental panel on climate change. Cambridge University Press.
Insurance Bureau of Canada. (2015). The financial management of flood risk: Insurance Bureau of Canada.
Khaliq, M.N., and Attar, A. (2017) Assessment of Canadian Floodplain Mapping and Supporting Datasets for Codes and Standards. National Research Council Canada Technical Report OCRE-TR-2017-026
(PBO) Office of the Parliamentary Budget Officer (2016) Estimate of the Average Annual Costs of Disaster Financial Assistance Arrangements due to Weather Events
Seneviratne, S.I., N. Nicholls, D. Easterling, C.M. Goodess, S. Kanae, J. Kossin, Y. Luo, J. Marengo, K. McInnes, M. Rahimi, M. Reichstein, A. Sorteberg, C. Vera, and X. Zhang, 2012: Changes in climate extremes and their impacts on the natural physical environment. In: Managing the Risks of Extreme Events and Disasters to Advance Climate Change Adaptation [Field, C.B., V. Barros, T.F. Stocker, D. Qin, D.J. Dokken, K.L. Ebi, M.D. Mastrandrea, K.J. Mach, G.-K. Plattner, S.K. Allen, M. Tignor, and P.M. Midgley (eds.)]. A Special Report of Working Groups I and II of the Intergovernmental Panel on Climate Change (IPCC). Cambridge University Press, Cambridge, UK, and New York, NY, USA, pp. 109-230.
Thistlethwaite, J., Henstra, D., Peddle, S., Scott, D., (2017) Canadian Voices on Changing Flood Risk Findings from a National Survey.
Visser, H., Petersen, A. C., & Ligtvoet, W. (2014). On the relation between weather-related disaster impacts, vulnerability and climate change. Climatic Change, 125(3-4), 461-477.
Annex A: Flood Mapping and Climate Change City of Surrey Case Study
Final report
Prepared for: Natural Resources Canada, Ottawa, Ontario, March 2017, NHC Ref. No. 3002515
Disclaimer
This report, Floodplain Mapping and Climate Change - City of Surrey Case Study, was prepared by Northwest Hydraulic Consultants Ltd. for Natural Resources Canada. The information and data contained herein represent Northwest Hydraulic Consultants Ltd.'s best professional judgment in light of the knowledge and information available to Northwest Hydraulic Consultants Ltd. at the time of preparation, and was prepared in accordance with generally accepted engineering practices.Northwest Hydraulic Consultants Ltd. denies any liability whatsoever to other parties who may use the methodologies described herein for any injury, loss or damage suffered by such parties arising from their use of, or reliance upon, this report or any of its contents
Credits and acknowledgements
We gratefully acknowledge the support provided by Natural Resources Canada in preparing this case study. Specific direction for the work was provided by Natural Resources Canada’s Climate Change Impacts & Adaptation Division.
We would like to thank the City of Surrey for initiating the Climate Change Floodplain Review (CCFR) and Coast Flood Protection Strategy (CFPS) studies; the original work behind the case study described. Key City representatives, who also contributed to this work, are Carrie Baron, P. Eng. and Matthew Osler, P. Eng.
The original CCFR work would not have been possible without the extensive data received from City of Surrey and a number of other sources, including Canadian Coast Guard, Public Works and Government Services Canada, Environment Canada, Water Survey of Canada, BC Ministry of Transportation and Infrastructure, Pacific Climate Impacts Consortium, Township of Langley, City of Langley, District of Delta and others.
Monica Mannerström, P.Eng., Vanessa O’Connor, P.Eng., Neil Peters, P. Eng. and Sarah North, GISP of Northwest Hydraulic Consultants Ltd. (NHC) prepared this report. NHC personnel who participated in the CCFR studies included:
- Bruce Walsh, P.Eng. – Project Manager (Phase 1)
- Monica Mannerström, P.Eng. – Project Manager (Phase 2, Lead Engineer Phase 1)
- Vanessa O’Connor, P.Eng. – Project Engineer – Hydraulic Modelling
- Sarah North, GISP – GIS Specialist – Mapping
- Malcolm Leytham, PhD., P.E. – Senior Engineer – Hydrology & Review
- Patty Dillon, P.E. – Senior Engineer – Hydrologic Modelling
- Vaughn Collins, P.E. – Senior Engineer – Hydraulic Modelling
- Mariza Costa-Cabral, Ph.D. – Climate Scientist
- David McLean, Ph.D., P.Eng. – Specialist Input
- Clayton Hiles, P.Eng. – Project Engineer – Ocean Modelling
David Smith, P. Eng., Senior Geotechnical Engineer (deceased) of Thurber Engineering Ltd (TEL) provided geotechnical sub-consultant services on land subsidence.
The City of Surrey - Coastal Flood Adaptation Strategy currently underway is led by NHC (largely same staff as above plus Charlene Menezes, P.Geo.). The work is supported by EcoPlan International Inc. (EPI) and particular appreciation is expressed to the key contributors: Julian Gonzalez, Ph.D., and John Ingram, RPP, MCIP.
Executive summary
The City of Surrey is located in British Columbia, on the west coast of Canada, just south of Vancouver and north of the Canada/USA border. It is the second largest city in BC, with a present population of over 0.5 million. Incorporated in 1879, it is now one of the fastest growing communities in Canada and there are intense development pressures on remaining agricultural lands.
The Serpentine and Nicomekl Rivers traverse the City and discharge into Mud Bay at the shores of the Pacific Ocean. Historically, the low-lying coastal areas and river floodplains have been exposed to extensive flooding. Surrey has invested considerable effort to bring these mainly agricultural lowlands to acceptable flood protection standards. At their outlets, the rivers drain through flap-gated control structures or ‘sea dams’, with sea dikes protecting the floodplain from ocean flooding.
Recent studies commissioned by the BC government on sea level rise due to climate change suggest a significant impact on the Serpentine and Nicomekl basins. Projected ground subsidence rates are expected to exacerbate the effects. Also, climate change will lead to more intense regional precipitation and as a result higher river flows. Land use changes associated with densification and additional development will reduce infiltration, further increasing runoff.
In 2013, Surrey adopted a Climate Adaptation Strategy. One key initiative is to develop a comprehensive flood adaptation strategy to increase the community’s resilience against forecasted climate change impacts on flood levels. Given that the floodplain areas are also important highway and rail transportation corridors the City needs to play a role in addressing wider risks. Of municipalities in Canada, Surrey is at the forefront of developing a multifaceted climate adaptation plan that will include both structural and non-structural flood mitigation measures.
Several engineering studies have been completed to date and form the foundation for future work. This case study summarizes technical analyses carried out and describes:
- A continuous simulation approach to develop a statistically defensible method for combining high ocean levels and river flows to simulate present 200-year flood levels.
- Estimates of future sea level rise based on provincial projections.
- Potential for ground subsidence.
- Estimates of future precipitation consistent with global climate model projections.
- A method for modelling future runoff and flood levels.
The intent of the case study is to describe a methodology for incorporating climate change impacts in floodplain mapping projects that can be applied, with some modification, to other communities across the country. Projecting future flood extents is possible to a degree but actual conditions must be monitored and floodplain maps updated over time. Considering the Surrey river/ocean system contains a number of flood control structures, alterations of these will significantly change flood levels. This case study forms part of the federal floodplain mapping guideline series which offers an opportunity to review and develop new mapping standards.
Table of contents
- 1. Introduction
- 1.1 City of Surrey – Geographic Setting
- 1.2 History of Floods
- 1.3 Moving Forward
- 2 Evaluation of present flood hazards
- 2.1 Ocean Analysis
- 2.2 Hydrologic Modelling
- 2.3 Hydraulic Modelling
- 3 Evaluation of future flood hazards with climate change
- 3.1 Sea Level Rise
- 3.2 Ground Subsidence and Relative Sea Level Rise
- 3.3 Future Precipitation Estimates
- 3.3.1 Development of Future Precipitation Time-Series
- 3.3.2 Uncertainty in Future Precipitation Projections
- 3.4 Hydrologic Long-Term Future Simulations
- 3.5 Hydraulic Long-Term Future Simulations
- 4 Flood hazard conclusions and lessons learned
- 4.1 Conclusions
- 4.1.1 Coastal Flooding
- 4.1.2 Inland Flooding
- 4.1.3 Floodplain Mapping
- 4.2 Lessons Learned
- 4.3 Challenges and Opportunities
- 4.1 Conclusions
- 5 Recommendations and a strategy
- 5.1 Recommendations
- 5.2 Development of a Flood Adaptation Strategy
List of tables
List of figures
- Figure 1. Serpentine and Nicomekl watersheds
- Figure 2. Oblique airphoto (Google earth) of the lower river reaches (looking north)
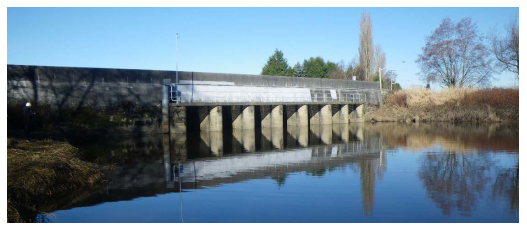
- Figure 3. Sea dam photo and operational diagram (by EPI)
- Figure 4. Process chart for the adopted method
- Figure 5. Observed, predicted, and residual tide levels at Point Atkinson, March 2012
- Figure 6. Recommended global sea level rise for planning and design in BC (Ausenco Sandwell, 2011)
- Figure 7. The ocean side community of Crescent Beach is vulnerable to sea level rise
- Figure 8. Serpentine River 200-year water level profiles for present and future (year 2100) conditions with sea level rise (SLR) only and SLR plus moderate precipitation increase
- Figure 9. Increasing floodplain due to climate change, from present conditions to year 2200 (by EPI)
- Figure 10. Five phased approach to developing a strategy (by EPI)
1 Introduction
This case study forms part of the Federal Floodplain Mapping Guidelines Series and was prepared to inform individuals and/or organizations involved with floodplain management in Canada. It builds on the following three engineering studies commissioned by City of Surrey and led by Northwest Hydraulic Consultants Ltd. (NHC):
- Serpentine, Nicomekl and Campbell Rivers – Climate Change Floodplain Review (2012).
- Serpentine and Nicomekl River – Climate Change Floodplain Review, Phase 2 (2015).
- Surrey Coastal Flood Adaptation Strategy (2016-2018).
The study focuses on how climate change impacts have been addressed in assessing future flood hazards. Updated official floodplain maps incorporating climate change have not been prepared to date but will be developed in conjunction with structural and non-structural mitigation work, forming part of an integrated adaptation strategy. The intent of this report is to describe a methodology that, with some modification, can be applied to other communities across the country in a variety of settings.
1.1 City of Surrey – Geographic Setting
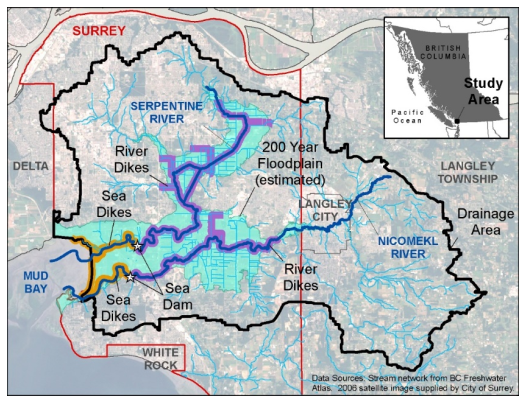
Figure 1. Serpentine and Nicomekl watersheds
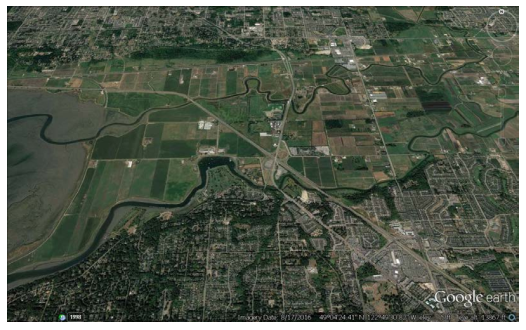
Figure 2. Oblique airphoto (Google earth) of the lower river reaches (looking north)
The City of Surrey is located on the south coast of British Columbia, just south of Vancouver and north of the Canada/USA border. It is the second largest city in BC, with a population of over 0.5 million.
European settlement began in the 1860’s, Semiahmoo and Kwantlen First Nations People having lived in the area for well over 6,000 years before that. Incorporated in 1879, it is now one of the fastest growing communities in Canada as people from around the world move to this culturally diverse city.
A large part of the City is drained by the Serpentine and Nicomekl Rivers (Figure 1). The rivers, with a combined drainage area of about 330 km 2 , originate in rolling uplands which have been heavily developed for residential and commercial use. The rivers then flow through flat, low-lying agricultural land to discharge into Mud Bay at the shores of the Pacific Ocean. The lowland reaches of both rivers are extensively diked and their flood protection and drainage systems incorporate some 30 pump stations, 200 flap-gated culverts (flood-boxes), and a complex network of flow storage areas, canals, ditches and spillways. At their outlets, the rivers drain through flap-gated control structures or ‘sea dams’, with sea dikes protecting the floodplain from ocean flooding. Drainage improvements and diking were introduced by the agricultural community, with the two sea dams built in 1913. The Serpentine and Nicomekl floodplain (200 year event) has a combined area of 59 km 2 with large areas below sea level even several kilometres inland from the sea dams. The floodplain land-use is primarily agricultural but has intensified over the years, requiring considerable upgrades to the flood protection system (Figure 2).
1.2 History of Floods
Prior to construction of the sea dams and dikes, the lower Serpentine and Nicomekl floodplain was an extensive salt marsh, with environmentally high-value intertidal areas. The two rivers regularly overtopped their banks, delivering nutrient-rich sediment to the floodplain. Daily high tides flooded inland more than 15 km up river and salmon had free access to the upper gravel bed reaches of the rivers for spawning. With construction of the sea dikes and dams, fish access became limited to periods when the sea gates are open, that is when ocean levels are lower than river levels. The sea dikes significantly reduced the inter-tidal habitat, however, the land could now be cultivated and saltwater intrusion was no longer a problem except during extreme coastal floods that caused some dikes to breach. Flood records date back to when the sea dams were built and show that flooding has traditionally been caused by heavy rain, rain on snow, high tides with ocean storm surge, or a combination of these events.
Sea dams
Sea dams are constructed along tidal rivers, like the Nicomekl and Serpentine Rivers, to keep salty ocean water from moving upstream where it could have detrimental effects on agricultural irrigation. Sea dams are tidally influenced and gravity-fed, with the incoming tide pushing their gates closed (B) and the river pushing them open once the tide moves out (A).The Nicomekl and Serpentine sea dams were first built in 1912 and 1913
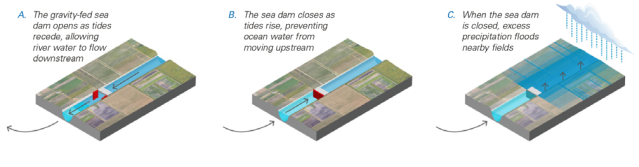
Figure 3. Sea dam photo and operational diagram (by EPI)
text version
- The gravity-fed sea dam opens as tides recede, allowing river water to flow downstream
- The sea dam closes as tides rise, preventing ocean water from moving upstream
- When the sea dam is closed, excess precipitation floods nearby fields
During high ocean levels, the sea dam gates close and precipitation and runoff must be stored temporarily, in either the diked Serpentine and Nicomekl River channels or the lowland floodplain (Figure 3). During high river levels, the only way to drain the internal diked areas is by pumping over the dikes into the river channels. However, as water levels in the main rivers continue to rise and exceed 10 to 15-year return period levels, the pump stations are shut off and the land behind the dikes is allowed to flood. In order not to compromise the integrity of the river dikes, spillways have been incorporated in the river dikes at several locations to spill flows from the river channels to the mainly agricultural floodplain lands to ensure a degree of equitable flooding. The fields essentially function as flood storage cells until ocean levels drop, the sea dam gates open and the water can drain. Flooding typically occurs from November to February when fields are dormant, and consequently agricultural losses are relatively limited. Some houses and roads may also be affected by this ‘nuisance’ level flooding.
Surrey has spent considerable time and effort to bring the floodplain level of service to the Agriculture & Rural Development Subsidiary Agreement (ARDSA) standards for floodplain lands within the Serpentine and Nicomekl watersheds. ARDSA standards allow the flooding of farm fields for 5 days in the winter months and 2 days in the summer months, during a 10-year return period storm. This is a different degree of protection than designing for the extreme flood event.
The diking system was significantly improved by Surrey between 1998 and present day. Over $40 million has gone into raising the dikes, installing pump stations and improving channel conveyance. However, the current system does not meet typical 200-year flood standards and of much greater concern is infrequent, catastrophic flooding from events that overwhelm and breach the sea dikes and/or river dikes. Provincial floodplain maps, showing the inundation extents for a 200-year return period flood, were first prepared in 1993 using Environment Canada’s ONE-D software (KPA 1993). Surrey later translated it to MIKE11 software which formed the basis for diking system upgrades and has been updated since to keep current with system changes. The modelling did not account for the joint probability of coastal and riverine events and a more statistically defensible approach was called for.
In 2010-2012, the Province of BC released various publications dealing with sea level rise, sea dike designs and climate change. Surrey wanted to consider these reports and the potential climate change impacts on future flood levels to their coastal and riverine systems which led to the work described in this case study.
1.3 Moving Forward
In 2013, the city adopted a Climate Adaptation Strategy. One of the key initiatives is the need to develop a comprehensive flood adaptation strategy to increase the community’s resilience against forecasted climate change impacts on flood levels. Given that the floodplain area is also an important highway and rail transportation corridor, the City needs to play a role in addressing wider risks. Of municipalities in Canada, Surrey is at the forefront of developing a multifaceted climate adaptation plan, that will include both structural and non-structural flood mitigation measures. This is being examined in detail under the City’s Coastal Flood Adaptation Strategy (CFAS). CFAS combines all the technical work conducted previously with community and industry stakeholders to gain a better understanding of the problems and a means to work towards a long term strategy.
2 Evaluation of present flood hazards
On the Serpentine/Nicomekl River floodplain, inundation is a function of:
- The volume and temporal pattern of rainfall and the watershed’s hydrologic response to it.
- The time varying ocean level in Mud Bay coincident with storm events.
- The hydraulic response of the system (comprising storage and various hydraulic infrastructure) to the hydrologic inputs and the ocean level boundary condition.
To get around the difficulties of selecting a combination of ocean level and precipitation conditions, a continuous simulation approach was adopted. For this approach, long time-series of historical data were developed for ocean conditions and precipitation conditions, which were then used with continuous numerical models with the end goal of simulating a long time-series of water levels in the Serpentine and Nicomekl River and floodplain system. This approach intrinsically captures the natural connection between ocean conditions and precipitation.
For the Surrey flood estimates, an annual exceedance probability (AEP) of 0.5% was used, which is equivalent to a return period of 200 years. Statistically, roughly 50 years of data are needed to provide a defensible estimate of a 200-year event. Fortunately, historical data for tide, wind (to determine storm surge and wave conditions) and precipitation is available from the mid-60’s, which allowed the following time-series to be developed:
- A 50-year long historic record of local hourly rainfall data was assembled and used as input to a continuous hydrologic model to produce simulated historic hourly inflows for the rivers and channels on the floodplain for present conditions. The model was configured for present day conditions based on official community development plans.
- Historical hourly ocean levels in Mud Bay were developed for the same time period. Using available data, coastal numerical modelling was undertaken to develop a time-series that accounted for storm surges and wave setup. However, while sea level rise is expected in the future, it must be remembered that it has also occurred in the past, so the 50-year record was adjusted to create a time-series that was considered “stationary” for present day conditions.
The two 50 year hourly time-series (inflows and ocean levels) representative of present day conditions were then used as boundary conditions for a continuous numerical hydraulic model of the river system and floodplains (divided into storage “cells”), which included sea and river dikes, pump stations, sea dams, bridges, flood-boxes and spillways. The hydraulic model simulated the hourly water levels in the river channels and floodplain “cells” over the 50 year period, which was then statistically analysed to determine the magnitude and frequency of water levels at selected locations throughout the system.
This section describes each step of the method for present conditions; the ocean analysis, hydrologic modelling and hydraulic modelling. A process chart for the entire analysis is included in Figure 4.
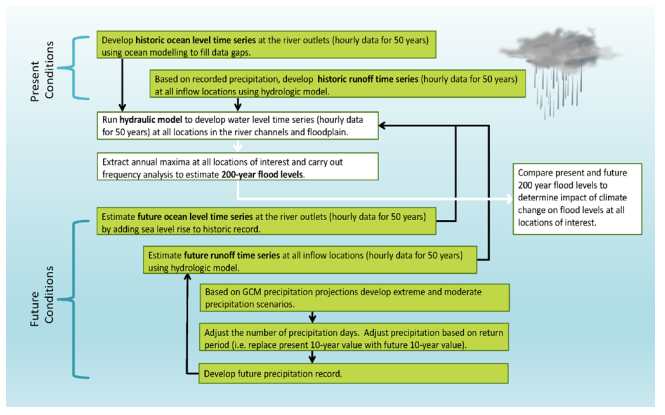
Figure 4. Process chart for the adopted method
Text version
Figure 4. The chart describes each step of the adopted method
Preset Conditions:
- Develop historic ocean level time series at the river outlets (hourly data for 50 years) using ocean modelling to fill data gaps.
- Based on recorded precipitation, develop historic runoff time series (hourly data for 50 years) at all inflow locations using hydrolic model.
Process:
- Run hydraulic model to develop water level time series (hourly data for 50 years) at all locations in the river channels and floodplain.
- Extract annual maxima at all locations of interest and carry out frequency analysis to estimate 200-year flood levels.
- Compare present and future 200 year flood levels to determine impact of climate change on flood levels at all locations of interest.
Future Conditions:
- Estimate future ocean level time series at the river outlets (hourly data for 50 years) by adding sea level rise to historic record.
- Estimate future runoff time series at all inflow locations (hourly data for 50 years) using hydrologic model.
- Based on GCM precipitation projections develop extreme and moderate precipitation scenarios.
- Adjust the number of precipitation days. Adjust precipitation based on return period (i.e. replace present 10-year value with future 10-year value).
- Develop future precipitation record.
2.1 Ocean Analysis
The tides in Mud Bay are classified as “mixed, mainly semi-diurnal” meaning that they undergo two complete tidal oscillations daily but with inequalities both in high waters and low waters. The maximum daily tide range from lowest low to highest high is just over 5 m. Coastal water levels have a ‘deterministic’ and a ‘probabilistic’ component. The predicted tide level forms the ‘deterministic’ component while any deviations from the predicted tide resulting from changes in barometric pressure, wind and wave stress form the ‘probabilistic’ component (also known as residual). On the BC coast, storm surge can temporarily increase the ocean level by more than 1 m above the predicted tide level. Figure 5 illustrates the difference between the predicted tide level, the observed ocean level and the computed residual levels during the passage of a low pressure storm system in March 2012 at the long- term tidal station of Point Atkinson in West Vancouver, 40 km northwest of Mud Bay.
Since a complete combined ocean level record was unavailable at the river outlets in Mud Bay, a time- series based on a combination of measured and modelled values of each component had to be generated, forming a composite data-set for the selected continuous 50 year modelling period (NHC 2012). This ‘hind-cast’ period was considered statistically long enough for estimating 200-year return period water levels and took into account the joint probability of high tides, storm surge and wind set-up. (The method resulted in a 200-year ocean level approximately 0.5 m less than derived by simply adding the 200-year storm surge and wind set-up to the Higher High Water Large Tide (HHWLT) – a simplified method often used in the past.)
2.2 Hydrologic Modelling
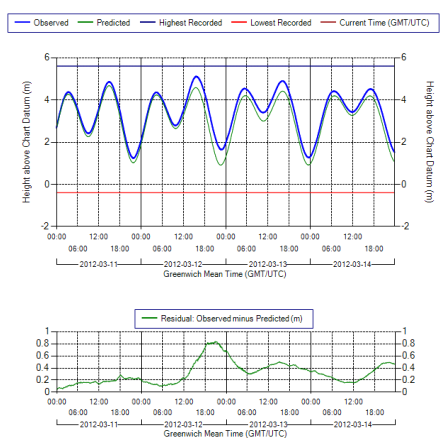
Figure 5. Observed, predicted, and residual tide levels at Point Atkinson, March 2012
Text version
Figure 5. This chart shows tidal heights over four days from March 11 to March 14, 2012.
Top Chart: Tidal Heights
Observed (blue line): Actual tidal heights recorded.
Predicted (green line): Forecasted tidal heights.
Highest Recorded (purple dashed line): Maximum observed height.
Lowest Recorded (orange dashed line): Minimum observed height.
Current Time (red vertical line): Specific measurement time (not shown here).
The observed and predicted lines mostly follow the same pattern, indicating accurate predictions with some minor deviations.
Bottom Chart: Residual Analysis
Residuals (green line): Differences between observed and predicted heights.
Residuals mostly hover around zero, showing minor discrepancies.
A notable spike occurs around mid-day on March 12, indicating a larger difference between observed and predicted heights.
Streamflow information in the Serpentine and Nicomekl basins is sparse, and the hydrologic regime of the two basins has changed over time due to land development. Hydrologic modelling was necessary to generate inflows to the continuous simulation hydraulic model. Similarly to the ocean level analysis, an approximately 50 year long time-series of simulated hourly flows were produced for the required inflow locations using meteorological data.
The ‘HSPF’ continuous hydrologic model (US EPA) software was used since it offers a number of advantages over other similar models. The hydrologic model required input time-series of precipitation and evaporation data, and delineation of the basin into pervious and impervious soil-land cover complexes that characterize land surface rainfall-runoff response. The precipitation station at Old Surrey Municipal Hall was selected for modelling and spatial variation of rainfall over the study area was introduced by scaling the data from the station. Existing land use mapping was provided by Surrey.
Two stream gauges, Nicomekl River at 203 Street and Mahood-Bear Creek, a tributary to the Serpentine, provided calibration data for the upland areas. Because the study focused on flood events, nine large storms were selected for calibration.
By running the calibrated HSPF model, hourly long-term hydrologic inflows to the hydraulic model were generated using 50 years of meteorological data.
2.3 Hydraulic Modelling
The purpose of the hydraulic modelling was to generate a 50 year long time-series of flood levels throughout the Serpentine and Nicomekl rivers and floodplain. A frequency analysis of annual peak levels could then be completed to estimate the 200-year flood levels at locations of interest for the existing conditions. The flood levels derived in this manner reflect the actual joint probability of high ocean levels and significant precipitation.
Since storm runoff response from the heavily developed portions of the watersheds is flashy, and the river systems are tidally influenced, a hydrodynamic model with a relatively short computational time- step was required. Considering the long time periods to be simulated, the model also had to maintain reasonable run-times. An existing MIKE11 model was initially considered but the runs would have taken too long and instead a new HEC-RAS model was developed.
Flood levels, particularly in the floodplain, are a function of storage, pumping and spillway capacities rather than channel roughness, and consequently a traditional model calibration was not performed. Instead, the model was validated using two recent large floods.
Once working satisfactorily, the model was used to generate 50 year long time-series of simulated water levels in the two watersheds. A computational time step of 30 seconds was required for the modelling. By dividing the near 50-year time-series into decade-long periods and running each decade on separate computers, the runs could be completed in two days.
Based on the results, annual maximum flood levels at various locations in the watersheds were seen to often be generated by different historic storm events. As expected, in the lower reaches (downstream of the sea dams), the highest flood levels were caused by high ocean levels and in the upper reaches by high precipitation events. Mid-basin (in the flat area upstream of the sea dams), flooding was caused by combination events. Due to the operation of the sea dam gates, the maximum flood levels in the lower and mid-basins occurred as a result of extended periods of relatively high ocean levels restricting outflow, rather than by exceptionally high, shorter duration peak ocean levels.
Flood levels were output at about 100 locations for the 50 year simulation and annual peak levels were extracted for the time period. As the final step, frequency analyses were applied to the annual maximum flood levels to estimate the 200-year return period flood levels for all key locations.
3 Evaluation of future flood hazards with climate change
To be able to phase flood protection upgrades and the introduction of new costly infrastructure, Surrey is interested in future flood levels corresponding to the 2040, 2070, 2100 and 2200 time horizons. In other words, it is necessary to predict how flood levels are influenced by future climate change impacts and land-use changes over time. This can be accomplished by rerunning the hydraulic model, using as boundary conditions a 50 year-long ocean level time-series adjusted for sea level rise and an inflow time-series adjusted for precipitation and land-use changes for each time horizon, as shown in Figure 4. For example, to estimate future flood levels in year 2100, one metre of sea level rise was added to the historic ocean level time-series to obtain a 50 year-long ocean level time-series of ocean levels representative of year 2100.
Adjusting the ocean boundary condition time-series for sea level rise was relatively straightforward as described below. The equivalent inflow boundary condition was derived by rerunning the hydrologic model for the anticipated future land-use and projected precipitation/temperature conditions as outlined in Section 3.3. By comparing the present and future simulated 200-year flood levels at a selected location, the projected climate change impacts could be determined. Of particular interest were the resulting changes to the floodplain extents, the adequacy of the existing dikes over time, and the future functionality of spillways, sea dams and other infrastructure. The procedure is somewhat time- consuming but provides a technically sound method for incorporating climate change impacts on flood levels in river systems affected by both increasing ocean levels and changes in run-off. The procedure applied to incorporate future climate change impacts is described in more detail in the following sections.
3.1 Sea Level Rise
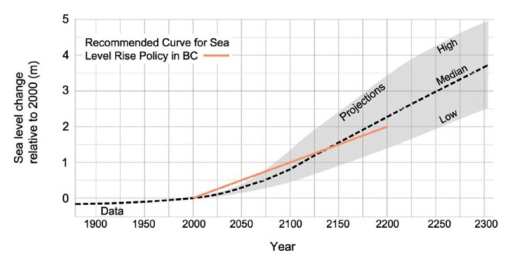
Figure 6. Recommended global sea level rise for planning and design in BC (Ausenco Sandwell, 2011)
Text version
Figure 6. This chart shows the projected sea level changes relative to the year 2000, with data spanning from 1900 to 2300.
Key Elements:
X-Axis (Year): Time period from 1900 to 2300.
Y-Axis (Sea Level Change): Change in sea level in meters relative to the year 2000.
Data and Projections:
Historical Data (black dashed line): Sea level changes recorded from 1900 to 2000.
Recommended Curve (orange line): Suggested sea level rise policy for British Columbia (BC).
Projections (grey shaded area): Estimated sea level rise from 2000 to 2300, including:
Median projection (dashed black line): The most likely scenario.
High projection: An upper estimate indicating more significant sea level rise.
Low projection: A lower estimate indicating less significant sea level rise.
The consensus of organizations such as the Inter-governmental Panel on Climate Change (IPCC) is that the global climate system is warming and the global annual mean temperature is expected to rise more than 3°C this century. Continued warming and changing of precipitation patterns will have a large effect on hydrological processes, with significant implications for the economy, infrastructure, and eco-systems of British Columbia (Rodenhuis et al, 2009). The sea level rise guidelines for BC (Ausenco Sandwell 2011) recommends using a 1 m rise in global mean sea level between year 2000 and 2100 (Figure 6). While the guidelines imply an assumption of a linear 10 mm/year rise, it is clear that this assumption overstates actual sea level rise early in this period. Analyses based on satellite altimeter measurements show a more or less steady global mean sea level rise from 1993 to 2011 of 3.1 ±0.4 mm/year (www.cmar.csiro.au).
While some climate change studies have indicated possible future increases in the frequency and intensity of storms, implying possible increases in wave climate severity and storm surge, there is at present little consensus on such impacts. Accordingly, potential future increases in storm frequency and intensity were not considered in this study.
The 50 year long ocean level time-series for 2040, 2070, 2100 and 2200 were derived by adding 10 cm/decade to the ocean time-series.
3.2 Ground Subsidence and Relative Sea Level Rise
Portions of the Surrey lowlands are known to be subsiding, exacerbating sea level rise. Geotechnical studies report average subsidence rates in the order of 1 mm/year or approximately 0.1 m over 100 years. Most of the on-going sediment compaction and related subsidence occurs in the upper 10 to 20 m of the predominantly silt and peat Holocene sediments. On-going future subsidence will impact both flood depths behind dikes and elevations of flood protection works. Some structures, for example pump stations have already subsided more significantly. In order to estimate the relative sea level rise, the estimated global rise projections and the effect of ground displacement were simply added. An area highly vulnerable to sea level rise is shown in Figure 7.
3.3 Future Precipitation Estimates
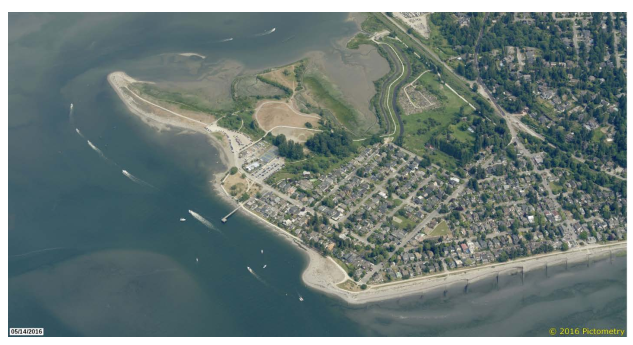
Figure 7. The ocean side community of Crescent Beach is vulnerable to sea level rise
Estimating future precipitation based on observed trends was initially suggested. Precipitation trends analyzed by others showed significant increases in extreme precipitation for the month of January.
However, extending observed trends reliably into the future is not possible as such trends can have different explanations. Precipitation has a high degree of natural variability that occurs in the absence of any external forcings. In other words, trends can occur without changes in greenhouse gas concentrations or solar intensity. The detection of a precipitation trend over time is not easily attributable to anthropogenic climate change.
A second approach, using precipitation intensity-duration-frequency (IDF) curves, was briefly considered. Given that the project used a continuous hydrologic simulation approach, there was no method to translate a change in an IDF curve under future climates, into a change in the rainfall time- series that was used to drive the simulations. Also, IDF curves do not allow for changes in rainfall intensity during longer duration events or back-to-back storms. In other words, IDF curves are most suitable for event-based analysis, where a critical duration can be defined which is sufficiently short that the assumption of a constant intensity is plausible. However, for the Serpentine/Nicomekl watershed application, which requires evaluation of independent forcings and responses over a range of time scales, such an event-based approach does not capture system variability.
Instead a third approach, although associated with a high degree of uncertainty, was adopted for this work as described below.
3.3.1 Development of Future Precipitation Time-Series
The selected approach involved developing future climate scenarios in the form of hourly precipitation time-series that could be used as input to the HSPF hydrologic model. The precipitation time-series were created in a manner consistent with projections of global climate models (GCMs). Two alternative synthetic time-series of hourly precipitation were developed covering the 21st century. The approach (NHC 2015) consisted of the following steps:
- GCM precipitation projections downscaled by the Pacific Climate Impacts Consortium (PCIC) were obtained and analysed. Data from twelve GCMs, which served as the basis for the IPCC’s Fifth Assessment Report (CMIP5) were available from PCIC. Future greenhouse gas emissions were represented by the Representative Concentration Pathway (RCP) having the highest emissions, RCP8.5. This RCP was considered the most realistic, in light of the lack of progress in curtailing emissions in the last two decades or achieving significant international commitment for future curtailments. Nearly all of the twelve GCM runs project future increases in daily precipitation intensity accompanied by declines in the mean number of precipitation days in a year.
- Two GCM runs were identified that represented, in the context of all the PCIC projections, an “extreme scenario” and a “moderately high scenario” in terms of flood risk. The GCM CanESM2 was selected for the “moderately high scenario” because it projects a moderate increase in precipitation intensity on wet days (ranks 8th for 2040-2069 and ranks 10th for 2070-2100) and a moderate decline in the number of wet days (ranks 5th for 2040-2069 and ranks 6th for 2070- 2100). The GCM MPI-WSM-LR ranked highest for projected increase in mean precipitation on wet days, hence was initially picked to represent an “extreme scenario”. After detailed analysis, this GCMs projection appeared unrealistic due to a sudden and large (250%) increase in precipitation intensity starting shortly after the historical period. For this reason, this GCM was ultimately not used. Instead, a “severe scenario” was created which amplified the changes projected by CanESM2.
- The observed historical time-series of hourly precipitation at the Surrey Municipal Hall gauge was altered so as to create two new hourly time-series, representative of projected precipitation regimes toward the end of the 21st Century, one of which is statistically consistent with the “moderately high” GCM run, and the other representing a “severe” scenario situated between the “moderately high” and “extreme” GCM runs.
To create each future precipitation time-series, the observed historical time-series was first modified to reduce the number of precipitation days. Precipitation days were removed from the end of randomly selected storm events from the observed time-series until the number of precipitation days was consistent with the GCM projections. The daily precipitation totals on the remaining wet days were then adjusted so that the distribution of daily precipitation on wet days would be consistent with the GCM- projected increases. To this end, the return period of each daily observed precipitation value was estimated, and that value was then replaced by a higher value having the same return period in the future distribution (i.e. replace present 10-year value with future 10-year value).
Table 1 summarizes the number of wet days and daily intensities for selected return intervals for the historic and two climate change scenarios. Once the future daily time-series were developed, the daily precipitation values were disaggregated to hourly values using the same temporal distribution as in the historic observed data.
| Precipitation Scenario | Average Wet Days per Year | Daily Precipitation (mm/day) for Selected Return Interval | ||
|---|---|---|---|---|
| 10-year | 100-year | 200-year | ||
| Historic (1963-2009) | 171 | 81 | 159 | 200 |
| Moderate | 162 | 105 | 213 | 267 |
| Severe | 162 | 106 | 294 | 402 |
Uncertainty in Future Precipitation Projections
While there is a need to provide quantitative information for flood risk management planning, the underlying projections of climate change are subject to large and unquantifiable uncertainty. The main sources of uncertainty are unknown future emissions of greenhouse gases, uncertain response of the global climate system to increases in anthropogenic greenhouse gas concentrations, and incomplete understanding of regional manifestations that will result from global changes. In addition, precipitation processes are very complex and difficult to simulate accurately in models. The downscaling, in space and time, of GCM-projected climate variables, the extrapolation of frequency analyses to extreme return periods, and the disaggregation from future daily precipitation to hourly precipitation represent additional sources of uncertainty.
The precipitation projections developed in this work should be considered plausible representations of the future, given the best current scientific information, but do not represent specific predictions. The actual future realizations of precipitation at Surrey will differ from any of the scenarios developed, and their difference compared to historical precipitation may be greater or smaller than the differences projected in this work. While the sources and degree of uncertainty may appear overwhelming, it needs to be restated that nearly all of the multiple GCM runs predict future increases in daily precipitation intensity accompanied by declines in the mean number of precipitation days in a year – and therefore, the projections utilized in the case study are credible for flood management planning.
3.4 Hydrologic Long-Term Future Simulations
The hydrologic HSPF model was rerun to generate future long-term hydrologic inputs to the HEC-RAS hydraulic model. The hydrologic modelling was conducted for the future land-use as projected by Surrey in their Official Community Plan and the alternate precipitation inputs representing the two future climate change scenarios to generate “moderate” and “severe” future climate change scenarios.
3.5 Hydraulic Long-Term Future Simulations
The hydraulic modelling could then be repeated using the two future sets of hydrologic inputs and the adjusted ocean levels as boundary conditions to generate future flood level time-series throughout the watershed. By extracting annual maxima at selected locations and analyzing these in frequency analyses, estimates of the 200-year future flood levels could be derived for the desired time horizons.
The existing geometry data was used in the hydraulic model to simulate the future conditions, providing an indication of how the system, if unchanged, would respond under future climate change conditions. Figure 8 shows longitudinal profiles of the Serpentine River comparing 200-year water levels for present and future scenarios. Due to the low gradient, ocean effects impact water levels some 18 km upstream of the sea dam.
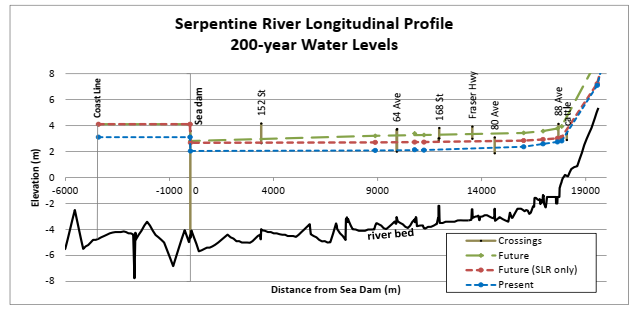
Figure 8. Serpentine River 200-year water level profiles for present and future (year 2100) conditions with sea level rise (SLR) only and SLR plus moderate precipitation increase.
Text version
Figure 8. This chart displays the longitudinal profile of the Serpentine River, focusing on 200-year water levels, with data extending from -6000 meters to 19000 meters relative to the Sea Dam.
Key Elements:
- X-Axis (Distance from Sea Dam): Measures distance in meters, from -6000 m (upstream of the sea dam) to 19000 m.
- Y-Axis (Elevation): Measures elevation in meters.
Data Series:
- River Bed (black line): Shows the elevation profile of the river bed along the distance.
- Present Water Levels (blue dashed line): Current water levels in the river.
- Future Water Levels with Sea Level Rise (red dashed line): Predicted future water levels considering sea level rise (SLR).
- Future Water Levels without Sea Level Rise (green dashed line): Predicted future water levels without considering sea level rise.
- Crossings (green vertical lines): Locations of crossings at various streets and highways:
- Coast Line
- Sea Dam
- 152 St
- 64 Ave
- 168 St
- Fraser Hwy
- 88 Ave
Figure 9 shows potential 200-year floodplain extents for present conditions and in future years 2040, 2070, 2100 and 2200, assuming no improvements or changes to the existing flood protection system. The increases in floodplain extents are relatively limited due to the flat topography of the floodplain and steeply rising valley walls. The increases in flood depths are comparatively more significant.
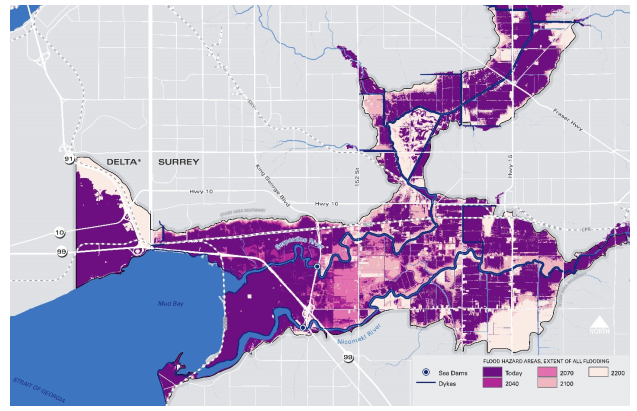
Figure 9. Increasing floodplain due to climate change, from present conditions to year 2200 (by EPI)
Text version
Figure 9. Increasing floodplain due to climate change, from present conditions to year 2200 (by EPI)
This image is a map showing flood hazard areas in the regions of Delta and Surrey. It depicts the extent of all flooding for various future time frames: today, 2040, 2070, and 2100. The flood hazard areas are represented in different shades of pink and purple, with darker shades indicating more imminent flood risks. Key features such as sea dams and dykes are also marked on the map.
4 Flood hazard conclusions and lessons learned
4.1 Conclusions
Traditionally, cities were often established at river outlets as these locations offered a number of advantages including good transportation. The methods used in this case study may be applicable to a number of other communities situated in river deltaic areas impacted by complex interactions of river and sea/lake flooding. The described continuous simulation approach forms a statistically defensible method for estimating the magnitude and frequency of floods resulting from the joint occurrence of high ocean levels and large river flows, without having to pair particular return period ocean levels and flows.
To estimate future flood levels in Surrey, taking climate change impacts and land-use alterations into account, some simplifications were introduced in the ocean, hydrologic and hydraulic modelling.
Nevertheless, the results are believed to provide a realistic representation of relative increases in flood levels within the Serpentine and Nicomekl River basins, assuming the adopted sea level and precipitation increases are reasonably accurate.
4.1.1 Coastal Flooding
By analyzing long-term continuous time-series of ocean levels, the joint probability of high tides, storm surge and wave set-up were implicitly accounted for. This approach provides a statistically defensible method of estimating a flood level for a given annual exceedance probability (AEP). A simpler alternative method (Ausenco Sandwell 2011) involving the direct adding of these three ocean level components may be useful for preliminary flood level estimates, but is considered to be conservative.
The modelled ocean levels were compared to crest elevations of the existing coastal dikes. The results showed that under current conditions, most of Surrey’s coastal dikes offer inadequate protection against coastal flooding and immediate attention is required to reduce the risk of overtopping and breaching.
For present conditions, the protection level return period ranges from 2 to 350 years, with only two of the dikes meeting 200-year ocean level standards.
With sea level rise, conditions are expected to continuously worsen. Specifically, the estimated return period ocean event that each dike is able to withstand will decrease with time due to sea level rise.
Assuming the linear increase in sea level recommended by provincial guidelines, by year 2020, none of the dikes will meet the 200-year standard; by 2040, the return period event the dikes can withstand without overtopping will be less than 10 years; and, by 2070, it is expected that all dikes will be inundated multiple times per year. The dikes are not designed for overtopping and would likely fail if ocean waters washed over the crests or, potentially, as the dike freeboard is compromised.
4.1.2 Inland Flooding
The precipitation projections reflect plausible representations of the future, given the best current scientific information, but do not represent specific predictions. The analyses suggest that by year 2100, at the 200-year return period level, a moderate climate scenario may increase daily precipitation by roughly 33% and the severe scenario by 50%. As climate science improves, the estimates will need refinement. The higher precipitation will lead to more intense runoff, which is also expected to increase as a result of future land-use having reduced infiltration rates.
The modelled river flood levels were compared to the crest elevations of existing river diking. Inland dikes generally have some degree of freeboard at present 200-year flood conditions. However, by year 2100, the region’s sea dams, dikes, bridges, roads and railroads will be extensively vulnerable to river flooding.
In the lower floodplain (just upstream of the sea dams), the present 200-year flood level will have a return period of less than 2 years by year 2100, regardless of increases in precipitation. In the upper Nicomekl and Serpentine reaches, assuming no changes in precipitation, the present 200-year flood level, will have a return period of roughly 75 years in year 2100. With the estimated precipitation increases corresponding to a severe or moderate climate change scenario, the present 200-year water level could occur on average every 5 to 10 years.
4.1.3 Floodplain Mapping
Official floodplain mapping for present or the future conditions incorporating climate change effects, has not yet been prepared. A comparison of the new modelled flood levels with the flood levels developed for the 1990’s floodplain mapping indicates a need to update Flood Construction Levels (FCLs) throughout the floodplain. Considering the relatively steep topography near most of the floodplain boundaries, relatively minor increases to the inundation area are expected by year 2100.
Inundation maps were prepared for present, year 2100 and year 2200 conditions. The maps depicting future conditions were based on predicted ocean level and runoff time-series (assuming future land use and precipitation amounts). The maps do not form official floodplain maps and should not be used for establishing FCLs without additional refinement. However, they do provide valuable information that Surrey can use for evaluating present and future flood hazards and the vulnerability corresponding to present and future development. The information provides an important tool for developing defensible flood adaptation strategies.
4.2 Lessons Learned
Surrey is one of the fastest growing cities in Canada and there are intense pressures to develop land within the floodplain. Surrey’s forward-thinking land-use regulation policy has ensured that floodplain areas largely contain agricultural lands rather than high density development. This significantly reduces potential future economic flood losses and related flood risks. In developing a flood adaptation strategy there is more flexibility than otherwise would be the case.
The river systems are no longer natural and already contain extensive flood protection measures. Unfortunately, the sea dams have essentially reached the end of their lifespan, the ocean dikes are substandard and will frequently overtop in the future. There are spillways in the river dikes to control overflow and facilitate the use of floodplain land for flow storage. Developing an adaptation strategy for the future is challenging, considering the present infrastructure and limited feasibility of upgrading it.
It is possible to project future flood conditions to a degree but, over time, the actual conditions must be monitored and the strategies adjusted. In spite of the extensive research and modelling completed to date, the full impacts of a catastrophic flood are not accurately known. It is difficult to predict how stakeholder opinions may change and how the prioritization of future protection measures would be influenced. On a macro scale, climate change flood adaptation is far broader than strictly an engineering problem, requiring the involvement of multiple levels of government and a wide range of stakeholders.
4.3 Challenges and Opportunities
Considering the flood control structures along the ocean and rivers, future alterations of the protection measures will have a major impact on flood levels. Surrey is in the process of developing a flood adaptation strategy, likely involving additional structural protection but potentially also accommodation of flood waters and retreat from flooding. These measures are likely to significantly alter estimated flood
levels, rendering the inundation mapping obsolete. Adaptation measures will likely be introduced gradually over time, and to some extent in response to the flooding experienced and losses accrued. Preparing floodplain maps for such a complex system is challenging and it should be recognized that the mapping will need to be updated as changes occur.
In BC, the 200-year flood incorporating a freeboard allowance of 0.6 m has traditionally been used for floodplain maps. For the largely agricultural Surrey lowlands, a lesser flood standard could be considered. Flood control structures, transportation infrastructure and utilities typically require a high standard. Setting appropriate risk-based design standards is far from straightforward and is likely to vary between provinces. Freeboard should be a function of uncertainty and overall risk rather than a specified value. The federal floodplain mapping guideline series offers an opportunity to review and develop new mapping standards.
5 Recommendations and a strategy
5.1 Recommendations
A number of specific recommendations came out of the work described, both pertaining to improving the modelling inputs/procedures and the development of a flood management/adaptation strategy. Modelling improvements are highly technical (NHC 2015) and are not described here. Key management recommendations forming the next steps include:
- Develop an emergency response plan and outline: 1) temporary protection measures; 2) the evacuation of people and livestock; and, 3) procedures for repairing dikes.
- Assess the feasibility and cost/benefit ratios of: 1) improved coastal and river diking; 2) coastal protection, such as jetties, breakwaters, beach nourishment and different edge treatments such as riprap and sheet piling; 3) introduction of adaptation measures to increase the resilience of affected areas; 4) introduction of land-use change; and, 5) other options. Prioritize improvement projects by area. Determine in what order the preferred flood protection measures should be implemented and at what point in time. There are likely to be severe damages associated with a “do nothing” approach.
- Develop detailed floodplain maps and revise FCLs. Identify in more detail how flood hazards will change over time (assuming present infrastructure in place). Prepare floodplain maps that illustrate how flood extent and depth could change over time to inform planners and the public about potential changes that may occur due to climate change.
- Carry out risk assessments that include social, cultural, environmental losses and loss of life from a sudden dike /sea dam failure.
5.2 Development of a Flood Adaptation Strategy
A long-term flood adaptation strategy is needed that Surrey can gradually implement over time. The strategy must be flexible and allow for adjustment based on actual changes to sea levels, runoff, subsidence and land use. It must involve assessing the status of the existing flood protection and plan how to protect against, accommodate or retreat from future flood levels. The strategy must prioritize upgrades based on cost/benefit ratios, sustainability and socio-economic perspectives, and involve a wide group of stakeholders.
Surrey has recently initiated a three-year project (2016-2018) to develop this strategy, organized around a participatory, stakeholder-driven decision process, involving the development, evaluation, and prioritization of flood scenarios and adaptation strategies. By incorporating stakeholder values and interests from the start, it is hoped that stakeholders will support the final strategy and that Surrey will have community and industry buy-in. Given the complexity of the issues this work will address, the planning process is adaptive and flexible, and able to accommodate new stakeholders and information as it moves forward (City of Surrey 2017). Main stakeholder groups include regulatory and supporting agencies and departments within all levels of government (federal, provincial, municipal, First Nations), utilities, transportation companies, businesses, landowners, and non-government organizations with interests in agriculture, environment and recreation.
Figure 10 illustrates how the decision process will proceed, starting with education and awareness, building around flood hazards and adaptation options, and iteratively narrowing down to the preferred strategy via a process that is driven by stakeholder values, informed by technical expertise, and attentive to practical constraints.
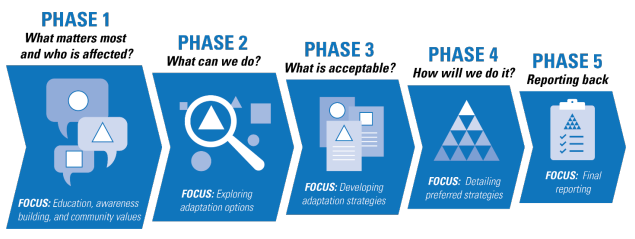
Figure 10. Five phased approach to developing a strategy (by EPI)
text version
- Phase 1 What matters mosts and who is affected?
- Focus: Education, awareness building, and community values
- Phase 2 What can we do?
- Focus: Exploring adaption options
- Phase 3 What is acceptable?
- Focus: Developing adaptation strategies
- Phase 4 How will we do it?
- Focus: detailing preferred strategies
- Phase 5 Reporting back
- Focus: final reporting
In Phase 1, flood hazard issues will be reviewed and Surrey will begin exploring what matters to stakeholders (i.e., their values and objectives). At this stage, the project team will work with stakeholders to co-create scenarios (i.e., plausible outcomes for the future). These scenarios will clarify how climate change may impact Surrey, help elicit stakeholder values that are at risk, and begin exploring how these impacts could potentially be managed through a variety of adaptation options.
In Phase 2, the options identified in the first phase of work will be further developed, modelled and tested, and any relevant trade-offs will be identified. This will include a considerable technical component with detailed analysis and modelling involved.
Stakeholder analysis and evaluation will continue in Phase 3, as Surrey moves from developing adaptation options to developing adaptation strategies. Modelling and data visualization (2D and 3D) will support the process of refining, co-developing and packaging a strategy that is both supported by stakeholders and technically feasible.
In Phase 4, a small number of robust, broadly supported adaptation strategies will be refined into preferred strategies based on cost, funding and partnerships. Finally Phase 5, the final reporting and visual materials of the preferred strategy will be developed and delivered through broad outreach and communications.
References
Ausenco Sandwell, 2011. Sea Dike Guidelines. Technical report prepared for BC Ministry of Environment.
City of Surrey, 2017. Surrey Coastal Flood Adaptation Strategy (CFAS) Primer (PDF 568 kb). 15 pp. (Accessed online 24-Feb-2017)
KPA Engineering Ltd. (1993) 1994. Floodplain Mapping Program Serpentine and Nicomekl Rivers. Design Brief. Report prepared for BC Environment Water Management Division.
NHC, 2015. Serpentine & Nicomekl River Climate Change Floodplain Review Phase 2. Final Draft Report.
Report prepared for City of Surrey, 6 March 2015. 128 pp + Appendices.
NHC, 2012. Serpentine, Nicomekl & Campbell Rivers – Climate Change Floodplain Review. Final Report.
Report prepared for City of Surrey, December, 2012. 150 pp + Appendices.
Rodenhuis, D, Bennett, K.E., Werner, A., Murdock, T.Q., Bronaugh,D. 2007. Hydroclimatology and future climate impacts in British Columbia. Pacific Climate Impacts Consortium.
Annex B: Flood Mapping and Climate Change Case Study: Integration of Climate Change in Flood Mapping in British Columbia’s Lower Mainland – Fraser River and Coast
March 2017
Prepared by: Fraser Basin Council & Northwest Hydraulic Consultants Ltd.
Inside
- Executive Summary
- Introduction
- Current Fraser River and Coastal Flood Hazards in the Lower Mainland
- Climate Change Projections of Lower Fraser River and Coastal Flood Hazards for Year 2100
- Flood Mapping for the Lower Mainland Vulnerability Assessment
- Conclusions, Lessons Learned and Recommendations
- References
Acknowledgements
The Fraser Basin Council would like to acknowledge Natural Resources Canada for providing the financial support for the development and publication of this case study.
The case study was developed with contributions from the following organizations and individuals:
- Northwest Hydraulic Consultants Ltd.: Monica Mannerström, Malcolm Leytham, Neil Peters, Mariza Costa Cabral, Vanessa O’Connor, Sarah North and Charlene Menezes
- Fraser Basin Council: Jessica Shoubridge, Steve Litke and Denise Palmer Hoskins
- Tracey Hooper (editor).
Design by Roxy Design
Flood Reports & Maps Online
Reports and maps related to this case study can be found in the resource section of the Lower Mainland Flood Management Strategy web page.Visit floodstrategy.ca
Contact Us:
For more information on this case study, contact:
Steve Litke , Senior Program Manager, Watersheds and Water Resources
T: 604 488-5358 | E: slitke@fraserbasin.bc.ca
www.fraserbasin.bc.ca
Executive Summary
This case study has been developed as part of the Federal Floodplain Mapping Guidelines Series to inform individuals and organizations involved in flood mapping and flood management in Canada.
The case study covers the area known as the Lower Mainland of British Columbia (B.C.). Two flood hazards are profiled: a Lower Fraser River flood (associated with the spring freshet as a result of snowmelt and spring precipitation in the Fraser River Basin) and a coastal flood (associated with a winter storm surge event). Flood modelling and mapping was completed for both present-day scenarios and for projections for the year 2100 under a “moderate climate change” scenario. Global sea level rise is incorporated into year 2100 river and coastal flood scenarios.
The flood modelling and mapping that is outlined in this case study was undertaken to better understand the effects of climate change on Lower Fraser River and coastal flooding and to inform a regional-scale vulnerability assessment. Mapping the extent and depth of flooding associated with current and future flood scenarios was a key component of assessing the vulnerability of people, buildings, infrastructure and the economy to flood events. This is part of the larger Lower Mainland Flood Management Strategy initiative, which is intended to better manage flood risk in communities along the Lower Fraser River and south coast of B.C. The Fraser Basin Council serves as the facilitator and coordinator of this initiative.
The Fraser River is the largest river on the west coast of Canada, and with a basin area of more than 230,000 km2 , it drains approximately one-quarter of British Columbia.
The flood modelling and mapping outlined in this case study was undertaken to better understand the effects of climate change on Lower Fraser River and coastal flooding and to inform a regional-scale vulnerability assessment - part of the Lower Mainland Flood Management Strategy
The Fraser River flood of written record occurred in 1894 and had a peak flow of about 17,000 metres3/second (m3/s) at Hope. The flood is estimated to have a return period of about 500 years (or a 0.002 annual exceedance probability) and has been adopted as the design flood for the river.
For the flood mapping described in this case study and developed for the flood vulnerability assessment, a simplified approach for estimating design coastal levels was adopted. Based on frequency analysis of observed records (tide + storm surge at Point Atkinson), the 500-year flood level was established. A nominal allowance of 0.6 m was added to address uncertainties from waves, datum adjustments, uplift and subsidence. This flood level was applied uniformly to all coastal regions of the Lower Mainland and was projected horizontally inland assuming an absence of dikes.
Climate change can affect flood hazards in various ways: altering the timing, frequency and magnitude of peak flows by increasing the intensity and duration of precipitation, altering evapotranspiration rates, affecting ground absorption, changing snowmelt rates, and increasing coastal hazards (sea level rise, increased frequency or severity of storm surges and storminess). In the future (year 2100), regardless of potential decreases in total snowpack, peak flows at Hope are projected to increase in the spring due to earlier and more intense snowmelt in combination with heavier spring rainfall. Ocean levels are also projected to increase as a result of sea level rise. Both conditions will lead to more severe peak flood levels in the Lower Mainland. Section 3 of this report outlines the steps taken to estimate the influence of climate change on both Lower Fraser River and coastal flood levels.
The flood mapping outlined in this case study was not detailed floodplain mapping and was not used for official designation of floodplains, new dike design profiles or Flood Construction Levels. The purpose was to support a regional assessment of flood vulnerabilities and inform the development of a regional flood management strategy. Section 4 of this report briefly outlines data inputs, some data gaps and other aspects of the methodology associated with mapping the extent and depth of flooding.
The following are some key findings of the flood mapping:
- Due to the topography of the Lower Mainland, the two future flood scenarios (year 2100) that incorporate the effects of climate change show relatively minor increases in the extent of inundation areas compared to present conditions. However, climate change will significantly increase the frequency of flood events and the depth of inundation.
- Fraser River freshet flooding affects an area three times greater than that in the equivalent coastal scenarios.
- The present extents of both Fraser River and coastal flooding highlight the need for greater flood mitigation action across the region as soon as possible.
- The mapping facilitated the estimation of total economic losses associated with buildings, agriculture, cargo shipping, infrastructure and critical facilities for the four flood scenarios, as summarized in the vulnerability assessment.
Floodplain maps typically provide a snapshot of a river and its floodplain at the time the maps are prepared. It is difficult to predict how the Lower Fraser River channel and floodplain will change over time. The accuracy of the maps is also a function of the tools (i.e., survey and numerical modelling methods) available at the time of mapping. As tools improve and physical and meteorological conditions change, floodplain maps need to be updated. In a changing climate, this becomes even more critical in that maps need to be regularly updated based on updated emissions scenarios, global climate model results and other emerging information.
This case study illustrates a method to account for climate change effects on peak river flood flows and ocean levels. The results provide a plausible picture of present and future flooding, and allow for estimation of associated economic losses to illustrate the importance of developing a flood management strategy for British Columbia’s Lower Mainland.
The most significant effect of climate change on flooding in the Lower Mainland is the increased frequency of large coastal and riverine flood events, exacerbating already significant flood risks. Reassessment of the design flood, accounting for climate change effects, is necessary. This case study (and supporting projects and referenced studies) conclude that Fraser River extreme peak flows will likely increase as a result of climate change by the year 2100.
It is recommended that more accurate, official floodplain maps for the Lower Fraser River and south coast be prepared using up-to-date information and the latest technology, and including the integration of climate change effects
To develop and apply more accurate, official floodplain maps that account for the effects of climate change, the following three key activities are recommended:
- Review and prioritize data limitations and uncertainties
- Undertake ongoing research to address priority data limitations and uncertainties
- Consider development and adoption of interim design flood profiles for Lower Fraser River flood hazards and coastal flood hazards, accounting for climate change effects, to be used for official floodplain mapping, land use planning and flood protection upgrades
1. Introduction
1.1 Context and Objective of the Case Study
This case study has been developed as part of the Federal Floodplain Mapping Guidelines Series to inform individuals and organizations involved in flood mapping and flood management in Canada.
1.2 Geographic Scope – the Lower Mainland of British Columbia
This case study covers the area known as the Lower Mainland of British Columbia (B.C.), which specifically includes the communities in the area extending from Hope (eastern extent) to Richmond and Vancouver (western extent) and from White Rock (southern extent) to Squamish (northern extent). The two flood hazards profiled include a Lower Fraser River flood (associated with the spring freshet as a result of snowmelt and spring precipitation in the Fraser River Basin) and a coastal flood (associated with a winter storm surge event). In total, four flood scenarios are considered: two baseline or present-day scenarios and two based on current projections for the year 2100, as summarized below. Global sea level rise (or mean sea level rise) is incorporated into both future flood scenarios.

Figure 1: Study Region
Text version
Figure 1: Study Region
This image is a topographical map highlighting specific areas with green shading, likely representing areas of interest or regions of focus, such as flood plains or environmental zones. The map covers a large region, possibly the Lower Mainland in British Columbia, including areas like Delta, Surrey, Richmond, and extending towards Chilliwack. The green shaded regions are bordered by a blue outline, indicating their boundaries.
- Coastal Flood Scenarios (still water level)
- Scenario A – Present-day (3.4 metres geodetic datum)
- Scenario B – Year 2100 (4.4 metres geodetic datum)
- Lower Fraser River Flood Scenarios
- Scenario C – Present-day (peak flow of 17,000 metres 3 /second at Hope, B.C.)
- Scenario D – Year 2100 (peak flow of 19,900 metres 3 /second at Hope, B.C.)
1.3 Lower Mainland Flood Management Strategy
The Lower Mainland Flood Management Strategy (the Strategy) is an initiative that began in 2014 to better manage flood risk in communities along the Lower Fraser River and south coast, from Hope to Richmond and Vancouver, and from Squamish to White Rock. Partners in this inter-jurisdictional initiative have responsibilities or interests that relate to flood management, and include the Government of Canada, the Province of British Columbia, almost 30 local governments and several other entities in
the region, including those focused on transportation systems, agriculture and business. The Fraser Basin Council (FBC) serves as the facilitator and coordinator of this initiative. FBC is a non-governmental, not-for-profit organization that has as its mandate to advance sustainability throughout British Columbia, with a focus on the Fraser River Basin. The Council has no legislative authority or regulatory role in flood management, so it is well positioned to serve as an impartial third party to facilitate dialogue and collaboration across the many jurisdictions and stakeholders that have interests in flood management.
The Strategy is intended to identify opportunities to strengthen flood management policies and practices, as well as flood protection infrastructure across the Lower Mainland. An integrated, collaborative approach to flood protection is critically important, given the changing flood risks that Lower Mainland communities face and given that a major flood would have serious social, economic and environmental consequences for the entire region and national economy. Flood management policies and practices are important to protect public safety, reduce potential loss of life, minimize flood damages to buildings, infrastructure and other assets, minimize associated financial losses, and avoid the immeasurable social hardship and environmental damages associated with flooding. A coordinated approach across a regional scale will be more efficient and effective than for all municipalities and other organizations to independently pursue flood mitigation and climate adaptation. Although the Strategy does not preclude or replace independent action undertaken by local authorities, a regional-scale approach has the potential to eliminate redundancies, identify and address data gaps, and consider the effects of flood mitigation actions in one area on other areas. For example, would building or upgrading a dike in one area increase flood risk for neighbouring communities either upstream, downstream or across the river?
There are two phases to the Strategy development. Phase 1 (2014−2016) built a better understanding of flood hazards in the Lower Mainland, identified flood vulnerabilities across the region, and assessed flood management practices and policies from a regional perspective. In Phase 2 (June 2016 onward), an action plan will be developed based on the work from Phase 1 and further work in Phase 2. Phase 2 is focused on identifying priorities, evaluating management options and developing a cost- sharing model for implementation. Two projects from Phase 1 form the basis of this case study: 1) a simulation of the effects of climate change on both Fraser River and coastal flood scenarios, and 2) an assessment of the vulnerability of communities and infrastructure to present-day and future flood scenarios. Mapping the extent and depth of flooding under the flood scenarios was a key component of assessing the flood-related vulnerability of people, buildings, infrastructure and the economy.
2. Current Fraser River and Coastal Flood Hazards in the Lower Mainland
2.1 Fraser River Design Flood Scenarios
The Fraser River is the largest river on the west coast of Canada, and with a basin area of more than 230,000 km 2 , it drains approximately one-quarter of British Columbia. The river starts in the Rocky Mountains and flows over a distance of 1,100 km to the Pacific Ocean. At Hope, roughly 165 km from the coast, the river exits a steep canyon and enters the Fraser Valley, first flowing through a gravel-bed reach to just upstream of Mission, then transitioning to a sand bed. Before discharging into the Pacific Ocean, the river divides into four outlet arms: the North, Middle and South Arms, plus Canoe Pass.
The Fraser River has flooded the Lower Mainland in the past and is now largely diked, although most of the dikes do not meet current design standards. The Fraser River flood of written record occurred in 1894 and had a peak flow of about 17,000 metres 3 / second ( m3/s) at Hope. The flood is estimated to have a return period of about 500 years (or a 0.002 annual exceedance probability) and has been adopted as the design flood for the river. As a result of inflows from the Harrison and Chilliwack Rivers and other smaller tributaries, the design flow increases in the downstream direction and at Mission a flow of 18,900 m3/s has generally been adopted as the design flow.
Large floods on the Fraser River have historically occurred in the spring (typically May–June), primarily as a result of snowmelt. Several factors contribute to large floods on the river, including:
- large, saturated snowpacks throughout the Fraser River Basin, particularly in the Upper Fraser and Nechako River sub-basins
- high soil moisture content, which limits absorption
- cool weather followed by a significant and sustained warm period that causes rapid and continuous melting, and
- rainfall that coincides with the period of snowmelt, which adds water to the river flow and increases the rate of snowmelt.
The Fraser Valley is densely developed and contains major transportation corridors. Flood vulnerability is high, and a recurrence of the flood of record would lead to significant economic losses (NHC 2016). Over the past decade, a number of important studies have been conducted to assess flood hazards in the Lower Fraser River. In 2005-2006, the Fraser Basin Council, the B.C. Ministry of Environment (and later the Ministry of Forests, Lands and Natural Resource Operations) and other partners retained Northwest Hydraulic Consultants Ltd. (NHC) to develop a hydraulic model of the Fraser River downstream of Hope to 1) estimate the Fraser River design flood profile, and 2) forecast flood levels in real-time during the snowmelt season in years of elevated flood risk (NHC 2006, 2008a, 2008b, 2014a). The model simulates water levels along the river for selected inflows at Hope and major tributaries, and ocean levels at the outlets. The Lower Fraser River hydraulic model, recalibrated in 2008 and updated for the gravel reach in 2014, forms a key tool for estimating flood levels under present conditions and projecting the climate change effects on future levels.
To estimate the Fraser River design profile, two conditions were modelled: 1) the estimated flow during the 1894 flood, combined with a high spring tide (the freshet condition), and 2) the 200-year winter storm surge with high tide, combined with a Fraser River winter flow (the winter condition). The two profiles (i.e., water surface elevations) were then overlaid, and the higher of the two values was used to develop an overall design flood profile for the river. Through most of the 165-km model reach, the design profile is set by the freshet condition, and only near the coast, over a distance of less than 30 km from the outlets, is the winter profile higher. For the winter modelling, a statistical analysis of storm surges and astronomical tide levels was originally conducted using the Empirical Simulation Technique developed by the U.S. Army Corps of Engineers (NHC 2006). For subsequent work (NHC 2014a), coastal levels were updated based on work completed for the City of Vancouver (NHC 2014b).
As far upstream as Mission, about 85 km from the ocean, water levels are tidally influenced, and a small diurnal swing can be detected even at high flows. However, maximum flood levels are a function of peak flows during the spring freshet rather than the ocean levels. For the design of dikes and other structures along the river, the distinction between freshet and winter conditions is important to keep in mind.
2.2 Coastal Storm Surge Design Flood Scenarios
For the flood mapping described in this case study and developed for the flood vulnerability assessment, a simplified approach for estimating design coastal levels was adopted. Based on frequency analysis of observed records (tide + storm surge at Point Atkinson), the 500-year flood level was established. A nominal allowance of 0.6 m was added to address uncertainties from waves, datum adjustments, uplift and subsidence. This flood level was applied uniformly to all coastal regions of the Lower Mainland and was projected horizontally inland assuming an absence of dikes.
It is recognized that, in addition to high tidal levels combined with storm surge, coastal flood levels are influenced by:
- high winds, resulting in wind setup, and
- large wave run-up, compounding ocean water levels.
Local conditions can significantly influence water levels for a given coastal storm event. For example, the exposure of the shoreline to high winds and wave effects can result in higher water levels compared with more sheltered areas. The geometry of the shoreline will also influence water levels. For a more detailed assessment, local analyses are required. Land subsidence and uplift will also influence relative sea level.
3. Climate Change Projections for Lower Fraser River and Coastal Flood Hazards (Year 2100)
Climate change may affect flood hazards in several ways, altering the timing, frequency and magnitude of peak flows by increasing the intensity and duration of precipitation, altering evapotranspiration rates, affecting ground absorption, changing snowmelt rates and increasing coastal hazards (sea level rise, increased frequency and severity of storm surges and storminess). In an effort to project how climate change may affect flood levels along the Lower Fraser River for the year 2100, the first steps were to estimate future inflows at Hope and at the tributaries, estimate future ocean levels, and run the Lower Fraser River hydraulic model using the revised flow and ocean boundary conditions.
By year 2100, regardless of potential decreases in total snowpack, peak flows at Hope are projected to increase in the spring due to earlier and more intense snowmelt, in combination with heavier spring rainfall. Ocean levels are also projected to increase as a result of sea level rise. Both conditions will lead to more severe peak flood levels along the river. The following sections describe the procedures for estimating future flood conditions.
Figure 2: Steps in Estimating the Impacts of Climate Change on Future Flood Extents and Depths
Step 1
Identify Relevant Greenhouse Gas Emissions Scenario

Step 2
Identify Related Climate Change Projections
Key Projections:
- Temperature
- Precipitation
- Sea Level
- River Hydrology
Step 3
Calculate Water Levels for Fraser River and Coastal Flood Scenarios

Step 4
Map Flood Depth and Extent
3.1 Future Fraser River Freshet Flows
The 2014 report Simulating the Effects of Sea Level Rise and Climate Change on Fraser River Flood Scenarios (NHC 2014a) describes the steps taken to estimate boundary conditions for large floods, first for present conditions and then for projected future conditions under different climate change scenarios.
The values for present conditions were based on the analysis of historical records, whereas future values were estimated based on the following steps:
- For a range of future greenhouse gas emission scenarios, projections of regional temperature and precipitation are available from the Pacific Climate Impacts Consortium (PCIC). Based on hydrologic models that use projected atmospheric and watershed characteristics as inputs, future flood flows under climate change can be simulated. Different hydrologic model results were reviewed, and it was found that future daily flows generated by Shrestha et al. (2012) were most suitable. The hydrologic Variable Infiltration Capacity model that was used and the downscaled climatic inputs have a high temporal and spatial resolution. Although the work has some shortcomings, as described in NHC (2014a), it provided the preferred method.
- Of the many simulations carried out by Shrestha et al. (2012), two future climate scenarios were selected based on recommendations by PCIC (Murdock and Spittlehouse 2011: a moderate climate change scenario and an intense climate change scenario. HadGEM A1B (Run 1) represents an appropriate example of “intense” climate change. It produced increases in peak flow quantiles near the upper end, albeit not the very highest. HadCM3 B1 (Run 1) produced increases in peak flow quantiles that are close to the median. It represents an appropriate example of “moderate” climate change. Both runs are from phase 3 of the Coupled Model Intercomparison Project (CMIP3) Footnote 1b.
- To estimate future (year 2100) design flood flows with return periods of 50, 100, 200, 500, 1,000, 5,000 and 10,000 years, frequency analyses that fitted a log-Pearson III distribution to the series of projected annual maxima were conducted for the two selected climate scenarios (i.e., moderate and intense). This allowed comparison of present and future design flows and estimation of percentage increases in flows. Footnote 2b,Footnote 3b
3.2 Future Ocean Levels
There is significant uncertainty in global sea level rise projections, and the amount of uncertainty increases the further we project into the future. A study commissioned by the Province of B.C. (Ausenco Sandwell 2011) projected a sea level rise of 0.5 m by year 2050, 1.0 m by year 2100, and 2.0 m by year 2200. These projections are higher than the latest Intergovernmental Panel on Climate Change projections (2014) for year 2050 and 2100 but are lower than other, more recent projections that take into account ice sheet dynamics and increasing potential for ice sheet collapse.Footnote 4b
For the 2014 study Simulating the Effects of Sea Level Rise and Climate Change on Fraser River Flood Scenarios (NHC 2014a), the projected sea level rise was added to the hourly time series of ocean levels specified at the hydraulic model’s downstream boundary. The effect of sea level rise was simulated for scenarios with 0 m, 0.5 m, 1.0 m, 1.5 m and 2.0 m of change in ocean water levels. For the Lower Mainland flood vulnerability assessment, the projected sea level rise of 1 m by year 2100 was added to the estimated present ocean water levels.
Portions of the coastal Lower Mainland, particularly the Fraser River delta, are gradually subsiding. As mean global sea level rises and subsidence occurs, relative sea level rise is amplified, resulting in increased flooding and erosion in coastal environments. In particular, subsidence due to sediment consolidation can play a significant role in relative sea level rise in large deltas. Amplifications and strong spatial variations in relative sea level rise need to be considered in local and regional planning (Mazzotti et al. 2009). The work completed to date did not estimate the location and magnitude of subsidence and uplift, which would be recommended for more detailed analysis and mapping to designate official floodplain areas, accounting for relative sea level rise.
3.3 Integrating Climate Change Effects within Lower Fraser River Hydraulic Modelling
To integrate climate change effects, future projected inflows and ocean levels were used as boundary conditions in the numerical hydraulic model. The model represents the river channel bathymetry and floodplain topography, and allows computation of water levels along the river for different flows and downstream water levels using an unsteady-flow backwater algorithm.
The B.C. Ministry of Forests, Lands and Natural Resource Operations ran the Lower Fraser River hydraulic model for each of the 140 flood scenario profiles presented in the 2014 report Simulating the Effects of Sea Level Rise and Climate Change on Fraser River Flood Scenarios (NHC 2014a). These flood profiles cover a range of flood magnitudes (1:50 to 1:10,000 annual exceedance probabilities corresponding to “no climate change,” “moderate climate change” and “intense climate change”) and different sea level rise scenarios (0 m, 0.5 m, 1.0 m, 1.5 m and 2.0 m). Corresponding water levels were estimated at more than 1,000 locations along the Lower Fraser River. From the analysis outlined above, four flood scenarios were selected to be modelled and mapped (See Table 1).
| Scenario | Hazard Type | Time Period | Comment |
|---|---|---|---|
| A | Coastal | Present | 1:500 AEP a ocean level = 3.4 m GSC b (still water level) c |
| B | Coastal | Future (2100) | 1:500 AEP ocean level = 4.4 m GSC (still water level) |
| C | Fraser Freshet | Present | Approximate 1:500 AEP Fraser flood (recurrence of 1894 flood of record with a peak flow of 17,000 m 3 /s at Hope, B.C.) |
| D | Fraser Freshet | Future (2100) | 1:500 AEP flood + adopted climate change flow increase (17% with a peak flow of 19,900 m 3 /s at Hope, B.C.) and 1-m sea level rise |
- AEP refers to annual exceedance probability, which is the chance or probability of a natural hazard event (in this case, flooding) occurring annually, and is usually expressed as a percentage. A 1-in-500 AEP event has a 0.2% chance of occurring in a given year.
- GSC refers to Geodetic Survey Canada datum.
- Still water level refers to the combination of high tide and storm surge, but does not include localized wave effects.
The following are some observations from this analysis:
- Sea Level Rise:
Within the range of scenarios considered (0−2 m), sea level rise can have a significant effect on flood levels and dike design profiles as far upstream as the Sumas River confluence (about 90 km upstream from the mouth of the Fraser River). Therefore, communities in the middle and lower Fraser Valley need to consider sea level rise as part of long-term flood management planning. - Increased Peak Flows:
The modelling indicated that Fraser River flood levels are quite sensitive to increased river flows at Hope. For example, the “moderate climate change” scenario increases flood water levels by more than 1 m at the District of Mission, in comparison to historical floods of the same annual exceedance probability. The modelling assumed that all dikes are raised to contain even the highest flows, which essentially eliminates floodplain storage and any attenuation of flood peaks. For the increased future flows, adjustment of hydraulic model parameters, particularly at bridges, should be carried out, but this was not done in this analysis.
As sea levels rise, the transition point in the Fraser River — where the winter flood scenario results in higher flood levels than the spring/summer freshet flood scenario — will gradually shift upstream, but only by a few kilometres.
3.4 Uncertainties in Projecting Climate Change Effects on Flood Flows
While there is a need to provide quantitative information for flood protection planning, the underlying projections of climate change are subject to a large degree of uncertainty. The main sources of uncertainty related to flow estimates are:
- unknown future levels of greenhouse gas emissions
- uncertain response of the global climate system to increases in greenhouse gas concentrations
- downscaling, in space and time, of global climate model- projected climate variables and incomplete understanding of regional manifestations that will result from global changes
- application of the hydrologic model
- extrapolation of frequency analyses to extreme return periods.
The hydrologic projections developed should be considered to be plausible representations for the year 2100, given the best available current scientific information, and do not represent specific predictions. The actual future streamflows for the Fraser River at Hope will differ from the projected scenarios.
One of the largest uncertainties in assessing potential future effects of climate change on Fraser River flooding is the wide range in outputs from the various global climate models and emission scenario runs and the correspondent variability in Fraser River peak flow estimates for a given annual exceedance probability. The “moderate climate change” run in Simulating the Effects of Sea Level Rise and Climate Change on Fraser River Flood Scenarios (NHC 2014a) resulted in increases of 17% over the current design flood. However, the projected flow increases for the different global climate model runs varied from a few percent to more than 30%.Footnote 5b
The updated study by Shrestha et al. (2015) provides further insight into what percentage flow increases are applicable. The study used more recent global climate model output from a larger number of models for each of the three emission scenarios (referred to as Representative Concentration Pathways [RCPs]). As in the earlier study (Shrestha et al. 2012), the range of results was quite broad. For example, the projected increase in the 1:500 annual exceedance probability flow for the Fraser River at Hope for RCP4.5 ranged from -5% to 38%, with a median increase of 12%.
The Association of Professional Engineers and Geoscientists of British Columbia’s Professional Practice Guidelines – Legislated Flood Assessments in a Changing Climate in BC (APEGBC, 2012) suggest that practitioners should apply a factor of 10% to the design flood estimates for protective works based on historic data to account for climate change unless more detailed climate change information is available.
Given the information developed by the projects related to this case study, and the recent Shrestha et al. (2015)/PCIC work and the APEGBC guidelines, it would seem appropriate for provincial authorities to formally acknowledge climate change effects on Fraser River peak flows and consider how and when to revise the official design flood profile for the Lower Fraser River to inform dike design and land use management guidelines for flood hazard areas.
The flood modelling and mapping completed was undertaken for a regional-scale flood vulnerability assessment. It includes a number of data limitations and sources of uncertainty; therefore, it is recommended that the hydraulic modelling and subsequent flood extent and depth mapping be supplemented by more detailed analysis and periodic updates. The uncertainty associated with accumulation of greenhouse gases in the Earth’s atmosphere is only one factor when projecting climate change effects on flood flows. A number of other uncertainties may affect results. Northwest Hydraulic Consultants Ltd. (NHC, 2014a) recommended several items be considered in future analysis, including:
- tests of the Variable Infiltration Capacity hydrologic model accuracy, particularly for high-flow events
- analysis of land cover changes, such as those associated with beetle infestations or widespread fires (and how this in turn influences infiltration and runoff levels)
- analysis of climate change effects on tributary flows into the Lower Fraser River.
4. Flood Mapping for the Lower Mainland Vulnerability Assessment
As noted, the flood modelling described in this case study was not intended to develop detailed floodplain mapping for official designation of floodplains, new dike design profiles or Flood Construction Levels. The purpose of the mapping was to help decision-makers and the public better understand the significance of climate change on flood hazards in B.C.’s Lower Mainland, to conduct a regional assessment of flood vulnerabilities and to support the development of a regional flood management strategy. Deriving credible monetary loss estimates was a main objective of the flood mapping, in addition to exploring other social, economic and environmental effects.
As outlined in Section 1, flood mapping was produced for four scenarios: present-day and year 2100 coastal flooding, and present-day and year 2100 Lower Fraser River flooding. This section briefly outlines data inputs, some data gaps and other aspects of the methodology associated with mapping the extent and depth of flooding.
Deriving credible monetary loss estimates was a main objective of the flood mapping, in addition to exploring other social, economic and environmental effects.
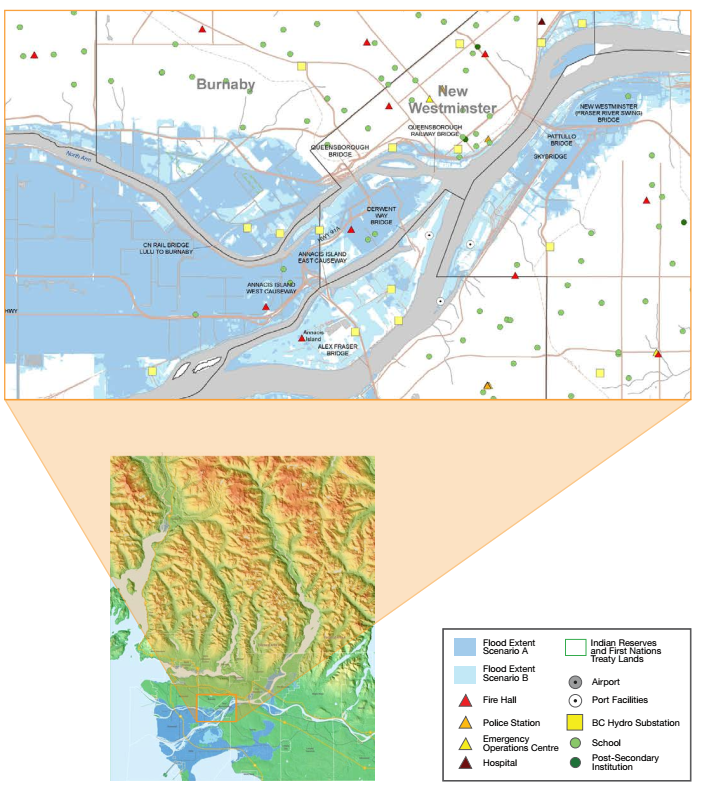
Map 1: Extent of Flood under Coastal Flood Scenarios (Present Day and Year 2100)
Text version
Map 1: Extent of Flood under Coastal Flood Scenarios (Present Day and Year 2100)
This image provides a detailed map focusing on flood scenarios and critical infrastructure in the Burnaby and New Westminster areas. Here's a breakdown of the key elements:
- Flood Extent Scenarios:
- Scenario A: Represented in a light blue shade.
- Scenario B: Represented in a darker blue shade.
- Infrastructure:
- Bridges: Various bridges including Queensborough, Derwent, Annacis Island East/West, Alex Fraser, New Westminster Railway, and Pattullo bridges are marked.
- Emergency Services:
- Fire Hall: Red triangles.
- Police Station: Yellow triangles.
- Emergency Operations Centre: Yellow squares.
- Hospital: Red squares.
- Other Facilities:
- Airport: Green circles.
- Port Facilities: Blue squares.
- BC Hydro Substation: Yellow circles.
- School: Yellow diamonds.
- Post-Secondary Institution: Green hexagons.
- Other Markings:
- Indian Reserves and First Nations Treaty Lands: Green shaded areas.
The map is zoomed into a specific area with a larger topographical context at the bottom, showing how it fits into the wider region. The legend in the bottom right corner explains the symbols used for different infrastructure and facilities.
Map 1 shows the extent of flooding on land in Burnaby, New Westminster and Annacis Island in Delta under Coastal Flood Scenarios A (Present Day – dark blue) and B (Year 2100 – light blue) for areas of the BC Lower Mainland that are vulnerable to coastal flooding. Infrastructure in the area includes firehalls, schools and BC Hydro substations. See Map 3 for a look at flood water depths in this sample area.
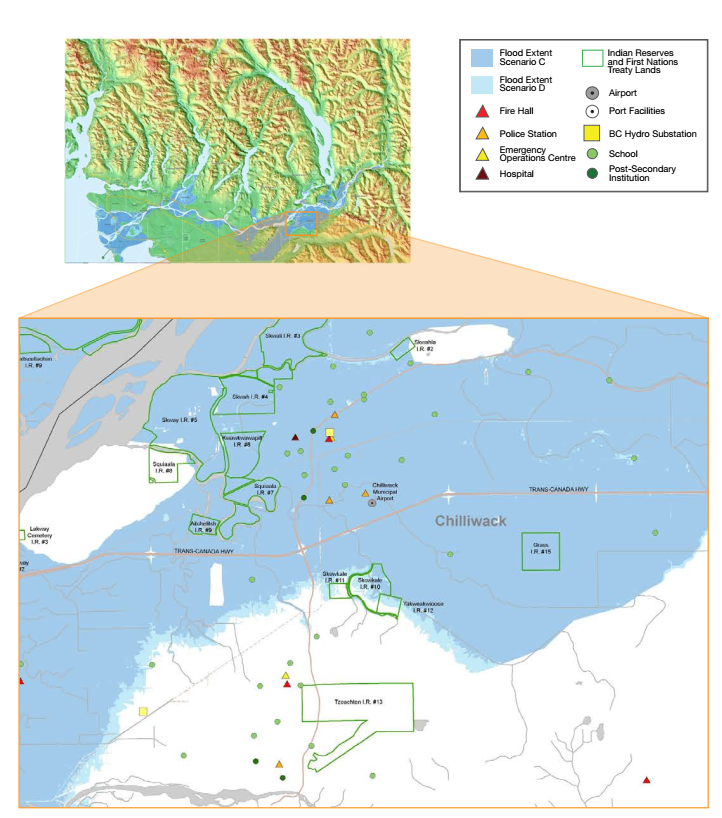
Map 2: Extent of Flood under Fraser River Flood Scenarios (Present Day and Year 2100)
Text version
Map 2: Extent of Flood under Fraser River Flood Scenarios (Present Day and Year 2100)
This image is a detailed map focusing on flood scenarios and critical infrastructure around the Chilliwack area. Here's a breakdown of the key elements:
- Flood Extent Scenarios:
- Scenario C: Represented in a light blue shade.
- Scenario D: Represented in a darker blue shade.
- Infrastructure:
- Emergency Services:
- Fire Hall: Red triangles.
- Police Station: Yellow triangles.
- Emergency Operations Centre: Yellow squares.
- Hospital: Red squares.
- Other Facilities:
- Airport: Green circles.
- Port Facilities: Blue squares.
- BC Hydro Substation: Yellow circles.
- School: Yellow diamonds.
- Post-Secondary Institution: Green hexagons.
- Indian Reserves and First Nations Treaty Lands: These areas are marked in green and labeled with their respective names.
The map zooms into the Chilliwack area, highlighting the flood extent scenarios and the locations of various critical infrastructures and services. The larger topographical context at the top shows the Chilliwack area within the broader region.
Map 2 shows the projected extent of flooding on an area of Chilliwack and in the First Nations communities of Skwah, Skway, Kwaw-kwaw-Apilt, Squiaala and Aitchelitch under Fraser River Flood Scenarios C (Present Day – dark blue) and D (Year 2100 – light blue). Flood would impact critical infrastructure, including the municipal airport, Trans-Canada Highway, firehalls, police stations and a BC Hydro substation. Projected flood water depth is shown in Map 4.
4.1 Topographic Data
Topographic data from various levels of government were obtained and processed, thinned and integrated into a digital elevation model of the lowlands across the Lower Mainland region. Footnote 6b For parts of some of the affected communities, no detailed topographic data were available. Crown corporations, non-profit organizations, and the Canadian digital elevation model data set from GeoGratis Footnote 7b (of lower resolution) provided topographic data that filled some of the gaps. The limited accuracy of some areas of the base topography added uncertainty to the flood extent and depth mapping.
4.2 Flood Levels
The four flood scenarios were adopted from the report produced by Kerr Wood Leidal (2015) Lower Mainland Flood Management Strategy – Analysis of Flood Scenarios.Footnote 8b
For the coastal scenarios, the designated flood levels were applied, assuming a horizontal water surface. All land below the designated flood level was assumed to be inundated. It was also assumed that all dikes in the entire region would be ineffective and that submergence would be near instantaneous. Significantly more effort would be required to perform area-specific dike breach analyses and detailed risk assessments.
In most coastal locations, it would likely take a number of hours before an entire lowland area became inundated. During a falling tide, flow would move through a breach in the opposite direction and partially drain water from the floodplain. Accurate assessment of the inundation would require detailed 2D modelling; the present overview-level work was not intended to evaluate specific breach scenarios. This is proposed as a next step in the development of the Lower Mainland Flood Management Strategy.
The existing hydraulic modelling of the Lower Fraser River assumed that flood flows were contained by the existing dikes. This assumption is generally conservative (i.e., it potentially overestimates flood levels) when applying the computed water levels to assess potential floodplain inundation. During an actual flood that breached the diking system, water would be conveyed and stored on the floodplain, and potentially would reduce the water levels in the river channel and in flooded areas. This confinement effect from dikes has been observed on many rivers, and it explains why the observed flood levels in 1894 were lower in many areas than under the current diked conditions. However, in some situations, ponding behind dikes could actually result in flood levels that are higher than in the river channel itself.
In most locations, river flood levels were projected perpendicularly across the floodplain, except in areas with available flood mapping, where the mapped isolines were used to guide flood level projections. The presence of diking was ignored, and flood levels were directly projected across the floodplain.
A number of limitations are associated with the flood levels that were mapped: Footnote 9b
- Coastal flood levels include an allowance of 0.6 m to account for uncertainties from local conditions (e.g., wind and wave setup, subsidence), which could be exceeded depending on the local shore geometry, wind/wave exposure and other factors.
- The intensity and frequency of storms may increase in the future as a result of a changing climate. However, there is much uncertainty about this aspect of future coastal flood hazards. Assessing this was not within the scope of this project.
- The coastal flood scenario for year 2100 incorporates a 1-m sea level rise based on provincially adopted guidelines (B.C. Ministry of Environment 2011).
- Coastal flood levels were projected horizontally, assuming the absence of dikes. Dikes protect many coastal areas, although the dikes generally do not meet provincial standards.
- For the future riverine flood scenario (2100), potential change in land cover (such as from beetle infestations, widespread fires) were not accounted for, which possibly resulted in an underestimation of the associated flood level from increased runoff.
- Dikes were assumed to be ineffective in the vulnerability assessment, yet river flood levels correspond to flows being confined between dikes. Simplified flood isolines were used to project river levels across the floodplain without attenuation, and all lands behind dikes below the adopted flood level were assumed to be submerged, which may not be the case.
- Simultaneous flooding on Fraser River tributaries was disregarded, although coinciding flood events could occur.
- There are limitations to the accuracy of the 1D hydraulic modelling. The assumption regarding dikes containing flood flows is not realistic unless extensive upgrades are conducted. A 2D model incorporating dike breach modelling would be more accurate.
- The channel and floodplain geometries have changed in the past and will continue to change in the future. During large floods, significant scour, deposition and avulsing may take place, which would alter the water surface profile. These changes were not accounted for in the analysis.
4.3 Mapping Procedures
Flood level ArcGIS TIN (triangulated irregular network) surfaces were created for each flood scenario. By subtracting the digital elevation model from the flood level surfaces, flood depths were determined. Similarly, flood extent polygons were derived from the flood depth surfaces. Isolated ponded areas that are a by-product of this technique, which would not occur in reality via overflow from a body of water, were not removed from the mapping. Typically, more precise methods of modelling and mapping would be used for a local-scale flood study. The methods and generalizations used in this overview-level study would not be appropriate for a detailed assessment.
Northwest Hydraulic Consultants Ltd. adapted the Japanese national standard (EXCIMAP 2007) for depth categories with some modification for the flood depth maps. Depth classes correspond to the hazard posed to structures, electricity, vehicles, people and associated evacuation. Depth classes that were mapped are set out in Table 2.
Flow paths across the floodplain were not modelled, and roads, railroads and other obstructions were not accounted for. Flood velocities were not modelled or mapped as part of this study. Flood velocities, along with depths, will affect the degree of flood hazard and associated damages and losses.
| Depth | Hazard Type |
|---|---|
| 0 to 0.5 m | Most houses are dry; walking in moving water or driving is potentially dangerous; basements and underground parking may be flooded, potentially causing evacuation. |
| 0.5 to 1.0 m | Water occurs on the ground floor; basements and underground parking are flooded, potentially causing evacuation; electricity has failed; vehicles are commonly carried off roadways. |
| 1.0 to 2.0 m | Ground floor is flooded; residents evacuate. |
| 2.0 to 5.0 m | First floor and often the roof are covered by water; residents evacuate. |
| > 5.0 m | First floor and often the roof are covered by water; residents evacuate. |
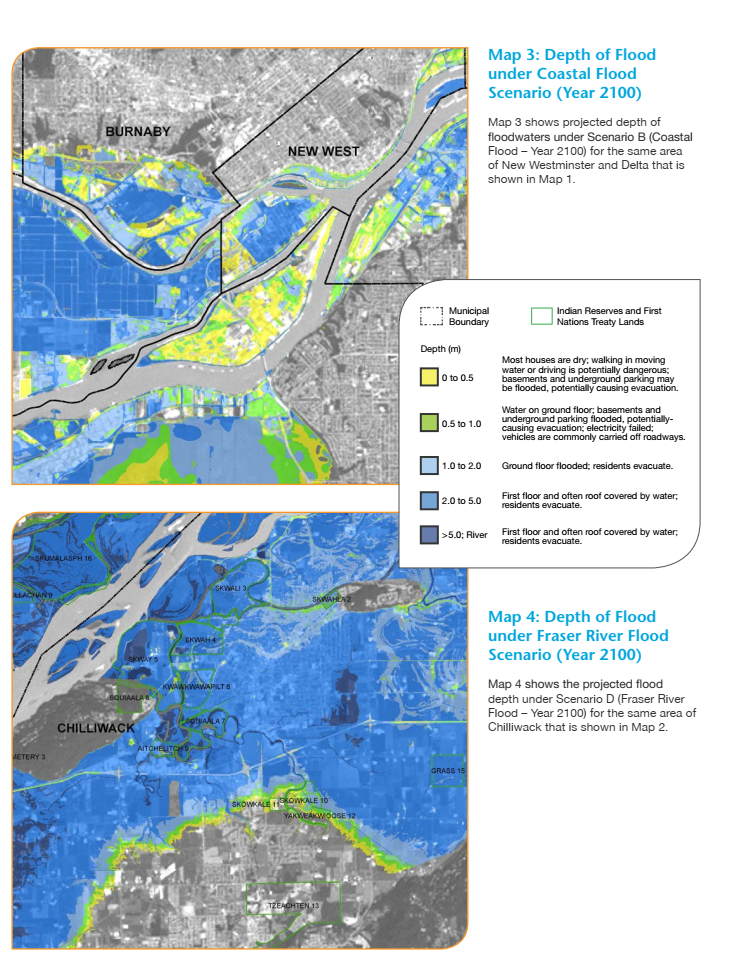
Text version
Map 3: Depth of Flood under Coastal Flood Scenario (Year 2100)
Map 3 shows projected depth of floodwaters under Scenario B (Coastal Flood – Year 2100) for the same area of New Westminster and Delta that is shown in Map 1.
Map 4: Depth of Flood under Fraser River Flood Scenario (Year 2100)
Map 4 shows the projected flood depth under Scenario D (Fraser River Flood – Year 2100) for the same area of Chilliwack that is shown in Map 2.
4.4 Summary of Results
The following are key findings of this study:
- Due to the topography of the Lower Mainland, the two future flood scenarios that incorporate climate change effects show relatively minor increases in the extent of inundation areas compared to present conditions. However, climate change will significantly increase the depth of inundation, and particularly the frequency of flood events.
- The Lower Fraser River freshet flooding affects an area three times greater than that in the equivalent coastal scenarios.
- The present extents of both Lower Fraser River and coastal flooding highlight the need for flood mitigation efforts to start as soon as possible.
- The mapping facilitated the estimation of total economic losses associated with buildings, agriculture, infrastructure and disrupted cargo shipping for the four flood scenarios, as summarized in NHC (2016). Economic losses increased significantly for year 2100 scenarios, primarily due to increased depth of flooding.
5. Conclusions, Lessons Learned and Recommendations
5.1 Conclusions
Floodplain maps typically provide a snapshot of a river and its floodplain at the time the maps are prepared. It is difficult to predict how the Lower Fraser River channel and floodplain will change over time. The accuracy of maps is also a function of the tools (i.e., survey and numerical modelling methods) available at the time of mapping. As tools improve and physical and meteorological conditions change, floodplain maps need to be updated. In a changing climate, this becomes even more critical, in that maps need to become more dynamic and readily updated over time based on updated emissions scenarios, global climate model results and other emerging information.
Recent advances in climate science offer some opportunity to forecast future flood conditions. This case study illustrates a method to account for climate change effects on peak river flood flows and rising ocean levels. It is important to keep in mind that the study maps prepared for the two present-day and two future (2100) flood scenarios are not official floodplain maps. Their purpose is to identify present and future flood vulnerabilities, assuming the river channel and floodplain do not change. The results provide a plausible picture of present and future flooding, and allow for estimation of associated economic losses to illustrate the importance of developing a flood management strategy for British Columbia’s Lower Mainland.
Based on global sea level rise estimates and Fraser River flood flow projections (e.g., to the year 2100), floodplain mapping that approximates future conditions can be prepared. However, these maps will not remain valid until year 2100 since climate projections and channel/floodplain conditions are likely to change. Regular map updates will be required.
5.5 Lessons Learned
The most significant effect of climate change on flooding in the Lower Mainland will result from the increased frequency of large coastal and riverine flood events. By the end of the century, under an intense climate change scenario, the Fraser River 50-year return period event could have the same magnitude (i.e., peak flow) as the current design flood, corresponding to the flood of written record (1894), which currently has a return period of 500 years. Reassessment of the design flood, accounting for climate change effects, will clearly be necessary.
This case study (and supporting projects and referenced studies) conclude that Fraser River extreme peak flows will likely increase as a result of climate change by the year 2100. Climate change, through increased peak river flows and rising sea levels (and the related increased frequency of flooding), exacerbates the already significant flood risks along the Lower Fraser River. The implications of larger magnitude, more frequent floods in the BC Lower Mainland are serious. A regional plan for effective flood management across the region is critical. A wide range of flood mitigation options will be examined in the Lower
Mainland Flood Management Strategy such as upgrades to dikes and related infrastructure, dike realignment and setbacks, land use management in floodplain areas, upstream storage/diversion, sediment management, green shores approaches and other innovations.
5.3 Recommendations
It is recommended that more accurate, official floodplain maps for the Lower Fraser River and south coast be prepared using up-to-date information and the latest technology, including integration of climate change effects.
To develop and apply more accurate, official floodplain maps that account for the effects of climate change, the following three key activities are recommended:
- Review and prioritize data limitations and uncertainties
- Undertake ongoing research to address priority data limitations and uncertainties
- Consider development and adoption of interim design flood profiles for Lower Fraser River and coastal flood hazards, accounting for climate change effects, to be used for official floodplain mapping, land use planning and flood protection upgrades
- Review and prioritize data limitations and uncertainties
The case study relied on a leading edge, defensible methodology for projecting climate change effects on flood flows. However, due to numerous data limitations and uncertainties, there is currently low confidence in numerical projections of changes in flood magnitude or frequency resulting from climate change (Kundewicz et al. 2013). This is particularly challenging for a large, hydrologically complex river basin such as the Fraser River Basin. Examples of data limitations and uncertainties include actual greenhouse gas emissions in the future, the effects of emissions on actual temperature, precipitation, river hydrology and sea level; relative sea level rise, factoring in localized uplift and subsidence; localized coastal flood levels, factoring in wind setup and wave effects; and topography. The accuracy of future analyses is expected to improve as more data on actual climate change and corresponding effects on river flood flows and ocean levels become available and as more detailed, local studies are undertaken.
- Undertake ongoing research to address priority data limitations and uncertainties
Due to numerous sources of uncertainty related to climate change projections and the influence of climate change on flood hazards, there is a rationale for periodic review and updates to integrate evolving science into flood modelling and mapping, flood vulnerability assessment, flood management policies and practices and climate adaptation.
It is recommended that present modelling and mapping be reviewed and updated as new information becomes available, including, but not limited to, updates on greenhouse gas emissions projections, and evolving climate science regarding projected changes in temperature, precipitation, river basin hydrology and sea level rise. With respect to mapping flood extent and depth, improved accuracy would also result from more accurate topographic data for some parts of the region.
The floodplain of the Lower Fraser River is a hydraulically complex area, where flood levels in one location are not only a function of river flows and ocean conditions, but also of dike failures and the degree of inundation in other floodplain areas. Actual flood depths and extents may be less or more than the modelled flood scenarios due to simplified assumptions. It is recommended that more detailed hydraulic modeling of floodplain areas, including dike breach simulations, be completed to develop more accurate estimates of the extent and depth of flooding in floodplain areas.
It is recommended that targeted research be undertaken to better understand projected changes in the frequency and magnitude of coastal storm surges, particularly storminess. In addition, consideration of local circumstances regarding land subsidence and uplift, as well as shoreline geometry and wind and wave exposure would improve the accuracy of flood mapping for coastal storm surges. The joint probability of coinciding high tide, storm surge, wind and wave setup should be considered
- Consider development and adoption of interim design flood profiles for Lower Fraser River and coastal flood hazards, accounting for climate change effects, to be used for official floodplain mapping, land use planning and flood protection upgrades
It is important that provincial and local authorities formally acknowledge projected climate change effects on Fraser River peak flows and ocean levels, and consider further scientific and applied research to inform how and when to revise the provincial standard and local government implementation of the standard for the Lower Fraser River and coastal design flood profiles. This approach could influence dike design, land use guidelines for flood hazard areas and detailed official floodplain mapping for the Lower Mainland. Footnote 10b
It may be appropriate to adopt interim design flood profiles because data limitations and uncertainties will never be fully resolved; meanwhile, floodplain development decisions and infrastructure upgrades are necessary. It is recommended to build in flexibility for future adaptation as flood protection upgrades are implemented and flood management policies are adopted in the near-term. This will better enable policy makers and flood management professionals to adapt to evolving flood hazards as new research becomes available, and as uncertainties are reduced over time.
References
Association of Professional Engineers and Geoscientists of British Columbia (APEGBC). 2012. Professional practice guidelines – legislated flood assessments in a changing climate in BC. Prepared for B.C. Ministry of Forests, Lands and Natural Resource Operations, Victoria, B.C.
APEGBC Legislated Flood Assessments
cb3ea74683c3/APEGBC-Legislated-Flood-Assessments.pdf.aspx.
Ausenco-Sandwell. 2011. Climate change adaption guidelines for sea dikes and coastal flood hazard land use. Prepared for B.C. Ministry of Environment, Victoria, B.C.
B.C. Ministry of Environment. 2011. Climate change adaption guidelines for sea dikes and coastal flood hazard land use. Victoria, BC.
EXCIMAP. 2007. Handbook on good practices for flood mapping in Europe. (Accessed online15 May 2013).
Intergovernmental Panel on Climate Change. 2014. Climate change 2014 synthesis report summary for policymakers. (Accessed online 27 January 2017).
Kerr Wood Leidal. 2015. Lower Mainland flood management strategy – analysis of flood scenarios. Prepared for Fraser Basin Council, Vancouver, B.C.
Kundewicz, A.W., S. Kanae S.I. Seneviratne, J. Handmer, N. Nicholls, P. Peduzzi, R. Mechler, L.M. Bouwer, N. Arnell, K. Mach, R. Muir-Wood., G.R. Brakenridge, W. Kron, G. Benito, Y. Honda, K. Takahashi., and B. Sherstyukov. 2013. Flood risk and climate change: global and regional perspectives. Hydrological Sciences Journal 59(1):1−28. DOI:10.1080/0262 6667.2013.857411.
Mazzotti, S., A. Lambert, M. Van der Kooij, and A. Mainville. 2009. Impact of anthropogenic subsidence on relative sea level rise in the Fraser River delta..Geology 37:771−774 .
Murdock, T.Q., and D.L Spittlehouse. 2011. Selecting and using climate change scenarios for British Columbia. Pacific Climate Impacts Consortium (PDF 2,45 MB), University of Victoria, Victoria, B.C.
Northwest Hydraulic Consultants Ltd. (NHC) 2006. Lower Fraser River hydraulic model. Final report. Prepared for Fraser Basin Council (PDF 1.56 MB), Vancouver B.C.
Northwest Hydraulic Consultants Ltd. (NHC) 2008a. Fraser River hydraulic model update. Final report. Prepared for B.C. Ministry of Environment, Victoria, B.C.
Northwest Hydraulic Consultants Ltd. (NHC) 2008b. Comprehensive review of Fraser River at Hope. Flood hydrology and flows – scoping study. Final report. Prepared for B.C. Ministry of Environment, Victoria, B.C. (PDF, 876 kb)
Northwest Hydraulic Consultants Ltd. (NHC) 2014a. Simulating the effects of sea level rise and climate change on Fraser River flood scenarios. Final report 300305. Prepared for B.C. Mistry of Forests, Lands and Natural Resource Operations, Victoria, B.C.
Northwest Hydraulic Consultants Ltd. (NHC) 2014b. City of Vancouver coastal flood risk assessment. Final report. Prepared for City of Vancouver, Vancouver, B.C.
Northwest Hydraulic Consultants Ltd. (NHC) 2016. Lower Mainland flood management strategy. Project 2: regional assessment of flood vulnerability. Final report. Prepared for Fraser Basin Council, Vancouver B.C. (PDG1.67 MB)
Shrestha, R. R., M.A. Schnorbus, A.T. Werner, and A.J. Berland. 2012. Modeling spatial and temporal variability of hydrologic impacts of climate change in the Fraser River basin, British Columbia, Canada. Hydrological Processes 26:1840−1860. DOI:10.1002/hyp.9283.
Shrestha, R.R., M.A. Schnorbus, A.J. Cannon, and F.W. Zwiers. 2015. Simulating the effects of climate change on Fraser River flood scenarios – Phase 2. Prepared for B.C. Ministry of Forests, Lands and Natural Resource Operations, Victoria, B.C. (PDF 985 kb)
Sweet, W.V., R.E. Kopp, C.P. Weaver, J. Obeysekera, R.M. Horton, E.R. Thieler, and C. Zervas. 2017. Global and regional sea level rise scenarios for the United States (PDF 987 kb). NOAA Technical Report NOS CO-OPS 083.
Annex C: Flood Mapping and Climate Change: Waterford River Case Study Analysis
Client: NRCan, Consultant: CBCL Limited ,Date: March 31, 2017
Table of Contents
- 1. Summary
- 2. Introduction
- 3. Background
- 3.1 Urban Hydrology Study of the Waterford River Basin
- 3.1.1 Waterford River Area – Hydrotechnical Study
- 3.1.2 Updated Flood Extents for the Waterford River
- 3.2 Case Study Objective
- 4. Methodology
- 4.1 Data Collection
- 4,2 IDF Selection
- 4.3 Flood Flow Estimation
- 4.4 Hydraulic Modelling
- 4.5 Sensitivity Analysis
- 4.7 Map Development
- 4.7 Discussion
- 5. Recommendations
- 6. Acknowledgements
- 7. References
1. Summary
In 2017, CBCL Limited (CBCL) prepared flood risk maps for the Waterford River, which is located in the municipalities of St. John’s, Mount Pearl and Paradise in Newfoundland and Labrador. Developing the flood risk maps consisted of Intensity-Duration-Frequency (IDF) selection, flood flow estimation, hydraulic modelling, sensitivity analysis and overlaying the hydraulic modelling results onto topographic mapping (map development). The impact of climate change was considered in developing the maps.
The objective of preparing a case study for the Waterford River Flood Risk Mapping (WRFRM) project is to document how climate change considerations have been integrated into the flood risk mapping process. Recommendations for professionals involved in the preparation of flood risk mapping in Canada include:
- Consider local stormwater management policies, including zero-net-increase in runoff requirements, when the watershed area covers more than one municipality.
- Use climate change IDFs that are defensible.
- Set up hydrologic models such that the design storms can be easily changed as updated IDFs become available.
- Produce maps that are clear and easy to use.
Further, flood risk mapping studies which consider the implications of climate change may be used as climate change adaptation tools:
- Flood risk maps may be used by municipal planners to assist in developing land use policies.
- Summaries of the hydraulic capacities of bridges and culverts may assist engineers in capital works planning.
- Hazard maps can be used by early responders during flood situations.
- Hydraulic models can be used in the development of real-time flood-forecasting systems.
The project methodology and examples of the final flood risk mapping package are presented in this case study.
2. Introduction
In 2015, the Water Resources Management Division (WRMD) of the Newfoundland and Labrador Department of Municipal Affairs and Environment engaged CBCL Limited (CBCL) to develop flood risk mapping for the Waterford River.
The WRFRM study objective was to produce flood risk maps for various development and climate conditions within the watershed.
The WRFRM study area consists of the Waterford River and its major tributaries, including South Brook, Kilbride Brook, Branscombes Pond, Nevilles Pond, Unnamed River and Bremigens Pond. The watershed area totals 66.3 km 2 and covers three municipalities: City of St. John’s, City of Mount Pearl, and Town of Paradise. The Waterford River begins at Bremigens Pond and Brazil Pond within the Eastern tip of the Town of Paradise. From here, the river flows through the City of Mount Pearl and on to the confluence at Unnamed River. The Waterford River continues through the Cities of Mount Pearl and St. John’s where it meets up with South Brook and ultimately discharges into St. John’s Harbour. Figure 1 shows the study area.
The WRFRM study objective was to produce flood risk maps for various development and climate conditions within the watershed.
Hydrologic modelling was used to measure the watershed’s response to pre-defined return period events. These flows became the major input for the hydraulic model, which measures the river’s response to flood flows. Finally, the mapping exercise included overlaying the hydraulic model outputs onto the site specific terrain.
The flood risk maps were presented by map set in an effort to organize the large volume of data. Each map set included six figures at a 1:2500 scale preceded by one overview map of the overall river system.
The following list outlines the flood risk map packages included in the WRFRM study report along with a description of the data presented:
- Flood Zone Inundation Boundary Map Set – flood plain and water surface elevation associated with the following conditions:
- 1:20 and 1:100 Annual Exceedance Probability (AEP) for Current Climate,
- Current Development (CC-CD)
- 1:20 and 1:100 AEP for Climate Change, Future Development (CLC-FD)
- Flood Zone Velocity Distribution Map Set – flood zone velocity associated with the following conditions:
- 1:20 AEP for CC-CD
- 1:100 AEP for CC-CD
- 1:20 AEP for CLC-FD
- 1:100 AEP for CLC-FD
- Flood Hazard Map Set – flood hazard associated with the following conditions:
- 1:20 AEP for CC-CD
- 1:100 AEP for CC-CD
- 1:20 AEP for CLC-FD
- 1:100 AEP for CLC-FD
- Flood Zone Inundation Boundary Comparison Maps – flood plain associated with the following conditions:
- 1:20 AEP comparison of CC-CD and Climate Change, Future Development (CLC-FD)
- 1:100 AEP comparison of CC-CD and CLC-FD
- 1:20 AEP comparison of CC-CD and historical inundation boundary
- 1:100 AEP comparison of CC-CD and historical inundation boundary

Figure 1- Study Area
text version
Figure 1- Study Area
This image shows a detailed map of a study area, highlighting the drainage areas of Waterford River and South Brook. Here are the key elements:
- Study Area Boundaries:
- The entire study area is outlined in red.
- Tributaries Modeled:
- The Waterford River and South Brook tributaries are highlighted and labeled within the study area.
- Land Use and Infrastructure:
- The map displays various land uses and infrastructure within the outlined area, likely indicating urban development, residential zones, and natural features.
- Scale:
- A scale bar at the bottom of the map provides a reference for distance, ranging from 0 to 2,000 meters.
3. Background
Under the Canadian constitution, flood plain management falls under the jurisdiction of the provinces, as they are primarily responsible for water resources and land use matters. Traditionally, the federal government has supported the provinces by providing funding for physical flood improvement measures. In the 1950s, 1960s, 1970s, and to a lesser extent in the 1980s, the federal government allocated millions of dollars, in conjunction with the provinces, to build dams and dykes. Extensive flood damages across Canada in the early 1970s clearly demonstrated that a new approach to reducing flood damage was needed. These flood events were the catalyst for the federal government to initiate the national Flood Damage Reduction Program (FDRP) in 1975 under the Canada Water Act. The FDRP has been carried out under cost shared federal/provincial agreements.
Newfoundland and Labrador joined the FDRP in 1981 by signing the General and Mapping Agreement and two years later a Studies Agreement. In the 1980s and 1990s, communities in Newfoundland and Labrador with a known history of flooding were mapped and the flood plains associated with the 1:20 and 1:100 annual exceedance probabilities (AEP) were designated. The last study undertaken in the federal-provincial program was in 1996, and the last study for Waterford River watershed was completed in 1988. In 2008, the province funded a new study for Stephenville and Cold Brook. The Stephenville/Cold Brook study was one of the first in Canada to delineate climate change based flood risk mapping. Following the success of the 2008 study, a partnership with Natural Resources Canada funded climate change flood risk mapping studies for three additional areas.
Under the Canadian constitution, flood plain management falls under the jurisdiction of the provinces, as they are primarily responsible for water resources and land use matters.
In 2011, a new Climate Change Adaptation initiative was announced by the Government of Newfoundland and Labrador to update and undertake new flood risk mapping studies. The studies continue to incorporate climate change projections, which assists in climate change adaptation. Since their creation, flood risk maps have been incorporated into a wide range of applications including public safety, infrastructure design, water resources management, environmental assessments, land use development, municipal and development planning, setting of structural design criteria, and flood response.
Three previous flood mapping studies of the Waterford River have been completed; brief summaries of these studies are presented below.
3.1 Urban drology Study of the Waterford River Basin
The Urban Hydrology Study of the Waterford River Basin (UHS-WRB) was a five year study,
which began in 1980 and was mostly completed by 1985. This study was a joint effort of the Government of Canada and the Province of Newfoundland and Labrador and focused on the effects of urbanization on both water quality and quantity in the Waterford River basin. The following topics were studied in detail with respect to the Waterford River basin: Surficial Geology, Geology, Land Use, Surface Water Quality, Storm Runoff Study of Newtown Urban Catchment, Groundwater, Installation and Testing of the Monitoring Well Network, Biological Study, Watershed Modelling Using HYMO, Flood Study, and Streamflow Modelling.
The UHS-WRB: Flood Study was released in 1986. The flows examined were the 1:20 and 1:100 AEP events as developed using the hydrologic model, HYMO. The HEC-2 program was used to simulate the 1:20 and 1:100 AEP flows and develop flood limits. The hydraulic model was limited to three sections of the Waterford River, these include a roughly 330 m reach from the 02ZM008 hydrometric gauge and extending upstream, an approximate 1,120 m reach in Mount Pearl from hydrometric gauge 02ZM010 extending downstream, and a roughly 510 m reach in Donovan’s Industrial Park upstream from gauge 02ZM011. The studied reaches showed flooding during the 1:20 and 1:100 AEP events around the Corpus Christi Church in the Kilbride reach, with several other buildings in this reach affected as well.
3.1.1 Waterford River Area – Hydrotechnical Study
In June 1988, Fenco Newfoundland Ltd. completed a flood plain mapping study for the then Department of Environment and Lands: this study identified the extent of flooding and proposed flood damage reduction strategies for Waterford River between St. John’s harbour and Donovan’s Industrial Park in Mount Pearl. This study included estimating the 1:20 and 1:100 AEP flows using the modeling software QUALHYMO and statistical techniques, and delineating the resulting floodlines by transposing the water surface elevations determined from the HEC-2 model on to 1:2,500 scale topographic maps. The flood risk maps identified 20 structures along the Waterford River that would be flooded during a 1:100 AEP event.
This study was a joint effort of the Government of Canada and the Province of Newfoundland and Labrador and focused on the effects of urbanization on both water quality and quantity in the Waterford River basin.
3.1.2 Updated Flood Extents for the Waterford River
In 1998, WRMD completed an update of the 1988 Fenco Newfoundland Ltd. study. This update examined the 1:20 and 1:100 AEP flood flows from the 1988 study, provided a statistical analysis of the annual peak instantaneous flows up to 1996, and recommended flood flows used to prepare the updated flood risk maps. The hydraulic model chosen for the study was HEC-RAS and used the cross sections surveyed for the 1988 study. The study found that the increased estimates for the 1:20 and 1:100 AEP increased water levels by 15 and 17 cm, respectively, over the 1988 study. The study also found that the width of both the updated 1:20 and 1:100 AEP flood plains increased compared to the 1988 study. The 1:100 AEP flood plain increased only slightly over the 1988 extent, while the 1:20 AEP floodplain increase was more significant.
3.2 Case Study Objective
The objective of preparing a case study for the WRFRM project is to document how climate change considerations have been integrated into the flood risk mapping process.
The WRFRM project is ideally suited for a case study because climate change impacts were considered in the development of flood flows. Further, opportunities for sharing key learning experiences were identified, such as the challenges associated with adapting to climate change in an urban environment, and how multi-jurisdictional policies affect how flood risk mapping studies are carried out.
This case study was developed as part of the Federal Floodplain Mapping Guidelines Series to inform any individual or organization involved in flood plain management in Canada.
4.0 Methodology
Developing flood risk maps for the WRFRM project consisted of the following steps:
- Intensity-Duration-Frequency (IDF) selection;
- Flood flow estimation;
- Hydraulic modelling;
- Sensitivity analysis; and
- Overlaying the hydraulic modelling results onto topographic mapping (map development).
4.1 Data Collection
Aerial photography and Light Detection and Ranging (LiDAR) survey was collected at the onset of the project. In addition, an extensive field data acquisition program was undertaken to better reflect the river geometry below the water surface, which was not penetrable by the LiDAR survey method. Field survey was used to collect 433 cross sections at key locations in the Waterford River and associated tributaries.
Survey of hydraulic structures such as culverts and bridges within the modeled tributaries was also completed. Structure attributes and site photography was also recorded and incorporated in the hydraulic model. Stretches of river in-between surveyed cross sections were complimented with cut lines of the digital elevation model (DEM) terrain created from the LiDAR survey.
4.2 IDF Selection
IDF curves are developed for a particular geographical area using historical time series rainfall data. The result is a set of curves representing rainfall intensities for a range of storm durations for various return periods, typically the 1:2, 1:5, 1:10, 1:25, 1:50 and 1:100 AEP.
In 2015, Conestoga-Rovers and Associates (CRA) prepared a report entitled IDF Curve Updates for Newfoundland and Labrador for the Government of Newfoundland and Labrador’s Office of Climate Change and Energy Efficiency. As the report expresses, overall air temperature is expected to rise for future climate conditions in Canada, with the most drastic effects being realized during the winter months in Newfoundland within the range of 2-3°C by mid-21 st century. Further, the Intergovernmental Panel on Climate Change (IPCC) predicts that future rainfall events will increase both in duration and frequency due to climate change.
CRA applied a statistical modelling approach to relate historical IDF distribution and precipitation distribution for various global climate models (GCMs). In this 2015 report, updated IDF curves are presented for 19 stations located throughout the province. In addition, future climate IDF curves were generated from the current conditions IDFs (IDF- CC) using a climate change tool developed at the University of Western Ontario (Sirvastav et. al., 2015). The tool represents a new methodology developed specifically for deriving future climate IDFs in Canada using the ensemble modelling approach. An ensemble mean projection was constructed from 22 individual GCMs. The individual model projections were not weighted in the construction of an ensemble and the ensemble was calculated as the median value in the IDF_CC tool.
The Representative Concentration Pathway (RCP) 4.5 scenario developed by the IPCC Assessment Report 5 (IPCC AR5) was used to develop projections of future climate IDF curves for three time horizons (2011-2040, 2041-2070 and 2071-2100). RCPs are based on projections of greenhouse gas (GHG) concentrations as well as land use data. The RCP 4.5 was selected as the most likely future scenario and refers to the intermediate stabilization pathway in which radiative forcing is stabilized at 4.5 W/m 2 shortly after 2100 (CRA, 2015). The resulting future IDF curves over the three time horizons were derived for all 19 IDF stations within Newfoundland and Labrador.
In the 2015 CRA report, new IDF curves are presented for a rain gauge located at the Ruby Line pump house, which is owned and operated by the City of St. John’s. These new IDF curves were created using 16 years of data from 1997 to 2014. The Ruby Line rain gauge is located within the Waterford River drainage basin. The new and future climate IDFs for the Ruby Line location were used to developed rainfall hyetographs for the hydrologic models. The study concluded that for the Ruby Line Station specifically, the average increase of IDF rainfall amounts is anticipated to be approximately 16%, 22%, and 26% for the 2011-2040, 2041-2070, and 2071-2100 time frames respectfully. Further, it was predicted that the 100- year return period storm will become a 25-year return period storm by 2080 for this station.
Specifically, the IDF curves for the following events were used to develop the model storms (note that the 1:20 AEP events were interpolated):
- 1:20 AEP (Current Climate)
- 1:100 AEP (Current Climate)
- 1:20 AEP (Climate Change: Future IDF curve for 2071-2100 time horizon)
- 1:100 AEP (Climate Change: Future IDF curve for 2071-2100 time horizon)
The 2071-2100 time horizon was used in the WRFRM study because it represents the most conservative prediction. Developing future climate IDF curves for all IDF stations within the province ensures consistency with respect to climate change projections. The climate change IDF projections are expected to be updated regularly and act as the sole reference for all rainfall intensity projections within Newfoundland and Labrador.
4.3 Flood Flow Estimation
For the WRFRM project, flows were estimated using three methods: Single Station Flood Frequency Analysis (SSFFA), Regional Flood Frequency Analysis and Deterministic Analysis (hydrologic modelling). Hydrologic modelling is the only method that can be used to compare development and climate conditions impacts because basin parameters can be adjusted to reflect varying degrees of development and rainfall inputs can be changed to account for climate change. As the focus of this case study is on how to address climate change in flood risk mapping studies, the results of the Single Station Flood Frequency Analysis and Regional Flood Frequency Analysis are not discussed in detail.
Hydrologic modeling was carried out using the Hydrologic Engineering Center’s Hydrologic Modeling System (HEC-HMS) and its geospatial modelling extension (HEC-GeoHMS). HEC- HMS was developed by the US Army Corp of Engineers (USACE) and is specifically geared towards the precipitation-runoff processes of watershed systems. It allows the user to select from a variety of analysis methods used to simulate ground infiltration, transformation of surplus precipitation, baseflow, and open channel flow. HEC-GeoHMS is a GIS modeling extension that allows the modeller to extract watershed characteristics, define subbasins and streams, and assemble hydrologic model inputs to be used directly with HEC-HMS.
Prior to using HEC-GeoHMS to extract watershed characteristics, terrain and basin pre- processing is completed to derive the drainage network. Pre-processing includes determining flow direction, flow accumulation, stream definition and basin delineation. During basin pre- processing, the watershed is divided into sub-basins based on project specific requirements. Following stream and subbasin delineation, physical characteristics such as stream length and slope, longest flow paths, centroidal flow lengths and basins slopes are extracted from the terrain data using the HEC-GeoHMS extension. It is also used to extract hydrologic parameters such as curve numbers and basin lag time, and to specify the loss, transform, baseflow and river routing methods to be used in the hydrologic model.
The analysis methods used in HEC-HMS for the WRFRM project include:
- Loss method: Soil Conservation Service (SCS) curve number
- Transform method: SCS unit hydrograph
- Routing method: Muskingum-Cunge
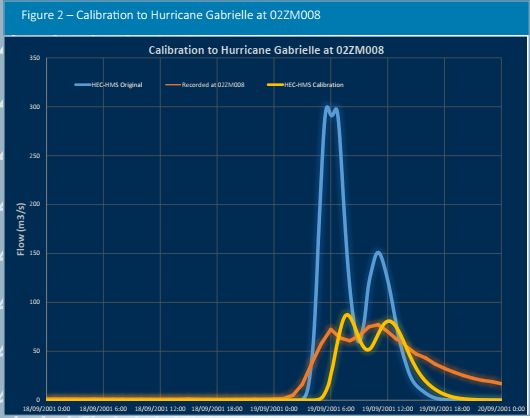
Figure 2 – Calibration to Hurricane Gabrielle at 02ZM008
text version
Figure 2 – Calibration to Hurricane Gabrielle at 02ZM008
This chart, titled "Calibration to Hurricane Gabrielle at 02ZM008," compares different flow measurements and models related to Hurricane Gabrielle. The x-axis represents time, specifically from September 18 to September 20, 2001, and the y-axis represents the flow in cubic meters per second (m³/s).
Here are the key elements:
- Flow Measurements and Models:
- HEC-HMS Original: Represented by the blue line, showing the original model predictions.
- Recorded at 02ZM008: Represented by the orange line, showing the actual recorded flow data at the specified location.
- HEC-HMS Calibration: Represented by the yellow line, showing the calibrated model predictions.
- Flow Patterns:
- The chart shows a significant peak in flow around 6:00 AM on September 19, 2001, indicating the peak of the hurricane's impact.
- The recorded data (orange line) shows a lower peak compared to the original model predictions (blue line), while the calibrated model (yellow line) more closely matches the recorded data.
Calibration of a hydrologic model is achieved by simulating a recorded precipitation event and 02ZM008 ation HEC-HMS Calibr comparing the calculated hydrograph with measured flows. The Waterford River at Kilbride gauge (02ZM008) was used to calibrate the HEC-HMS model. Rainfall data recorded at the Ruby Line rain gauge during Hurricane Gabrielle (September 2001) in 5-minute increments was obtained from the City of St. John’s. Hourly flow data recorded at the 02ZM008 gauge was obtained from EC for the same time period. The rain data was simulated in the HEC-HMS model and the 18/09/2001 0:00 18/09/2001 6:00 18/09/2001 12:00 18/09/2001 18:00 19/09/2001 0:00 19/09/2001 6:00 19/09/2001 12:00 19/09/2001 18:00 20/09/2001 0:00 model results were compared to the recorded flow data by plotting both hydrographs on the same graph (see Figure 2). This process was repeated using rainfall and flow data recorded during Tropical Storm Chantal (August 2007). HEC-HMS requires a rainfall hyetograph (time- series precipitation data) as input to simulate the rainfall to runoff process. Hyetographs representing the 1: 20 and 1:100 AEP precipitation amounts, as determined from the IDF update, were entered in HEC-HMS to estimate the corresponding 1:20 and 1:100 AEP flood flows. The alternating block method was used to estimate a synthetic hyetograph shape. The current climate and climate change hyetographs created for the 1:20 and 1:100 AEP return periods include the precipitation amounts for the 15 and 30-minute, and 1, 2, 6, 12 and 24- hour durations.
Future land use patterns can be modeled in HEC-HMS by changing curve numbers (and consequently, lag times). This process has been used in recent flood risk mapping studies completed for WRMD. However, individual municipal stormwater management policies are more challenging to address. For instance, the Cities of St. John’s and Mount Pearl have “net zero increase in runoff” policies, whereas the Town of Paradise does not have such a policy. Therefore, it was determined that fully developed conditions for this study should be modeled in the following manner:
Curve numbers within the boundaries of Paradise and the drainage basin were changed to reflect future land uses.
- Curve numbers within the boundaries of Mount Pearl and St. John’s, and the drainage basin remained the same as curve numbers for existing conditions.
The flow estimates are summarized below.
| Location | Return Period | SSFFA Results (m3/s) |
Modelling Results (m3/s) | % Flow Increase (CC-CD to CLC-FD) |
|
|---|---|---|---|---|---|
| CC-CD | CLC-FD | ||||
| 02ZM008 | 1:20 | 80.5 | 80.2 | 107.0 | 33 |
| 1:100 | 100.0 | 118.0 | 164.1 | 39 | |
| Outlet | 1:20 | N/A | 91.6 | 122.6 | 34 |
| 1:100 | N/A | 136.4 | 192.0 | 41 | |
4.4 Hydraulic Modelling
The main purpose of the hydraulic analysis is to translate the 1:20 and 1:100 AEP flood flows, estimated during the hydrologic analysis, into water surface profiles along the river reaches. These water surface profiles have associated depths and velocities for each flood flow and development condition (current and future). The velocity and depth results are both considered in the development of the flood hazard maps, which are based on the Royal Haskoning flood hazard matrix.
In summary, the following results are presented on the flood risk maps for the WRFRM study:
- Water Surface Elevation;
- Depth;
- Flow;
- Velocity, and
- Inundation Boundary.
A secondary purpose of the hydraulic analysis is to identify undersized bridges and culverts. For the WRFRM study, a list of such structures for various flood and development conditions was provided with the report.
Hydraulic modeling was carried out using the Hydrologic Engineering Center’s River Analysis System (HEC-RAS) and its geospatial modelling extension (HEC-GeoRAS). HEC-RAS provides open channel solutions for one- and two-dimensional steady and unsteady flow hydraulics. Modelling was carried out for the WRFRM project using a one-dimensional, steady state approach.
HEC-RAS model development requires the following geometry elements:
- Stream Centerlines – Digitized polyline representing the river reach network;
- Cross Sections – Locations where the model computes results across the river section;
- Bank Lines – Represent the right and left bank lines across each cross section;
- Junctions – Mark confluence, start and stop points on the river; and
- Hydraulic structures – Bridges and culverts at road crossings along river.
Calibration of an open channel hydraulic model is achieved by adjusting the model’s parameters, such as roughness, so that it reproduces observed water levels. For the WRFRM project, flows and levels recorded during Tropical Storm Chantal (August 2007) were used to calibrate the hydraulic model. Adjustments were made only to the Manning’s n coefficients; all final Manning’s n values fall within published ranges.
The climate change scenario considers both future land use development and sea level rise. Increased run off from impervious area due to future land development estimates were considered for all three municipalities within the study area by referencing appropriate storm water management plans as well as land use zoning. A projected sea level rise due to climate change of 1.0m is based on the 2010 M. Batterson and D. Liverman report Past and Future Sea-Level Change in Newfoundland and Labrador: Guidelines for Policy and Planning. This boundary condition was applied to the hydraulic model to simulate a future sea level rise at the outlet to the St. John’s Harbour for climate change scenarios.
4.5 Sensitivity Analysis
Sensitivity analyses were conducted on selected model parameters to assess the impact of changing these parameters on model results. The hydrologic parameters selected for sensitivity analysis include curve number and Manning’s roughness values. The 1:100 AEP event for the existing development conditions was selected as a benchmark to evaluate the sensitivity of the flow to the variation of each parameter. Figures 3 and 4 show the results.
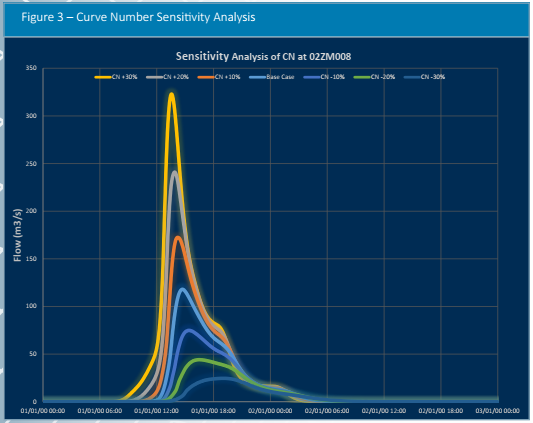
Figure 3 – Curve Number Sensitivity Analysis
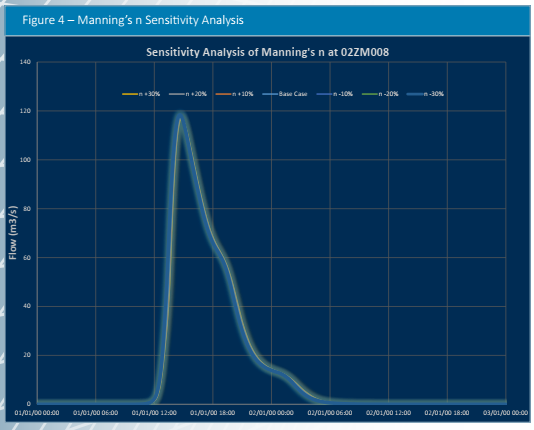
Figure 4 – Manning’s n Sensitivity Analysis
4.6 Map Development
Flood risk maps are generated by performing base case and climate change model simulations in HEC-RAS and exporting the results to ArcGIS using the HEC-geoRAS extension. Water depths and velocities exported from the base case model results are then used to create colour-coded flood inundation and flood velocity maps using HEC- geoRAS.
Flood hazard maps are generated by inputting the water depths and velocities into a raster and grid system within ArcGIS such that the two forms of data can be combined. The study area was colour coded as per the Flood Hazard Matrix found in Application of Remote Sensing (Digital Terrain Models) in Flood Risk Assessments, presentation at the National Hydrology Seminar 2007: GIS in Hydrology by Mercedes Uden (Royal Haskoning) and Hamish Hall (Royal Haskoning).
Map to Map (M2M) is a workflow process developed at the University of Texas and altered for WRMD by ESRI in an effort to streamline the creation of flood risk maps. The process involves referencing hydrologic and hydraulic modeling software through ArcMAP an ESRI software to take a “map of rainfall” and transform it to a “map of flooding”. The M2M process has been successfully implemented on previous projects, although that process was custom and 01/01/00 00:00 01/01/00 06:00 01/01/00 12:00 01/01/00 18:00 02/01/00 00:00 02/01/00 06:00 02/01/00 12:00 02/01/00 18:00 03/01/00 00:00 not transferable to other projects. WRMD engaged ESRI to simplify the overall M2M process so it can be applied to a number of study areas. The M2M process in general is an exercise in proper naming, classification and organization of key component files.
The post-processing of HEC-RAS results can be an extensive exercise due to the creation of “islands” in the resulting flood plain. Islands refer to delineated flood polygons that are isolated from the main river tributaries on all sides. At this time, these islands must be dealt with manually; however future updates to the M2M workflow could include a systematic process to deal with this issue.
4.7 Discussion

Figure 5: Ruby Line Hyetograph 1:20 AEP
Climate change effects are modelled by changing the rainfall inputs. For the WRFRM project, this was done by changing the design hyetographs, which were developed from the Ruby Line IDF curves. Figures 5 to 8 present the design hyetographs used in to develop the flow estimates for this project. As updated IDF curves become available, new design hyetographs can be developed and used to estimate new flood flows. The rainfall storms for the climate change conditions are more intense than those for current climate conditions; therefore, they produce higher flows in the hydrologic models. The base hydraulic model that is used to compare the current climate and future climate is the current development condition.
The climate change scenario considered for the WRFRM study included both future development within the catchment and sea level rise conditions at the outlet of the Waterford River to St. John’s Harbour. Future development conditions are reflective of current land use zoning documents made available by the Town of Paradise, City of Mount Pearl, and City of St. John’s respectively. As planning documents and storm drainage criteria are updated within these three municipalities, flood risk mapping should also be updated.
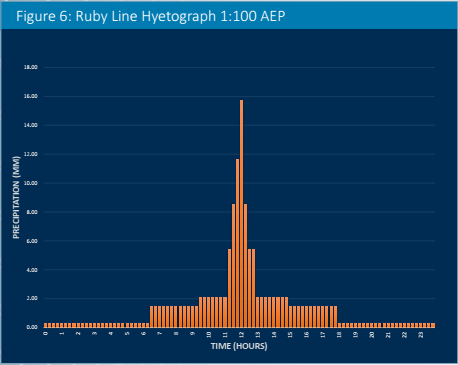
Figure 6: Ruby Line Hyetograph 1:100 AEP
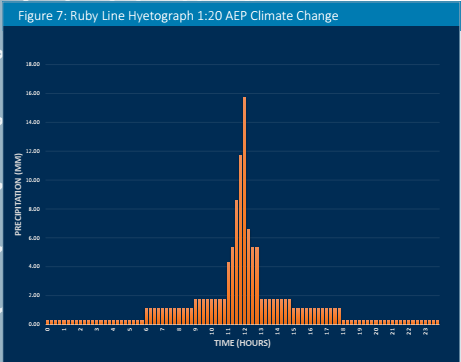
Figure 7: Ruby Line Hyetograph 1:20 AEP Climate Change
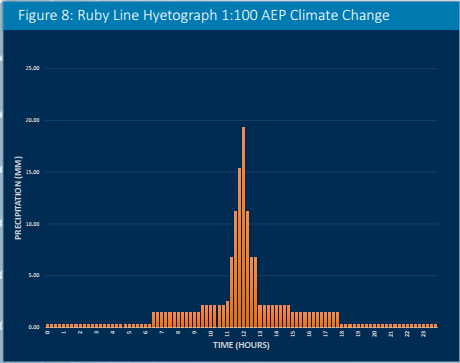
Figure 8: Ruby Line Hyetograph 1:100 AEP Climate Change
As noted previously, the flood zone inundation boundary comparison maps produced for the WRFRM study include:
1:20 AEP comparison of CC-CD (Current Climate, Current Development) and Climate Change, Future Development (CLC-FD) floodlines
- 1:100 AEP comparison of CC-CD and CLC-FD floodlines
- 1:20 AEP comparison of CC-CD and historical floodlines
- 1:100 AEP comparison of CC-CD and historical floodlines
Figures 9 to 12 present examples of the comparisons that were made along the Waterford River. Figure 13 presents a Flood Hazard Map example.
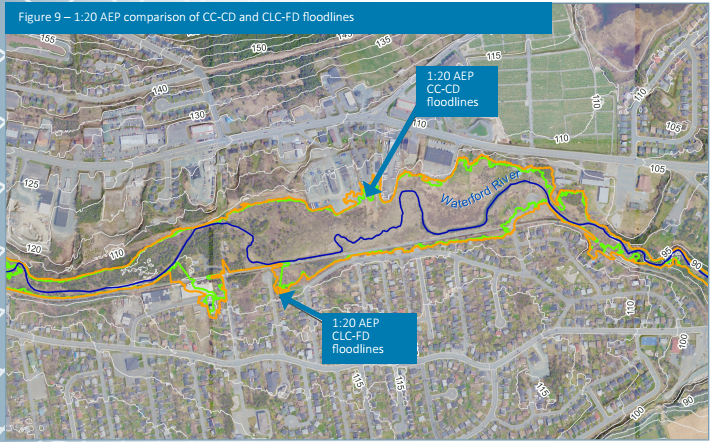
Figure 9 – 1:20 AEP comparison of CC-CD and CLC-FD floodlines
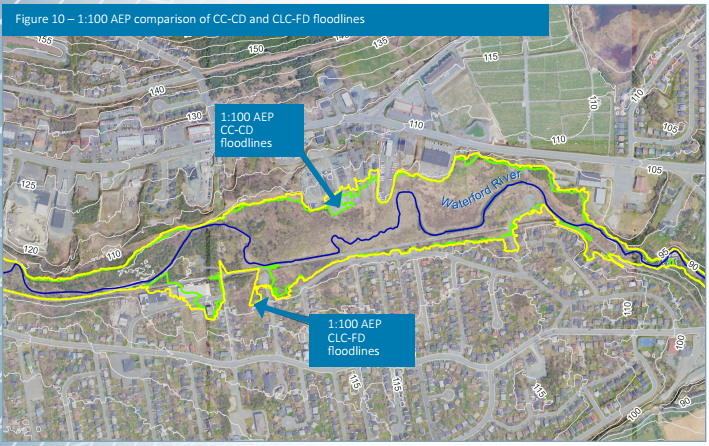
Figure 10 – 1:100 AEP comparison of CC-CD and CLC-FD floodlines
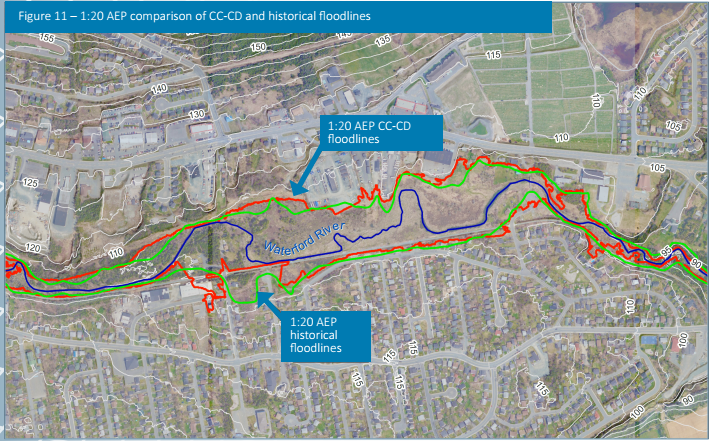
Figure 11 – 1:20 AEP comparison of CC-CD and historical floodlines
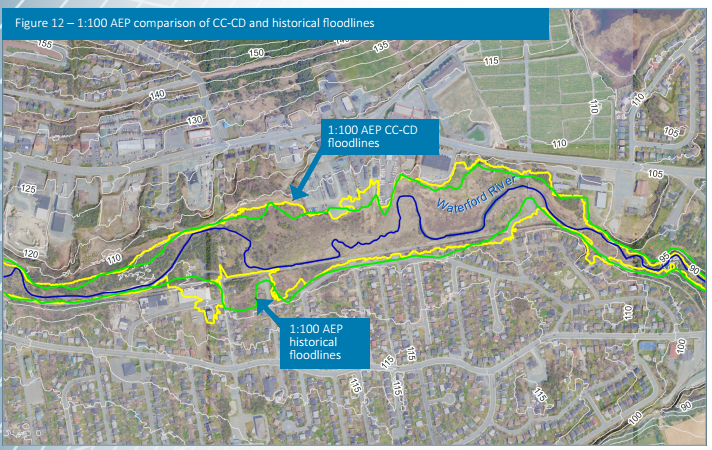
Figure 12 – 1:100 AEP comparison of CC-CD and historical floodlines
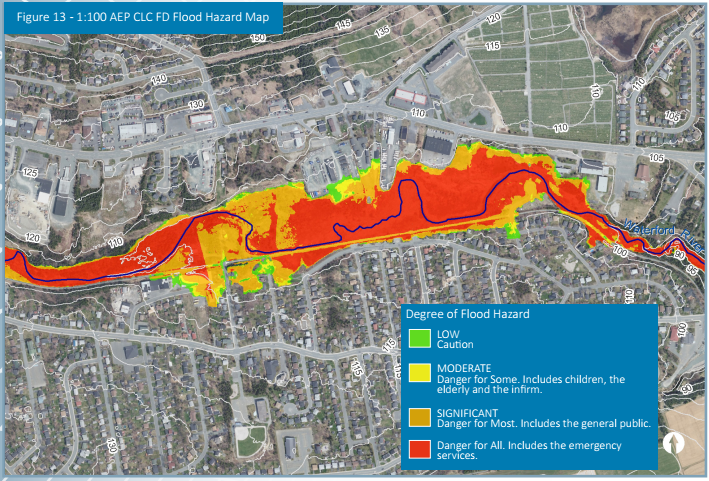
Figure 13 - 1:100 AEP CLC FD Flood Hazard Map
5. Recommendations
The objective of preparing a case study for the WRFRM project is to document how climate change considerations have been integrated into the flood risk mapping process.
Recommendations for those involved in the preparation of flood risk mapping in Canada include:
- Consider local stormwater management policies, including zero-net-increase in runoff requirements, when the watershed area covers more than one municipality.
- Use climate change IDFs that are defensible.
- Set up hydrologic models such that the design storms can be easily changed as updated IDFs become available.
- Produce maps that are clear and easy to use.
Further, flood risk mapping studies which consider the implications of climate change may be used as climate change adaptation tools:
- Flood risk maps may be used by municipal planners to assist in developing land use policies.
- Summaries of the hydraulic capacities of bridges and culverts may assist engineers in capital works planning (see example table below).
- Hazard maps can be used by early responders during flood situations.
- Hydrologic and hydraulic models can be used in the development of real- time flood-forecasting systems.
An example table representing hydraulic capacity of structures along the Waterford River is presented below:
| River (Reach) | River Station (Structure ID) | Profile* |
Q Culvert | Q Weir | Q Total | Depth Overtop |
|---|---|---|---|---|---|---|
| (m3/s) | (m3/s) | (m3/s) | cm | |||
| Waterford (Upper Waterford) | 13832.02 (251-252) Double Barrel |
CC_CD 100 AEP |
8.5 |
- |
8.5 |
- |
| Waterford (Upper Waterford) | 13832.02 (251-252) Double Barrel |
CLC_FD 100 AEP |
10.8 |
3.8 |
14.6 |
22 |
| South Brook (Lower South Brk) | 309.5599 (51-52) |
CC_CD 100 AEP | 39.5 | - |
39.5 | - |
| South Brook (Lower South Brk) | 309.5599 (51-52) |
CLC_FD 100 AEP | 43.8 | 12.4 | 56.2 | 5 |
The hydrologic and hydraulic software employed in the creation of the WRFRM deliverables offered unique challenges with respect to software bugs. HEC-HMS and HEC-RAS, as well as their geospatial extensions, are open source software which have been developed to meet the needs of the U.S. Army Corps of Engineers. The software is available to the public, without charge; however, the HEC software developers do not offer technical assistance or support.
New software versions with alleviated bugs could become available at any time throughout a project. Paying attention to the software release notes that document repaired software issues from superseded software versions is essential. Unfortunately, minor problems in the software interface are repaired without being specifically documented.
Model capabilities are constantly evolving though new releases of the software. The latest version of HEC-RAS (5.0.3) included new simulation features such as RAS Mapper. This function allows the user to automatically view results rendering while undergoing modelling updates or running various flow simulation conditions.
Future technological developments in LiDAR may offer an opportunity to penetrate the water surface and capture river bed geometry without the use of field survey. Until this method becomes feasible, extensive field survey is required to supplement land surface data collected through LiDAR methods. To ensure the accuracy of flood risk mapping results over time, changes in river geometry and upgrades to existing infrastructure must be monitored and updated in the model geometry accordingly.
6. Acknowledgments
CBCL Limited acknowledges the Water Resources Management Division of the Newfoundland and Labrador Department of Municipal Affairs and Environment for their support in the preparation of this case study.
7. References
- Policy for Development in Shore Water Zones (Environmental and Conservation, 2001)
- Past and Future Sea-level Change in Newfoundland and Labrador: Guidelines for Policy and Planning (M. Batterson and D.Liverman, 2010)
- Government of Newfoundland and Labrador Report Directory: www.canal.gov.nl.ca/reports/
Nova Scotia: Halifax, Sydney
Prince Edward Island: Charlottetown
New Brunswick: Saint John, Fredericton, Moncton Newfoundland & Labrador: St. John’s, Happy Valley-Goose Bay
Annex D: Resources for climate change
Part 1: Examples of Sources of Climate Scenarios Information
The following information was adapted from the Guidebook on Climate Scenarios (Ouranos, 2016). Note that this list is not an exhaustive enumeration of Canadian climate service providers but rather provides representative examples of what can be found on the web.
Environment and Climate Change Canada
This site provides information on climate change Canada including causes, facts, impacts and other information.
Canadian Climate Data and Scenarios (CCDS)
This site provides various formats for visualizing future climate scenarios for Canada.
National Climate Data and Information Archive
This site provides historical weather, climate data and related information for numerous locations across Canada including temperature, precipitation, degree days, relative humidity, wind speed and direction etc.
This site provides homogenized climate data for many climatological stations in Canada for temperature, precipitation, surface pressure, and wind.
Canadian Centre for Climate Modelling and Analysis
This site provides information on Canadian global and regional models along with plots of future projections.
Recent climate trends and variations
This site summarizes recent climate data and presents it in a historical context.
Pacific Climate Impacts Consortium Plan2Adapt
This Web site generates maps, plots and data describing projected future climate conditions for British Columbia.
This site provides data on climatic normals (1981-2010), temperature trends (1961-2010) as well as daily climate data for the province of Quebec.
This website generates climate scenarios and services among a wide range of services related to climate change science.
Newfoundland and Labrador Government – Office of Climate Change and Energy Efficiency
This webpage provides links to the Climate Change Projections for Newfoundland and Labrador and climate change IDFs for Newfoundland and Labrador.
North American Regional Climate Change Assessment Program (NARCCAP)
This program is dedicated to the production of high resolution climate simulations over North America.
Part 2: Examples of Climate Change and Floodplain Mapping
The following sub-section provides sources of examples of climate change and floodplain mapping and climate projections information.
Examples of Climate Change and Floodplain Mapping
- Climate Change Adaptation Guidelines for Sea Dykes and Coastal Flood Hazard Land Use: Guidelines for Management of Coastal Flood Hazard Land Use (PDF, 800 kb), By the British Columbia Ministry of Environment, January 2011
- City of Vancouver Coastal Flood Risk Assessment (PDF, 456 kb), Prepared for the City of Vancouver, December 2014
- Assessing coastal flood risk in a changing climate for the City of Vancouver, Canadian Water Resources Journal, February 2016
- Coastal Sea Level Rise Flood Risk Assessment Report – Capital Regional District (Victoria) (PDF, 652 kb), By AECOM, January 2015
- City of Moncton Climate Change Adaptation and Flood Management Strategy (PDF, 876 kb), Prepared by the City of Moncton, June 2013
- Climate Change Adaptation Measures for Greater Moncton Area, Atlantic Canada Adaptation Solutions Association, December 2011
- Construction and Analysis of Flood Risk Maps for Select Coastal Communities in Nova Scotia, Atlantic Canada Adaptation Solutions Association, 2011
- The Economic Impacts of the weather effects of climate change on communities, Prepared for the Insurance Bureau of Canada, May 2015
- Halifax Harbour Extreme Water Levels in the Context of Climate Change: Scenarios for a 100- Year Planning Horizon (PDF, 900 kb), Geological Survey of Canada, 2009
- Flood Risk Mapping Studies / Public Information Maps - Climate Change Adaptation (PDF, 120 kb), Newfoundland and Labrador Department of Environment and Climate Change. 2012- 2013
- Study areas include:
- Town of Stephenville
- Town of Stephenville Crossing/ Black Duck Siding
- Shearstown/Bay Roberts Area
- Goulds and Petty Harbour Area
- Town of Logy Bay – Middle Cove – Outer Cove
- City of Corner Brook/Petrie’s Brook
- Town of Portugal - Cove St. Philips
- Study areas include:
- Trent Severn Waterway: Water Management Study Evaluation of the Current Approach to Water Management (By request, see website.) Commissioned by Parks Canada, 2012
- British Columbia Lower Mainland Flood Management Strategy: Phase 1 Results & Next Steps (PDF, 402 kb), Prepared by the Fraser Basin Council, 2016
- Professional Practice Guidelines: Legislated Flood Assessments in a Changing Climate in BC (PDF, 605 kb), By the Association of Professional Engineers and Geoscientists of British Columbia, 2012
- Flood Mapping in BC (PDF, 000 kb), By the Association of Professional Engineers and Geoscientists of British Columbia, 2016
- City of Surrey Coastal Flood Adaptation Strategy, Developed by the City of Surrey, To be completed in 2018