
Details
- Publication date
- Author(s)
- ISBN
978-0-660-78867-8
Executive Summary
Publicly available assessments and forecasts of Canada’s battery ecosystem and its potential competitiveness often rely upon estimations based on global forecasts and corporate announcements, lacking precision on specific metrics. The benchmarks in this report support a common understanding of battery technology fundamentals, and a holistic stock taking of the strengths and capabilities, which should be referenced when assessing the potential of Canada’s battery ecosystem. The Office of Energy Research and Development (OERD) at Natural Resources Canada (NRCan) performed this benchmarking study, including a review of the Canadian battery ecosystem to help inform its funding and non-funding supports for battery innovation. This report also offers common battery definitions and targets for Canadian battery industry stakeholders, particularly decision-makers and investors.
Using the five battery frameworks introduced in the OERD’s Strategic Approach to Battery Innovation released in March 2024 as the lens for analysis, this report benchmarks the Canadian battery ecosystem along the following axes:
- battery stakeholders including firms and innovation infrastructure;
- battery demand and deployment; and
- application-defined technical battery performance indicators and targets.
Benchmarking data was extensively collected and referenced from consultancy reports, stakeholder engagements, and multiple publicly available sources including firm and institution websites, peer-reviewed literature, commercial battery specifications, and industry reports.
There are about 250 firms downstream of mining and exploration situated along the Canadian battery value chain and distributed across most of Canada. More than a quarter of these firms’ areas of focus span more than one value chain segment. Firms are concentrated in upstream and downstream segments, leaving the midstream punctuated by limited processing capability of raw material inputs into battery grade reagents and limited manufacturing of large-format battery cells. While there are battery firms of all sizes and at all stages of development in Canada, more than 60% are small, and more than half have operations in the R&D, pilot, pre-commercial, or planned stages.
Canada’s battery innovation infrastructure includes universities, research laboratories, pilot and testing facilities which cluster in four geographies—in Western Canada, Southern Ontario, Québec, and Nova Scotia. These innovation clusters provide physical technological infrastructure, skilled and collaborative resources, and facilities that accelerate the development of new ideas by encouraging innovative thinking and risk taking. However, infrastructure capable of producing battery cells in a final product-ready state is currently limited in Canada.
Demand for batteries in Canada is driven largely by the transportation sector, namely on-road light-duty battery electric vehicles, which reached about 18 GWh annual demand in 2024. Battery capacity additions in the electricity sector, while smaller, are expected to reach 4 GWh in 2025 to mostly address the energy shifting services and arbitrage markets. Total demand for batteries is expected to grow significantly in the next decade, and Canada could require 200 GWh of annual battery production in 2035 to meet its domestic needs across both segments. To put in perspective, global demand for batteries is forecast to reach more than 10,000 GWh in 2035 in the net-zero scenario.
Today and in the future, the competitiveness of Canada’s battery ecosystem critically depends on meeting key battery technical performance metrics, which include energy density, power density, cost, safety, lifetime, and sustainability.
Today’s high-performance lithium-ion cells with nickel chemistry (NMC) can cost about $160/kWh, provide energy densities exceeding 300 Wh/kg and 800 Wh/L, reach 500-1000 cycles before end of life, and emit 50-80 kgCO2eq/kWh in their production. Future targets of $95/kWh, 500 Wh/kg and 1150 Wh/L, 2000 cycles, and 20-30 kgCO2eq/kWh are set for 2035 (2040 for cost) for high-performance cells.
Today’s more affordable lithium-ion cells are based on iron chemistry (LFP) and can cost about $110/kWh, provide energy densities around 180 Wh/kg and 380 Wh/L, reach 6000 to 8000 cycles before end of life, and emit 40-70 kgCO2eq/kWh in their production. Future targets of $67/kWh, 270 Wh/kg and 550 Wh/L, 10,000 cycles, and 15-20 kgCO2eq/kWh are set for 2035 (and 2040 for cost) for affordable cells.
Multiple Canadian battery firms and researchers are innovating using a variety of approaches to be competitive today and to ensure their future competitiveness. These include incremental advances across the lithium-ion battery value chain in materials design and synthesis, as well as downstream innovation in the design and production of cells and packs. In addition, Canadian innovators are developing solid-state batteries, batteries with open architectures like flow batteries and metal-air batteries, and batteries with chemistries like sodium and other metal alternatives to lithium.
The Canadian battery ecosystem is still nascent, and in order to meet the objectives of decarbonization, security, and competitiveness, it must address the vulnerability along the middle segments of the battery value chain. Canada can develop a competitive advantage through the following innovations: manufacturing techniques, which can reduce costs and become less environmentally impactful; cell design, which can boost energy density or power density metrics; and battery chemistry innovations, which can tap into properties of alternative battery materials and components to achieve performances which are harder to reach for standard lithium-ion battery cells.
Table of Content
- Executive Summary
- List of Figures
- List of Tables
- 1. Introduction
- 2. Ecosystem
- 3. Battery Deployment
- 4. Battery Technology Benchmarking and Targets
- 5. Conclusion
- Appendix A - Explanation of Key Terms
- Appendix B - Battery Performance Metrics Descriptions
- Appendix C - Cell Energy Density Sample Calculation
- Appendix D - Reference Data
- Annex 1 – Firms in the Canadian Battery Ecosystem
- References
List of figures
- Figure 1: Visualization of the battery value chain
- Figure 2 Distribution of firm count by primary value chain segment along the middle segments of the battery value chain
- Figure 3: Relative size of companies across the middle segments of the battery value chain (Micro: 1-4 employees, Small: 5-99 employees, Medium: 100-499 employees, Large: 500 or more employees)
- Figure 4: Distribution of large companies (500 employees or more) across the middle segments of the battery value chain
- Figure 5: Distribution of companies along the middle of the battery value chain possessing a primary, secondary, and tertiary value chain segment
- Figure 6: Company distribution across battery component manufacturing
- Figure 7: Distribution of companies producing cells by chemistry, format, and commercial status. Large format cells are designated as (>20 Ah), with small format cells being below that threshold
- Figure 8: Distribution of companies operating at a pilot scale, of pre-commercial status, and operating commercially in the Battery Pack Assembly value chain segment
- Figure 9: Count of companies operating in stationery and mobility applications
- Figure 10: Emerging Canadian Battery Innovation Clusters
- Figure 11: National and provincial passenger EV registration statistics in Canada from 2020 to 2024. (Source: Statistics Canada)
- Figure 12: Annual Canadian battery demand for passenger battery electric and plug-in hybrid electric vehicles
- Figure 13: Annual Canadian battery demand in GWh for all vehicle types, assuming net-zero scenario by 2050. (Source: BloombergNEF)
- Figure 14: Projected cumulative stationary storage capacity in Canada assuming no major policy changes. (Source: BloombergNEF)
- Figure 15: Volumetric (measured in Wh/L) and gravimetric (measured in Wh/kg) energy densities for selected commercially available cells labeled by cell format (pouch, cylindrical, or prismatic). Energy densities are measured by discharging from 100% SOC at C/10 rate at 25°C until reaching the lower voltage limit (either 2V or 2.5V).
- Figure 16: Volumetric (measured in Wh/L) and gravimetric (measured in Wh/kg) energy densities for selected commercially available cells labeled by cell chemistry (NMC, LFP, NCA, Na-ion). Energy densities are measured by discharging from 100% SOC at C/10 rate at 25°C until reaching the lower voltage limit (either 2V or 2.5V).
- Figure 17: Gravimetric energy densities (measured in Wh/kg) and nominal cell capacities (measured in Ah) for selected commercially available cells labeled by cell format (pouch, cylindrical, or prismatic). Energy densities are measured by discharging from 100% SOC at C/10 rate at 25°C until reaching the lower voltage limit (either 2V or 2.5V).
- Figure 18: Continuous discharge power densities (measured in W/kg) and nominal cell capacities (measured in Ah) for selected commercially available cells labelled by cell format (pouch, cylindrical, or prismatic). Continuous discharge power densities are determined from discharging the cell from 100% SOC at 25°C until reaching 10% SOC and either reaching the lower voltage limit (either 2 or 2.5V) or reaching a maximum surface temperature of 68°C.
- Figure 19: Peak discharge power densities (measured in W/kg) and nominal cell capacities (measured in Ah) for selected commercially available cells labelled by cell format (pouch, cylindrical, or prismatic). Peak discharge power densities are determined by discharging the cell from 100% SOC at 25°C for 5 minutes
- Figure 20: Calendar aging dataset showing relative capacity decline and resistance growth of 232 commercial lithium-ion cells stored at four temperatures (24°C, 45°C, 60°C, and 85°C) and two SOC values (50% and 100%)
- Figure 21: Discharge capacity retention and equivalent full cycle capacity for commercially available cylindrical cells with 18650 form factor and LFP, NMC, and NCA cathode chemistry, charged at a rate of 0.5C and discharged at variable rates and SOCs. Extrapolated Equivalent Full Cycle (EFC) of LFP, NMC and NCA are show in top graph.
- Figure 22: Capacity retention of a Volkswagen ID.3 battery cell for different duty cycles in terms of (a) equivalent full cycles and (b) conversion to mileage and operating time
- Figure 23 Capacity retention data for the 4.5 Ah cylindrical INR21700-P45B cell from Molicel
- Figure 24: Fractional capacity and normalized voltage overpotential ∆V (indicative of resistance growth and power fade) of 240 mAh lithium-ion pouch cells constructed with single-crystal nickel manganese cobalt (NMC532) cathode material, artificial graphite, and common electrolytes, cycled from 3.0 to 4.2V at specified C-rates and temperatures
- Figure 25: Historical and future price ranges (USD) of NMC and LFP batteries alongside total cost of input materials
- Figure 26: Flows of all input materials and processing steps from raw materials to cell production of select Li-ion battery chemistries. Adapted from Xu et al
- Figure 27: (left axis, blue bars) LCA-derived GHG emission footprints of LFP and NMC chemistries manufactured in United States, European Union, and China; (right axis, orange bars) Regional electricity production emission factors for United States, European Union, China, and Canada grids. Note: The error bars show the variations in the calculated GHG emission footprint across these sources, and show how assumptions can impact the final accounting, but that nonetheless, there is general convergence between these analyses
- Figure 28: Schematic depictions of representative closed and open cell architectures, shown for (a) a conventional lithium-ion battery (closed system), and (b) a redox flow battery (open system)
- Figure 29: Typical cell types for commercial lithium-ion batteries
- Figure 30: Gravimetric and volumetric energy densities for LFP/graphite and NCA/graphite-SiOx cathode and anode chemistries at the theoretical and practical materials level, the cell level, and the pack level.
- Figure 31: Estimated battery peak charging power versus cell energy density for groupings of selected cathode active materials paired with graphite anodes for a hypothetical 100 kWh battery pack. Adapted from Masias et al.
- Figure 32: Energy density and power density trade-off for selected commercial cylindrical lithium-ion cells with NCA, NMC, and LFP cathode chemistry tested at different ambient temperatures.
- Figure 33: Image of a BYD Blade C102F prismatic LFP cell.
- Figure 34: A schematic illustration of (a) a conventional battery pack comprised of prismatic cells and (b) a battery pack with cell-to-pack integration.
List of tables
- Table 1: Applications of commercially available cells selected for benchmarking as provided from cell manufacturer websites, cell specifications, and third-party testing
- Table 2: Comparison of selected prismatic lithium-ion cells used in hybrid electric, plug-in hybrid and battery electric vehicles of similar size and their power capabilities
- Table 3: Figure 21 calendar aging results under various storage conditions
- Table 4: EUCAR Classification of battery cell safety hazards
1. Introduction
Batteries are positioned to play an important role in the energy transition, from electrification of transportation, to storing energy generated by renewable energy sources of wind and solar, for example. Leading battery technologies rely on critical minerals to offer high energy density storage solutions balanced against other important performance metrics depending on their end application. Understanding how each of these metrics is achieved as well as their potential, can help decision makers and investors right-fit battery solutions to their needs, as well as understand the relative gains and trade offs of battery innovations. This report supports this understanding by benchmarking the Canadian battery ecosystem of firms and innovation infrastructure, battery demand and deployment, and battery performance and targets.
In 2024, the Office of Energy Research and Development (OERD) at Natural Resources Canada (NRCan) released the Strategic Approach to Battery Innovation (SABI) that outlines three Pillars of a competitive, clean, and innovative battery ecosystem for Canada.Reference [1],Reference [2] The SABI also offers five conceptual and technical frameworks to create a common understanding of the electrochemical battery sector for decision makers, from various backgrounds be it science, policy, economics, or engineering. These five frameworks are: Anatomy of a Battery, the Battery Value Chain, Scales of Battery Technology Readiness Levels, Battery Performance Metrics, and Battery Sustainability.
These frameworks are the basis of this benchmarking report and were used to highlight six main performance metrics for batteries. For each performance metric, current-day benchmark values and targets across leading and emerging technologies are presented for Canadian innovators to compare against and to strive toward in the medium- to long-term. Both the benchmark and target values are derived from commercial specifications, technology roadmaps, literature review, and technology projections, to ensure the continued competitiveness of Canadian innovations. As such, the target values are derived based on multiple considerations and are offered as potential values for each metrics category. Appendix A - Explanation of Key Terms, explains the nuances of each metric.
To fully contextualize the Canadian opportunity, this report first presents the state of the battery ecosystem, including battery firms and innovation infrastructure. The SABI identified these as the two pillars underpinning decarbonization, security, and competitiveness of the Canadian battery value chain. While these were identified as the key pillars for battery innovation, since the battery ecosystem is still nascent in Canada, they can be used to evaluate the state of the ecosystem, not just its innovation arm. By providing a snapshot of the battery ecosystem, practitioners can understand how their work is supporting strengthening the overall battery value chain.
The potential demand for batteries in Canada is then presented based on global projections and domestic policy targets. This section quantifies the two greatest opportunities by market size for electrification supported by batteries: transportation and electricity. This demand feeds into the targets in this report and can be used by decision makers to benchmark future domestic production and import potential for Canada.
The benchmarks presented in this report provide reference data to determine the success of Canada’s battery innovation ecosystem. Decision makers can use the technical benchmarks to decide the relative impact of new battery innovations against the backdrop of an existing, competitive field. Setting competitive targets allows for long-term planning of research, development, and demonstration (RD&D) program goals by prioritizing performance trade-offs to meet intended customer requirements. For OERD, benchmarking the Canadian battery ecosystem allows insight into progress made toward the goals of the SABI, and highlights gaps in the value chain where more support is needed.
2. Ecosystem
The Canadian battery ecosystem refers to firms and institutions established in Canada and activities involved in RD&D, the production, (re)use, and recycling of batteries. This includes the entire value chain, from sourcing critical minerals and manufacturing battery components to cell production, assembly, and eventual recycling (see Figure 1).

Figure 1: Visualization of the battery value chain
Figure 1 - Text version
The supply chain spans battery minerals extraction and refining, battery materials and component production, and cell and pack manufacturing. As the supply of battery inputs strains to keep up with growing demand, battery recycling and broader circularity efforts are necessary to extract maximum value and minimize waste, which completes the value chain.
Canada is recognized as a leading mining nation, and intends to create competitive supply chains for critical minerals and value-added products, processes and technologies for zero-emission vehicles, including Li-ion batteries, permanent magnets and specialty alloys.Reference [3] Canada has also invested in its transportation and automotive manufacturing industry, building on the fact that Canada is one of the world’s top 12 producers of light vehicles, with five global original equipment manufacturers (OEMs) assembling more than 1.4 million vehicles at their Canadian plants each year.Reference [4] The electrification of the automotive and transportation sectors has been guided by a “mines to mobility” approach. This approach seeks to develop a sustainable Canadian battery ecosystem for transport and electric vehicles (EVs). Large investments have been announced to support EV battery manufacturing, and supports have been put in place, including those under the Canadian Critical Minerals Strategy and through investment tax credits, to support the development of critical minerals mining and processing.Reference [5]
As stated in the SABI:
…establishing a fully decarbonized value chain for batteries that is secure and competitive requires Canada to have: the innovation infrastructure to develop homegrown solutions and expertise; and domestically located firms to take these innovations to market.
The Exploration & Mining segment of the value chain is well established with Canada producing 60 minerals and metals at almost 200 minesReference [6], including copper, graphite, iron, lithium and nickel, considered essential to leading Li-ion battery chemistries.Reference [7] In 2024, BloombergNEF ranked Canada first in its annual Global Lithium-ion Battery Supply Chain Ranking due to its abundance of critical minerals, as well as manufacturing and production advances, strong ESG credentials, and policy commitments. This assesses the potential of countries to build a reliable and sustainable battery supply chain. This year, Canada fell to second place (after China), largely due to slower-than-expected battery demand.Reference [8]
This section examines the approximately 250 firms distributed downstream from the Exploration and Mining segment, and its disproportionality to this upstream segment which motivates a more in-depth analysis of the middle of the value chain supporting its decarbonization, security, and competitiveness.
2.1. Battery Firms in the Supply Chain
This section focuses on the firms that support the segments downstream of Exploration & Mining in the battery value chain. These segments are considered more vulnerable in comparison to the upstream minerals sector (and downstream auto sector) in Canada, since most of the midstream is made up of smaller and less established entities, relying more on Canada's public innovation infrastructure to grow. The vulnerability is inherent to rapidly upscaling innovative technologies in a highly competitive global sector, which is largely affected by market drivers such as EV adoption, domestic policy targets, and trade policies. Furthermore, this vulnerability poses a security risk by overreliance on insecure supply chains and reduces the competitiveness of the transportation and electricity sectors.
The Canadian battery ecosystem is comprised of around 250 companies along the battery processing, component, cell, pack, application, and reuse and recycling segments of the value chain (see Figure 2). Organizations were classified along the primary value chain associated with their Canadian operations. Both announced and paused operations are included in this accounting and no distinction is made between pre-commercial, foreign-owned, or established firms. This way, this ecosystem reflects the technology potential, rather than the industrial potential for the Canadian battery ecosystem.
Several of the companies have activities that span multiple battery value chain segments, but for the purpose of this review, each company was assigned a single ‘primary’ value chain segment defined as follows.
- Processing is considered the production of battery-grade reagents with >99% purity.
- Battery component manufacturing includes active battery materials and non-active components found inside a cell (as well as cathode precursor).
- Battery cell manufacturing produces semi-finished products that are capable of reversible cycling.
- Battery pack assembly includes assemblies of multiple cells wired together in series and parallel, and includes battery management systems.
- Mobility and stationary storage applications are considered end-use, where mobility includes OEMs of electric land, sea, and air vehicles. Stationary storage applications includes vendors of stationary storage, but not electric utilities of market actors.
- Reuse and recycling include the second-life application of cells after first use and the reconstitution and reinsertion of end-of-life and scrap battery material into upstream segments of the value chain, respectively.
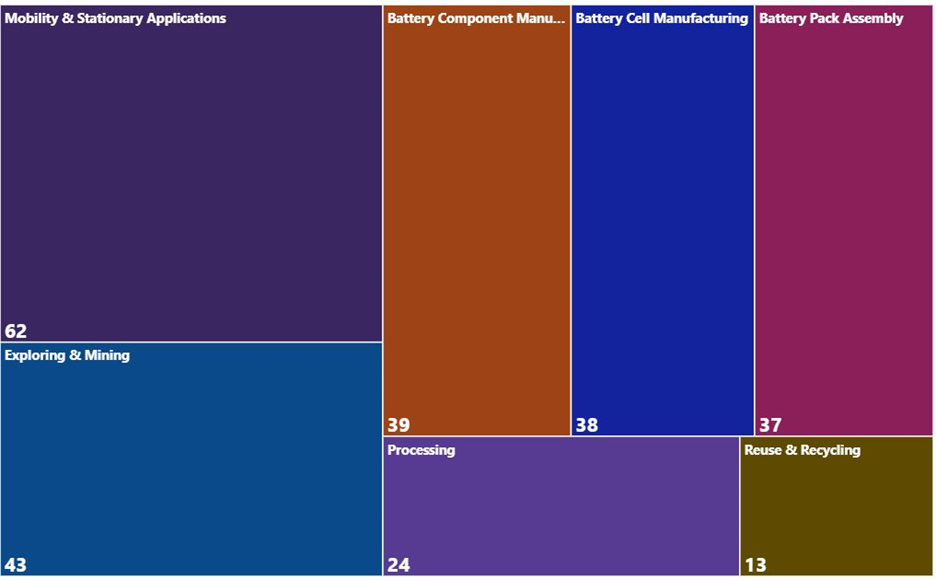
Figure 2: Distribution of firm count by primary value chain segment along downstream segments of the battery value chain
Figure 2 - Text version
The distribution of firms in Canada across the different value chain segments:
- 62 firms having Mobility & Stationary Applications as their primary economic activity
- 43 firms having Exploration & Mining as their primary economic activity
- 39 firms having Battery Component Manufacturing as their primary economic activity
- 38 firms having Battery Cell Manufacturing as their primary economic activity
- 37 firms having Battery Pack Assembly as their primary economic activity
- 24 firms having Processing as their primary economic activity
- 13 firms having Reuse & Recycling as their primary economic activity
The lack of any large-scale component or cell manufacturing in Canada at time of writing this report reflects the immaturity of these value chain segments. Company size can be used as a rough indication of progress towards commercialization, with companies developing low TRL products likely to be micro-sized and small-sized, while companies with commercialized facilities likely to be large. This is not always true since large companies do invest in R&D at various TRLs. But in the absence of project level TRL data across all organizations, company size is used as a proxy for technology advancement towards commercialization. For instance, 77% of firms in the component segment and 63% of firms in the cell segment are micro- and small-sized. Most companies across all downstream segments, including vendors of mobility and stationary storage applications segment, are small companies, with cell, components, and processing companies having the greatest proportion of their total numbers being small firms (see Figure 3).

Figure 3: Relative size of companies across the downstream segments of the battery value chain (Micro: 1-4 employees, Small: 5-99 employees, Medium: 100-499 employees, Large: 500 or more employees)
Figure 3 - Text version
The distribution of companies in the Canadian Battery Value Chain classified by size:
- 134 small companies (5 to 99 employees)
- 36 medium companies (100 to 499 employees)
- 27 large companies (500+ employees)
- 16 micro companies (1 to 4 employees)
Figure 4 shows that large companies dominate in three segments: Mobility & Stationary Applications, Battery Cell Manufacturing, and Battery Pack Assembly. While the majority of the large companies from the Mobility & Stationary Storage segments are commercial, that is not the case for the other segments. Larger firms in the other segments are higher TRL, but still pre-revenue, and shows the high capital investment needed to build a vertically integrated supply chain in Canada.
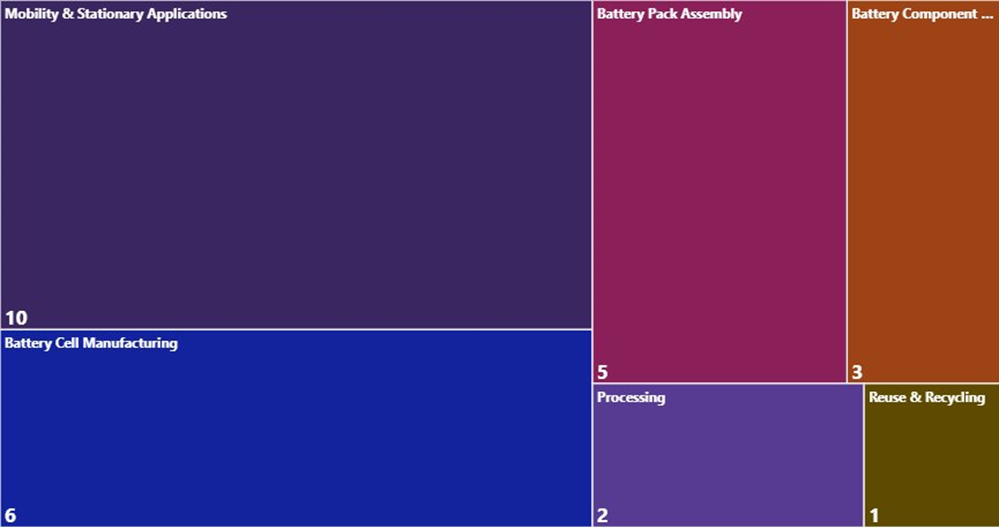
Figure 4: Distribution of large companies (500 employees or more) across the downstream segments of the battery value chain
Figure 4 - Text version
The distribution of large companies in the downstream segments of the Canadian Battery Value Chain:
- 10 large companies active in Mobility & Stationary Applications
- 6 large companies active in Battery Cell Manufacturing
- 5 large companies active in Battery Pack Assembly
- 3 large companies active in Battery Component Manufacturing
- 2 large companies active in Processing
- 1 large firm active in Reuse & Recycling
Less than 10% of companies along the middle segments of the battery value chain, regardless of their size, operate across multiple value chain segments (see Figure 5). Presence in multiple value chain segments serves as a proxy for vertically integrated operations, highlighting that even in the case of larger companies, the capital investment demand is burdensome. An example of a vertically integrated company would be one developing an innovative chemistry for Li-ion batteries tailored for their energy storage deployment to support renewable energy generation. Such integration can support end application focussed innovation. However, Canadian companies working in multiple segments tend towards lower TRL and pre-commercial operations, or have planned deployments. This reality reinforces the vulnerability of the middle segments of the value chain.

Figure 5: Distribution of companies along the middle of the battery value chain possessing a primary, secondary, and tertiary value chain segment.
Figure 5 - Text version
The distribution of companies according to their active participation in the Canadian Battery Value Chain:
- 213 companies have economic activities in at least one segment of the value chain.
- 56 companies have economic activities in both a primary and secondary segment.
- 14 companies have economic activities in three or more segments of the value chain.
2.1.1. Processing
Processing of mined materials to battery grade reagents is the value chain segment with the second fewest number of firms in the Canadian battery ecosystem. This includes processing materials intended to supply the battery value chain, specifically Li-ion batteries: lithium, nickel, cobalt, manganese, copper, and graphite.
Battery grade lithium is processed either by refining minerals from spodumene/petalite concentrates or by extraction from underground reservoirs of lithium-rich brine.Reference [9] There are currently two lithium mines operating in Canada that supply within the country, limiting throughput to processing operations, but several advanced projects are in development. Reference [10] Projects planning to process lithium from brine are primarily located in the prairie provinces with projects planning to mine and process mineral concentrates being concentrated primarily in Ontario and Quebec. Canada does not currently have any commercial operations producing lithium battery chemicals.
Graphite is a critical battery mineral for anode electrode composition in li-ion batteries. Currently, Canada has one operating graphite mine (which is also the only one in North America), but this is believed to largely supply non-battery markets. Several advanced projects are in development that could mine and process battery-grade anode material. For nickel and cobalt, essential cathode components for high energy density NMC cells, Canada is a current mined producer but does not have any operating battery chemical production. However, like with lithium and graphite, there are several advanced projects advancing to mine more battery minerals and produce battery chemicals.
There are a number of processing and exploring & mining companies that have prospective operations in both segments, providing a path forward towards the growth of the segment in Canada. These potential processing projects are highly dependent on favorable market conditions and the continued development of the downstream ecosystem to support demand and may face challenges associated with highly concentrated global markets for processed battery minerals. Ongoing efforts in upscaling the processing industry bridges the gap between mining & exploration and end use battery applications, integral towards a vertically integrated “mines-to-mobility” battery industry.
2.1.2. Component Development and Manufacturing
The component development and manufacturing segment has the greatest number of companies after mobility & stationary applications, although the majority are pre-revenue. This segment covers several different types of components, including cathodes, anodes, electrolytes, separators, current collectors, and membranes. Given the variety within this value chain segment, it is logical to see a spread across company sizes. Figure 6 below breaks down these companies into further types of battery components. Companies developing more than one of these components are counted once in each category.
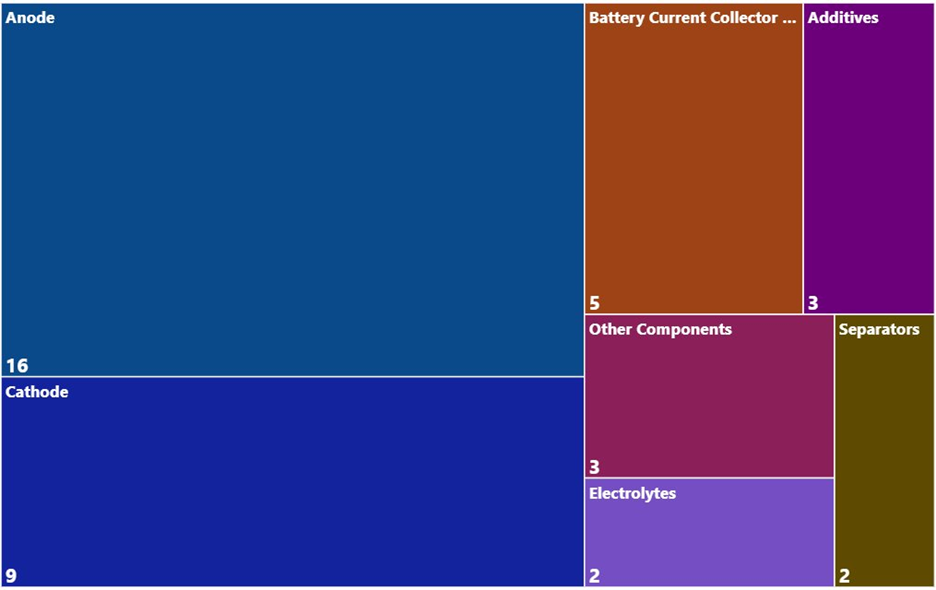
Figure 6: Company distribution across battery component manufacturing
Figure 6 - Text version
Distribution of companies in the battery component manufacturing segment of the value chain:
- Anodes: 16 companies
- Cathodes: 9 companies
- Battery current collector foils: 5 companies
- Additives for battery component production: 3 companies
- Electrolytes: 2 companies
- Separators: 2 companies
- Other components (e.g., redox flow battery electrolyte, non-Li-ion reagents): 3 companies
Anodes show the largest number of companies working in this space but they are only micro-sized and small companies. This is in part due to the focus on next-generation anode materials to replace graphite. Silicon anodes are a promising candidate for this purpose but is still a lower TRL therefore most companies are still small and growing. Some firms working on graphite and lithium metal anodes but with further upstream operations in the value chain were tagged as processing, rather than component manufacturing. Overall, to anchor the battery supply chain in Canada further, more scale-up of domestic anode manufacturing is needed.
Cathode companies, conversely, are generally larger but in fewer numbers. This is driven by foreign direct investment in cathode plants alongside EV manufacturing. While the battery cathode innovation activities that do occur in Canada tend to focus on novel production of commercially mature cathode materials, there is less focus on lower TRL innovation and development of next-generation cathode chemistries. To grow Canada’s competitive advantage, a greater emphasis on new cathode technologies is needed.
There is one company commercially producing current collectors in Canada and a few planned facilities that will produce separators. Although separators are a non-active component of battery cells, they still influence performance of the battery and this provides an opportunity for more innovation focus.Reference [11] Likewise, current collectors are non-active components but affect battery performance depending on electrical conductivity, contact resistance, and corrosion resistance,Reference [12] yet only two companies are situated in the segment, leaving room for greater saturation.
While there are firms in Canada that focus on solid-state electrolyte cells and flow battery electrolytes, there is room for more innovation in conventional and next-generation liquid electrolytes for lithium-ion cells.
Other components include electrolytes, electrodes, and reagents for use in non-Li-ion cell compositions. Generally, companies with this designation are involved in vertically integrated operations towards an end-use application of non-li-ion long duration energy storage systems. These companies are at the first stages of commercialization or pursuing technology deployment at the demonstration scale, highlighting the necessity to produce components upstream in the case of novel architecture or chemistry end-use applications despite the increased capital investment requirement.
Given this relatively sparse presence in the Canadian ecosystem, more investment in these areas could boost the resilience of the supply chain and boost Canadian competitiveness.
2.1.3. Cell Development and Manufacturing
Cell development and manufacturing is a segment that is comprised of both smaller start-ups making cells for specialized applications as well as those targeting large-scale production for the mobility and stationary storage markets. Despite this presence, there is currently no large-scale cell production in Canada, with multiple projects on hold, discontinued or put at risk in recent years (see Figure 7).
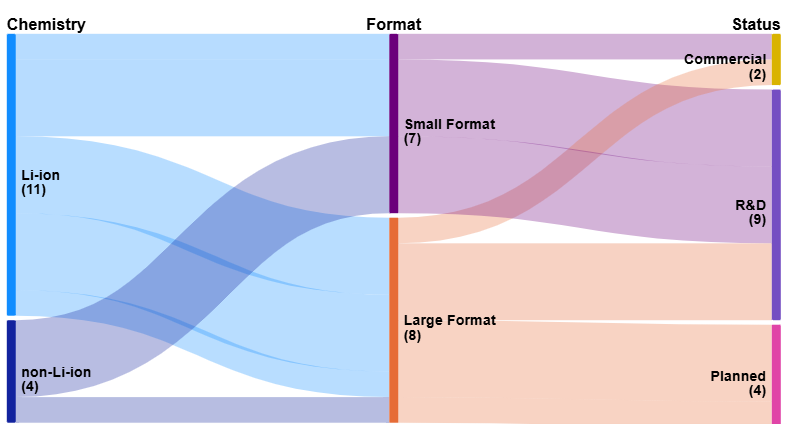
Figure 7: Distribution of companies producing cells by chemistry, format, and commercial status. Large format cells are designated as (>20 Ah), with small format cells being below that threshold.
Figure 7 - Text version
The Sankey diagram illustrates the relationships between battery chemistry, format, and status:
Chemistry
- Li-ion: 11
- non-Li-ion: 4
Format
- Small format: 7
- Large format: 8
Status
- Commercial: 2
- R&D: 9
- Planned: 4
Flows indicate that most Li-ion chemistries connect to both small and large formats. Large formats are primarily linked to planned status, while small formats are linked with R&D and some commercial. Non-Li-ion chemistries mainly flow toward small formats and R&D status.
By number of companies, the battery cell development and manufacturing segment is among the larger ones, in the Canadian battery value chain, demonstrating strong potential for the ecosystem. There currently is only one company producing large-format, lithium-ion cells at a commercial scale leaves one company, and it is currently offshoring their cell manufacturing capabilities in Canada.
While lithium-ion is currently the dominant global battery technology, 50% of firms in this segment in the ecosystem specialize in non-lithium chemistries such as sodium-ion, zinc-ion and alternative cell concepts such as metal-air and flow batteries. These technologies are primarily suited to niche applications for the stationary storage market, which prioritize cost and other performance metrics over energy density.Reference [13],Reference [14] As a result, the subsegment is dominated by micro- and small-sized companies, and by proxy, indicates that battery technologies with non-lithium chemistry are generally lower TRL than their lithium-ion counterparts. Less than one third of firms in this segment focus on conventional lithium-ion technology, and the remainder are developing next-generation cell technologies such as lithium-sulfur, lithium-metal, and solid-state batteries. Increasing Canada’s capability to produce large-format lithium-ion cells is a noticeable gap in its battery ecosystem.
2.1.4. Battery Pack Assembly
The battery pack assembly segment is split between three main areas of focus: pack assembly for mobility and stationary use applications; battery management systems responsible for maintaining safe operations; and thermal management of cells so that degradation is minimized and there is no thermal runaway. In contrast to the more upstream segments, most companies in this segment are operating in a commercial capacity (see Figure 8).

Figure 8: Distribution of companies operating at a pilot scale, of pre-commercial status, and operating commercially in the Battery Pack Assembly value chain segment.
Figure 8 - Text version
Distribution of companies operating at different stages of technological development in the Battery Pack Assembly segment of the value chain:
- Pilot: 8%
- Pre-Commercial: 21%
- Commercial: 71%
The pack assembly subsegment accounts for most of the activity in the broader segment. Companies designated as pack assembly firms can be split generally along three business lines: producers; distributors; and integrators. Distributors are companies whose business model centers around the sale of third-party battery packs. Integrators may operate as battery management system configuration and thermal management setup. Distributors and integrators source their product, or critical components of their product from abroad, and these companies are all operating commercially. Producers are concentrated among large automotive OEMs with plans to vertically integrate battery cell manufacturing and pack assembly at their facilities. There remains a barrier of significant capital expense for companies commercializing pack assembly in Canada, necessitating continued support for the segment.
2.1.5. Mobility & Stationary Applications
The Mobility & Stationary Applications segment is the largest among the downstream segments of the battery value chain, and accordingly, has the greatest number of large companies and commercial operations. The stationary applications subsegment holds a wide range of applications, from residential battery storage, low temperature microgrid application for northern communities, and utility scale battery energy storage systems. The overwhelming majority of these companies are operating at a commercial scale, ranging from small to large.
The exception to this are vertically integrated companies specializing in alternative chemistry energy storage systems, which account for ~14% of the stationary storage companies. It is noted that the analysis of the stationary storage subsegment is non-exhaustive, nevertheless the distribution between mobility and stationary applications can be seen in Figure 9, and shows a greater number of stationary storage industry, by number, compared to mobility focussed companies.
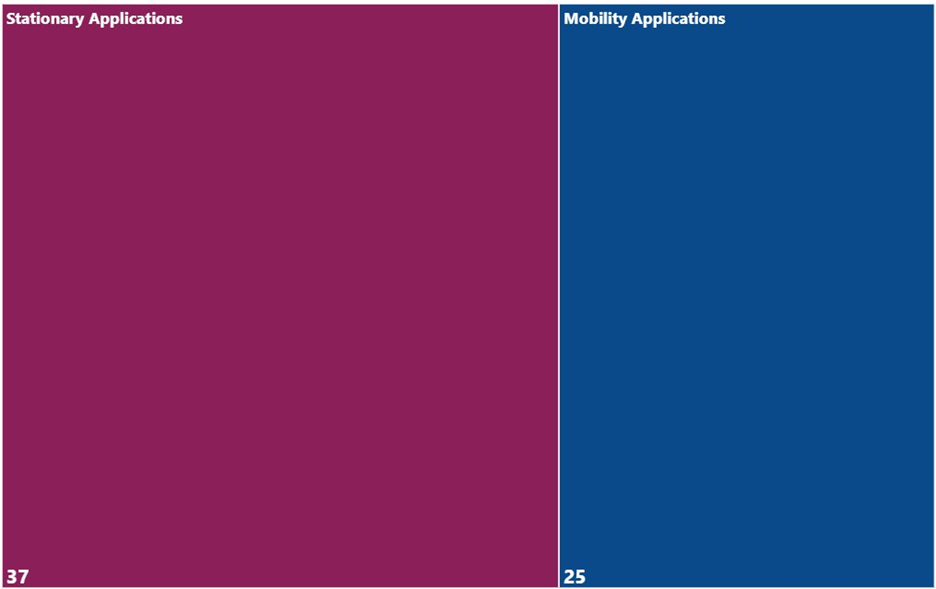
Figure 9: Count of companies operating in stationery and mobility applications.
Figure 9 - Text version
The distribution of firms operating in the Canadian battery ecosystem by application:
- Stationary applications: 37 companies
- Mobility applications: 25 companies
The mobility applications subsegment is composed of transport electric vehicle companies, such as electric buses or trains, light duty vehicles such as e-bikes, medium & heavy-duty vehicles for construction and logistics operations, recreational vehicles for snow and marine transport, and passenger electric vehicles.
This EV passenger segment stands out as having almost no medium-sized companies or smaller, indicating the difficulty of growing to scale in this segment. It should be noted that this segment only considers battery-integrated EV manufacturing without considering either EV parts such as electric motors or tires. Given the dominance of large OEMs in this sector, it is unlikely that newcomers will easily compete to reach high TRL production without significant supports. However, the presence of these downstream players does provide opportunities for the midstream of the supply chain to partner with adopters of their technologies.
2.1.6. Reuse and Recycling
Finally, reuse and recycling of end-of-life batteries is currently the smallest segment of the supply chain. Firms recycling lithium-ion batteries in Canada are currently at capacity from supply of manufacturing scrap, despite the low volumes of end-of-life batteries, and this segment is set to grow significantly as EV and stationary storage systems are deployed and retired. Furthermore, end-of-life vehicle batteries supplement a growing battery pack reuse market, using second life batteries retaining at least 50% of their original capacity in battery energy storage systems.
The companies in this segment focusing on battery processing and materials recovery are small and medium sized homegrown companies. They show potential for future growth to support the anticipated battery recycling needs in Canada. However, their growth should be timed with EV adoption and retirement growth to ensure continued profitability. Larger companies exist in the end-of-life battery collection, however, given the size of this segment there is an insufficient supply for large capacity battery recycling at this time.
Call2Recycle’s 2022 primer on “Electric Vehicle Battery Management at End-of-Vehicle Life” projected four commercial battery material recovery companies operating in Canada by 2025, of those four, two are currently operating at that scale.Reference [15] While today, no large volumes of end-of-life batteries exist, greater supply in coming years will provide battery recycling companies at economies of scale. The Transition Accelerator’s Roadmap for Canada’s Battery Value ChainReference [16] outlines a minimum required recycling capacity of 27 GWh of batteries by 2035 to maintain its share of the North American market. This presents an opportunity to collocate recycling facility with existing battery production hubs while production facilities optimize their processes, and for recycling firms to feed production facilities once recycling volumes reach steady state.
2.1.7. Ecosystem Conclusions
The Canadian battery ecosystem is evolving from a resource-rich, innovation-driven network to one with the necessary operations to support a vision for domestic production. Significant domestic supplies of battery inputs exist in Canada, such as lithium, nickel, manganese, cobalt and graphite and plans are in motion to support the downstream sector with an emerging capacity to support mineral processing and battery component development. Canada is well-positioned to build a resilient, vertically integrated battery value chain; however, challenges remain. The critical middle segments remain vulnerable due to limited and delayed growth, affecting the establishment of a complete value chain. Securing industrial partnerships, targeting investments, and securing the ingenuity and presence of the Canadian battery industry can reinforce the middle segments, and make Canada’s battery value chain compete at a global stage.
2.2. Battery Innovation Infrastructure
The battery ecosystem is also made up of innovation infrastructure including physical and technological infrastructure, skilled and collaborative resources, and facilities that accelerate the development of new ideas by encouraging innovative thinking and risk taking. While these resources and activities exist in industry, they also exist as stand-alone battery innovation research centers in academia and as their own organizations.
Canada’s innovation infrastructure has been supported for many decades by research expertise in academia and laboratories across the country, and this continues today. Many research institutions and laboratories have expertise and capabilities to support battery innovation amongst other priorities. Today, there are multiple institutions dedicated to battery development specifically as their core business.
Battery innovation centers, generally focusing on lower TRL innovations, contribute vital capacity to generate Highly Qualified Personnel (HQP) and new technologies. These new technologies may eventually reach commercial viability and drive Canada’s economic competitiveness. These innovation centres provide an opportunity for existing for-profit firms to test their technologies and cross-collaborate in their field of work, enable access to equipment that could otherwise be out of reach, and train HQP to continue this work.
The following academic centres are worth noting as a testament to the growing investments in academic research in batteries technologies.
- CEGEP network – Training programs aimed at Battery and Electric Vehicle sectors
- Concordia University – Volt-Age Electrification Research Program
- Dalhousie University – Canadian Battery Innovation Centre
- McGill University – McGill Centre for Innovation in Storage and Conversion of Energy
- McMaster University – Centre for Mechatronics and Hybrid Technologies
- University of British Columbia – Battery Innovation Research Excellence Cluster
- University of Calgary – Western Canada Battery Consortium
- University of Toronto – Electrification Hub
- University of Waterloo – Ontario Battery and Electrochemistry Research Centre
These are in addition to public research facilities such as the National Research Council pilot-scale battery manufacturing line facility and their battery performance and safety evaluation research facility, and Hydro-Québec Research Institute (IREQ) Centre of Excellence in Transportation Electrification and Energy Storage. Battery innovation centers round out the Canadian battery ecosystem by anchoring battery clusters on a geographical basis, as seen in Figure 10.
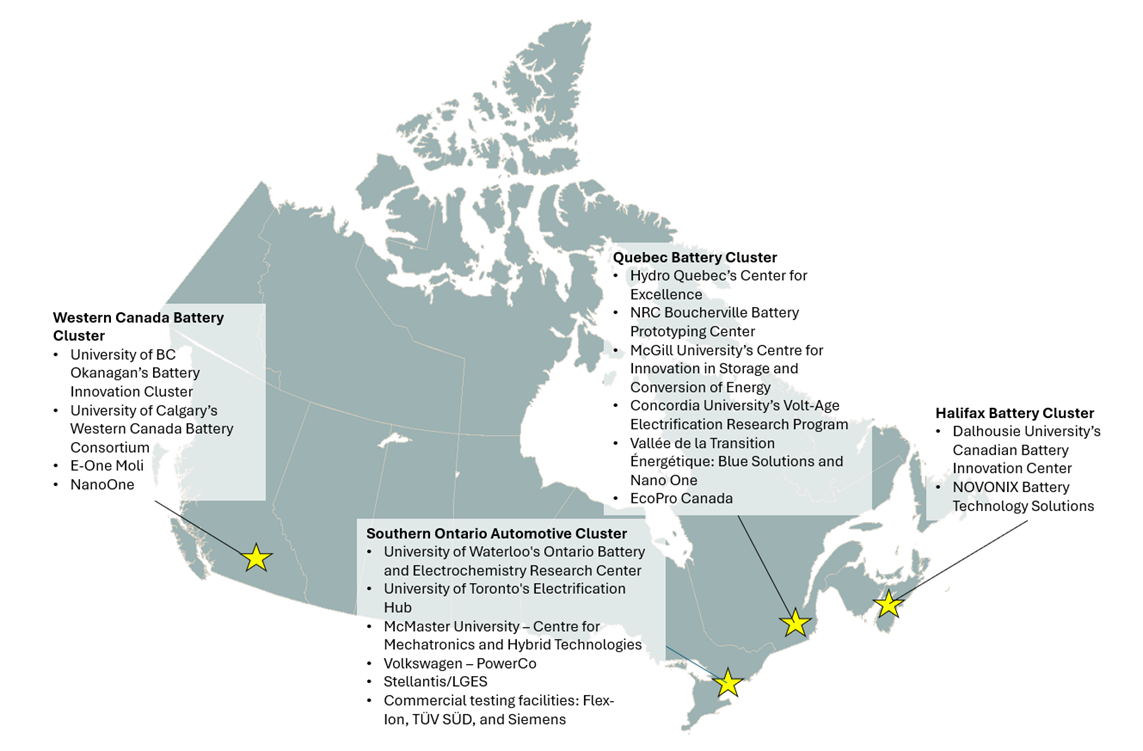
Figure 10: Emerging Canadian Battery Innovation Clusters
Figure 10 - Text version
The map of Canada highlights four Emerging Canadian Battery Innovation Clusters located in British Columbia, Southern Ontario, Quebec, and Nova Scotia:
Western Canada Battery Cluster:
- University of BC Okanagan’s Battery Innovation Cluster
- University of Calgary’s Western Canada Battery Consortium
- E-One Moli
- NanoOne
Southern Ontario Automotive Cluster:
- University of Waterloo’s Ontario Battery and Electrochemistry Research Center
- University of Toronto’s Electrification Hub
- McMaster University – Center for Mechatronics and Hybrid Technologies
- Volkswagen – PowerCo
- Stellantis/LGES
- Commercial testing facilities: Flex-Ion, TÜV SÜD and Siemens
Quebec Battery Cluster:
- Hydro Quebec’s Center for Excellence
- NRC Boucherville Battery Prototyping Center
- McGill University’s Centre for Innovation in Storage and Conversion of Energy
- Concordia University’s Volt-Age Electrification Research Program
- Vallée de la Transition Énergétique : Blue Solutions and Nano One
- EcoPro Canada
Halifax Battery Cluster:
- Dalhousie University’s Canadian Battery Innovation Center
- NOVONIX Battery Technology Solutions
Western Canada Battery Cluster: Western Canada’s battery innovation presence is bolstered by the Battery Innovation Cluster at the University of British Columbia Okanagan, which includes a Battery Innovation Centre, planned to open in 2026, which will feature battery prototyping serving industry and academia, and the Western Canada Battery Consortium at the University of Calgary. These facilities are mainly focused on solid-state battery technologies and advanced manufacturing. E-One Moli has had an R&D facility in Maple Ridge, BC since the 1990’s and chose to expand on their existing lithium-ion R&D and manufacturing facility in 2023, although these plans have been halted as the parent company prioritizes its Taiwanese cell production. Nano One’s Innovation Hub in Burnaby, BC was expanded in 2023 to further their in-house innovation and production of cathode battery materials including lithium iron phosphate (LFP), lithium nickel manganese cobalt oxide (NMC), and lithium nickel manganese oxide (LNMO) cathode chemistries.
Southern Ontario Automotive Cluster: The Southern Ontario cluster is localized around its prominent automotive manufacturing base. The University of Waterloo has recently launched the Ontario Battery and Electrochemistry Research Center, which focuses on next-generation battery chemistries for high energy density. The University of Toronto is home to the Electrification Hub, also focusing on applications of batteries such as mobility needs. McMaster University’s Centre for Mechatronics and Hybrid Technologies focuses on advanced automotive technology, including battery testing, modelling and characterization. This cluster has attracted the most interest of companies looking to establish gigafactories in support of existing OEMs, such as the PowerCo and LGES gigafactories to supply Volkswagen and Stellantis respectively. Additionally, this area is home of commercial battery development and testing facilities such as: Flex-Ion who offers battery development from chemistry development, cell, module, and pack manufacturing; and TÜV SÜD who offers battery cycling and abuse testing as well as post-mortem analysis. At the time of writing, Siemens also announced that they will establish a Global AI Manufacturing Technologies R&D Center for Battery Production, initially located in Oakville, Toronto, and in Kitchener-Waterloo.
Québec Battery Cluster: The Quebec battery cluster is anchored by Hydro Quebec’s long-spanning work in battery innovation at the Center of Excellence in Transportation Electrification and Energy Storage, and further grown by recent investments by the provincial government in battery manufacturing through EcoPro, in Shawinigan, QC. The National Research Council’s pilot-scale battery manufacturing line, located in Boucherville, QC, facilitates prototyping small and large cells, using industry fabrication processes, de-risking new battery technologies. The Vallée de la transition énergétique (VTE) promotes an industrial park in Bécancour, QC, where investments seek to promote their goals for the battery sector. While not directly an R&D centre, this clustering has promoted itself as a test bed for innovative technologies. This cluster includes innovating companies such as Blue Solutions (specializing in solid-state batteries) and Nano One (LFP cathode active material). McGill’s Centre for Innovation in Storage and Conversion of Energy and Concordia University’s Volt-Age Electrification Research Program add to this innovation cluster, in addition to many other academic institutions with electrification expertise more generally.
Halifax Battery Cluster: The Halifax battery cluster is anchored by Dalhousie University, which has recently launched the Canadian Battery Innovation Center, which aims to accelerate scale-up of innovations by enabling construction of next generation battery cells that meet industrial standards and thereby demonstrate feasibility. Many innovations and HQP at leading battery/energy companies have come out of the Jeff Dahn Research Group lab in the last few decades, primarily focusing on material scale-up, grid storage, and sustainable cells. The Novonix Battery Technology Solutions division, with facilities located in the Halifax, NS area, provides state-of-the-art battery testing equipment for laboratory R&D, and offer pilot cell manufacturing and testing.
Future anchoring of these clusters could include more intentional partnerships in the form of “hubs” and infrastructure capable of producing cells in the final product-ready state (i.e. B-samples), such as large format cells produced at minimum industrial production rates.
3. Battery Deployment
The two largest applications driving demand for battery deployment are the transportation and electricity sectors. In transportation, batteries in EVs displace the need for fossil fuel combustion in an internal combustion engine. In the electricity sector, batteries can support a resilient electricity grid by storing electricity generated by renewable energy sources such as solar and wind, and using that energy to meet peak demand and provide fast and accurate grid balancing services, capable of displacing those provided by fossil fuel generators.
Measuring the deployment of batteries for these applications provides indicators toward the health and potential of the battery supply chain. Increasing demand derisks investments in the supply chain that rely on market stability and growth.Reference [17] Conversely, an observed slowdown in these deployments due to softening demand for EVs has created roadblocks for the battery sector, as seen in recent announcements to investments in Canada. Supply chain bottlenecks due to policy uncertainty or trade restrictions can also impact deployment.
3.1. Transportation
In 2023, the transportation sector was the second largest source of GHG emissions, accounting for 23% of total national emissions.Reference [18] To reach net-zero emissions in Canada by 2050, the transportation sector must transition away from internal combustion engine vehicles. To date, this transition has been almost fully driven by on-road light-duty battery electric vehicles (BEVs).Reference [19] To track this, EV sales as a percentage of total new passenger vehicle registrations is reported on a quarterly basis (see Figure 11).Reference [20] By assuming a vehicle lifetime of 15 years, 100% of new vehicles would need to be EVs by 2035 to meet the net-zero target by 2050.
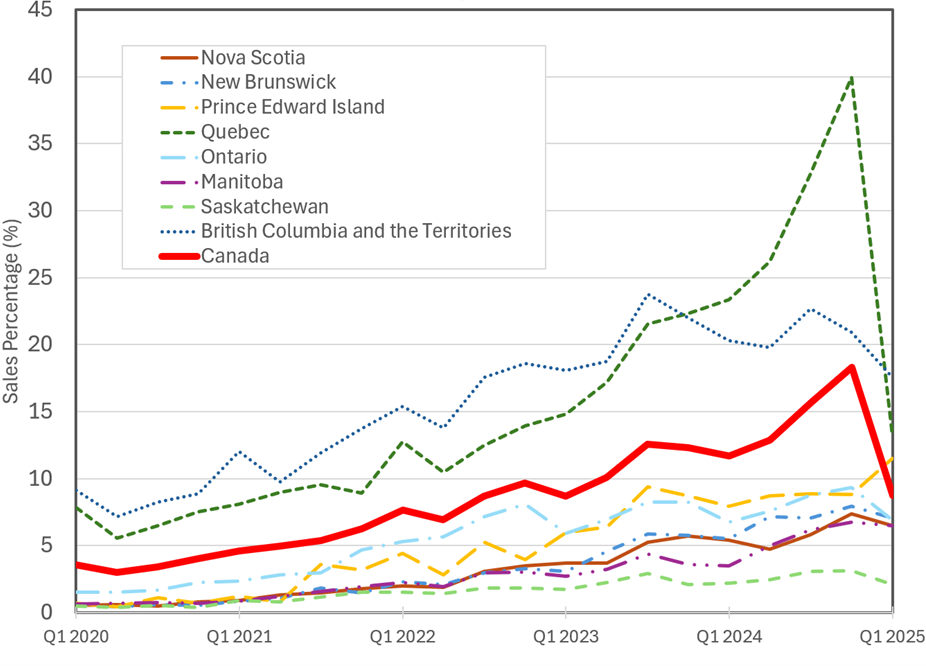
Figure 11: National and provincial passenger EV registration statistics in Canada from 2020 to 2024. (Source: Statistics Canada)
Figure 11 - Text version
The line chart shows electric vehicle registrations by sales across Canadian from Q1 2020 to Q1 2025:
- Canada (red line): Sales increase steadily from ~3% in Q1 2020 to ~18% in Q4 2024, then drop slightly to under 10% in Q1 2025.
- Quebec (green dashed line): Shows the fastest growth, from ~8% in Q1 2020 to nearly 40% in Q4 2024, then falls sharply to under 15% in Q1 2025.
- British Columbia and Territories (blue dotted line): Second highest growth, rising from ~9% in Q1 2020 to its maximum ~24% in Q3 2023, before dropping below 20% by Q1 2025.
- Other provinces (Nova Scotia, New Brunswick, Ontario, Manitoba, and Saskatchewan): Show modest growth since Q1 2020, remaining below ~10% throughout the period. Prince Edward Island is the only province exceeding 10% by Q1 2025.
The data above, sourced from Statistics Canada, shows quarterly new EV registrations by province.Footnote a EV sales in Canada have been led by strong showings from Quebec and British Columbia who have exceeded the national average consistently. The decline in registrations in 2025 are largely driven by Quebec pausing its EV purchase subsidies from February 1 – March 31, 2025.Reference [21] This decline saw EV sales decline from over 18% to just under 9% of sales nationally, and demonstrates that shifts away from internal combustion engine vehicles are still highly dependent upon customer incentives.
Based on available BEV and plug-in hybrid electric vehicle (PHEV) sales statistics, around 720,000 EVs were sold in Canada in the years 2020-2024.Reference [20] Assuming an average BEV battery pack size of 80 kWh (conservative estimate based on full capacity), and an average PHEV battery pack size of 20 kWh, the total battery demand owing to domestic passenger vehicle demand for these years is shown in Figure 12.
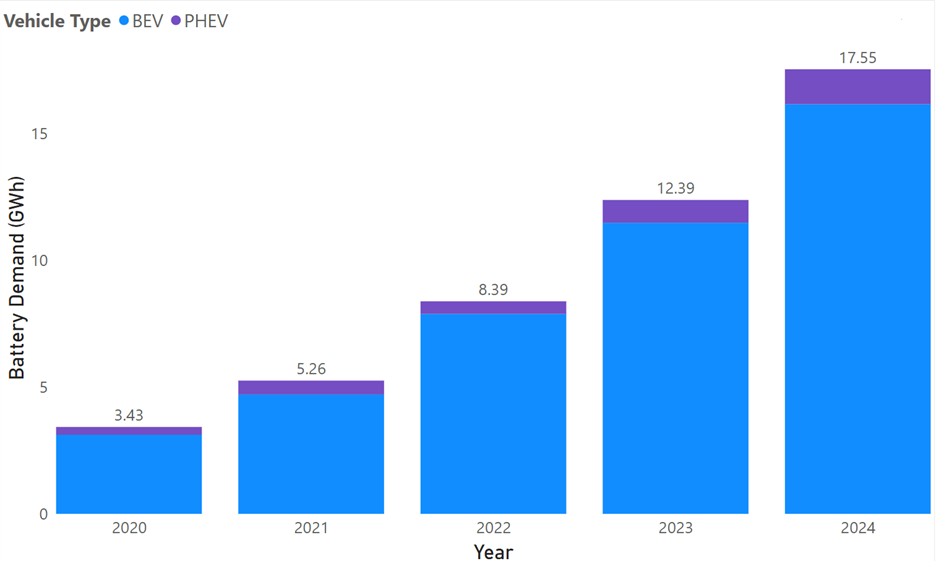
Figure 12: Annual Canadian battery demand for passenger battery electric and plug-in hybrid electric vehicles.
Figure 12 - Text version
The bar chart shows annual Canadian battery demand for passenger vehicles (GWh) from 2020 to 2024, split by vehicle type: BEV (blue) and PHEV (purple) segments. Demand from BEVs dominates over PHEVs.
- 2020: 3.43 GWh
- 2021: 5.26 GWh
- 2022: 8.39 GWh
- 2023: 12.39 GWh
- 2024: 17.55 GWh
These values resemble those projected under BloombergNEF’s EV outlook for the Net-Zero Scenario (Figure 13), with some margin of difference accounting for differences in assumptions in battery size.
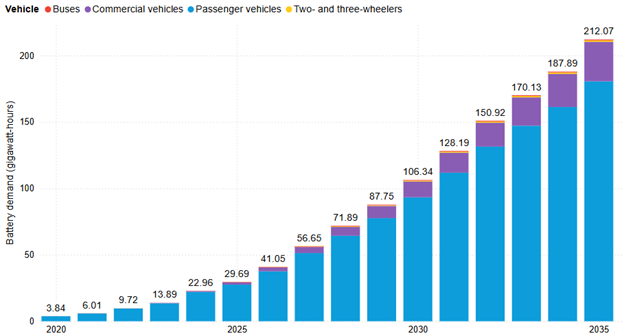
Figure 13: Annual Canadian battery demand in GWh for all vehicle types, assuming net-zero scenario by 2050. (Source: BloombergNEF)
Figure 13 - Text version
The bar chart shows Canadian battery demand by vehicle type under a net-zero scenario by 2050, with buses (red), commercial vehicles (purple), passenger vehicles (light blue), and two and three wheelers (yellow).
- 2020–2025: Battery demand rises from 3.84 GWh to 29.69 GWh, with passenger vehicles representing the greatest demand.
- 2025–2030: Battery demand grows to 106.34 GWh for all vehicle types. Passenger vehicles remain dominant (over 90 GWh), commercial vehicles reach ~10 GWh, while demand from other vehicle types remain low.
- By 2035: Battery demand reaches 212.07 GWh for all vehicle types, with passenger vehicles accounting for over 180 GWh, commercial vehicles ~30 GWh, and other vehicle types remaining minor contributors.
3.2. Electricity
Alongside its ZEV sale mandates, the Government of Canada has also set a target of achieving a net-zero electricity grid by 2035. While batteries are not a source of electricity generation, they are a directly enabling technology for non-emitting sources of electricity, projected at over 83 GW in 2035.Reference [16] To support this model, Energy Storage Canada, in their 2022 report titled Energy Storage: A Key Net Zero Pathway in Canada,Reference [22] outlined the need for 8-12 GW of energy storage capacity for the grid by 2035 and the Canadian Climate Institute, more ambitiously, laid out a target of 12 GW of energy storage capacity by 2030.Reference [23]
Figure 14 shows projected cumulative battery storage capacity in Canada up to 2035, which is not tied to any net-zero targets. Capacity additions are slated to increase significantly by the end of 2025, reaching approximately 4 GWh. This is primarily driven by energy shifting services such as energy arbitrage. By 2035, BloombergNEF projects a cumulative energy storage capacity of approximately 32.5 GWh. This corresponds to an annual capacity addition of approximately 3 GWh per year.
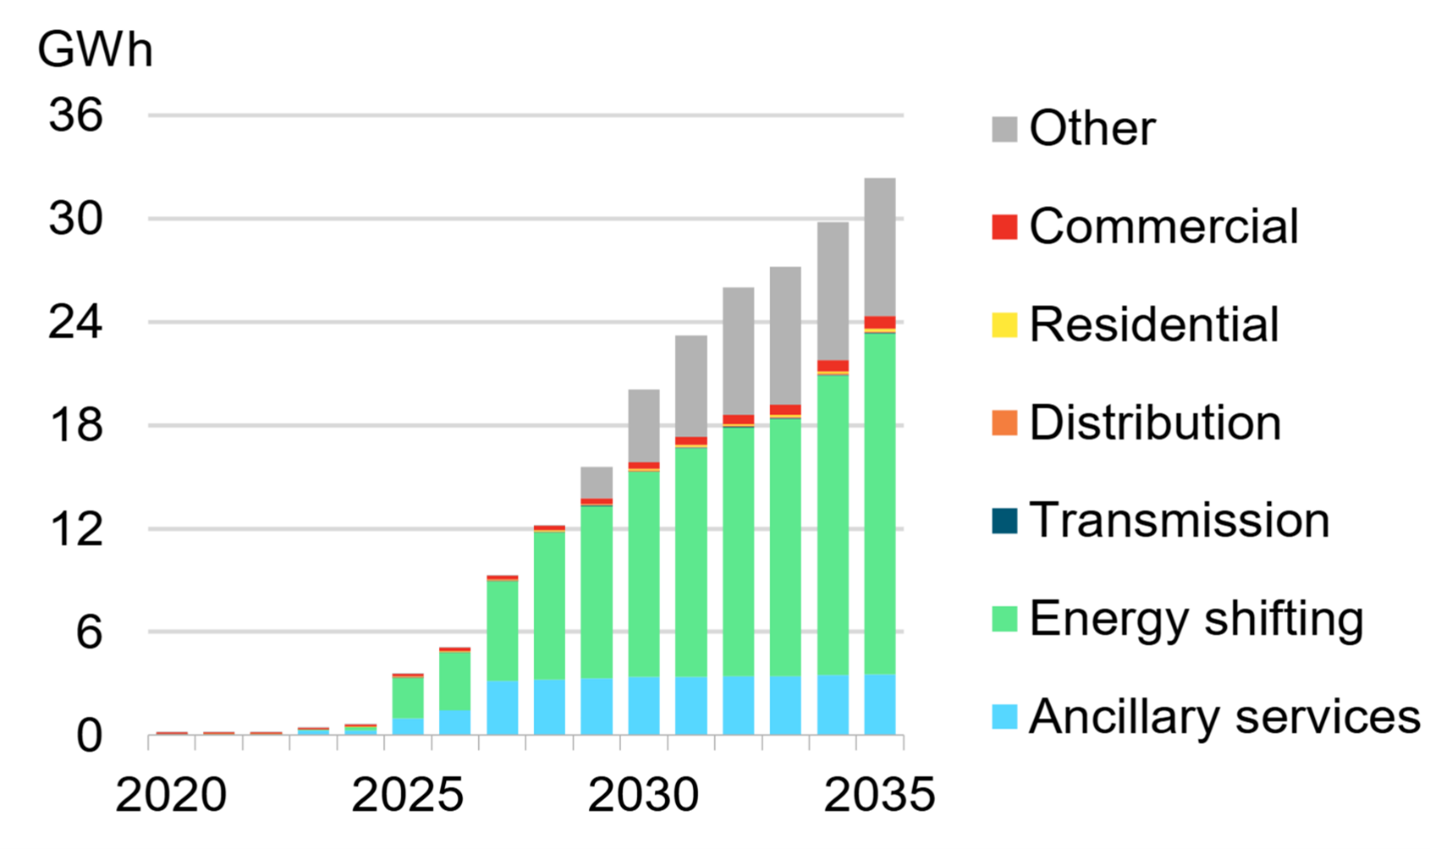
Figure 14: Projected cumulative stationary storage capacity in Canada assuming no major policy changes. (Source: BloombergNEF)
Figure 14 - Text version
The bar diagram presents cumulative battery energy storage capacity in Canada (2020–2035) under a scenario with no major policy changes, broken down by application: commercial (red), residential (yellow), distribution (orange), transmission (dark blue), energy shifting (green), ancillary services (light blue), and other (grey).
- 2020–2025: Storage capacity reaches ~4 GWh, with energy shifting and ancillary services leading adoption.
- 2025–2030: Storage capacity reaches ~20 GWh. Energy shifting and ancillary services are still leading adoption and account for 15 GWh, while other applications contribute ~5 GWh.
- By 2035: Storage capacity exceeds 32 GWh. Energy shifting reaches over 18 GWh, ancillary services remain at 3 GWh adopted by 2027. Other applications reach 10 GWh.
- Overall, commercial, residential, transmission, and distribution applications show relatively small adoption compared to other applications.
BloombergNEF predicts that in 2025, approximately 91% of the global stationary storage demand will be met by LFP-based lithium-ion batteries, while 6% is met by NMC-based lithium-ion chemistry. The role of NMC is expected to further decrease to negligible levels due to limitations in cost and lifetime while LFP maintains dominance with 81% of the total demand, and sodium-ion batteries are expected to grow to 10%.
3.3. Total Demand
In the last few years, new passenger vehicle sales in Canada have hovered around 1.8 million per year. Assuming an average battery size of 80 kWh per vehicle, Canada could require around 144 GWh of annual battery production in 2035 to meet its domestic needs, if 100% of vehicles were battery or hybrid EVs.
The International Energy Agency’s Global EV Outlook 2024 estimates a total annual demand of approximately 10.2 TWh of batteries for mobility and stationary storage applications in 2035 to be on track for net-zero by 2050.Reference [19] Of this, 6.9 TWh are set to be from passenger vehicles, 0.8 TWh from stationary storage, and another 2.5 TWh from other mobility applications including two/three-wheelers, busses, and trucks. To determine the expected demand from non-passenger EVs in Canada, a similar ratio of passenger to non-passenger vehicle battery demand is assumed to hold true for both global and Canadian demand, which yields an annual battery demand of approximately 52 GWh. Overall, this means Canada would require approximately 196 GWh of annual battery production in 2035 to meet the domestic demand for transportation-related applications.
Assuming the higher forecasted demand of 12 GW of energy storage by 2035 to be on track for net-zero, and assuming an average of 4 hours of storage for these deployments, 48 GWh of storage would be required. Based on current technology, assuming an average system lifetime of 10 years, then an annual battery production of 4.8 GWh per year would be needed to meet domestic demand while maintaining 12 GW of grid storage. In the current policy scenario, an annual production of 3 GWh of stationary storage batteries would be needed.
Combining this with the previous requirement of 196 GWh for total vehicle demand, Canada could require 200 GWh of annual battery production in 2035 to meet its domestic needs across these two segments.
4. Battery Technology Benchmarking and Targets
The SABI outlines five frameworks, two of which are used to define the most impactful performance metrics for batteries. Footnote b The Battery Performance Framework highlights five general performance metrics that describe the technical merit of any battery: energy density, power density, cost, safety, and lifetime. The Battery Sustainability Framework describes additional needs to meet the energy trilemma and sustainability goals.
From these, this report highlights the following six performance metrics as the most impactful for relativizing battery innovation and its potential for meeting the goals of the SABI.
- Energy density: The energy that can be stored in a cell (measured in watt-hours, Wh).
- Power density: The flow of energy that can be input or output during charging and discharging, respectively, normalized by mass (expressed in W/kg) or volume (expressed in W/L).
- Lifetime: The ability of a battery to charge of discharge for many cycles over a long period of time with limited degradation of performance.
- Safety: The requirements established to prevent harm or damage from battery malfunction during use, storage, handling, and disposal.
- Cost: The manufacturing cost of a battery typically expressed as $/kWh or $/kg.
- Sustainability: The waste byproducts of battery manufacturing, the most prominent being greenhouse gas emissions, expressed in kgCO2eq/kWh and water.
An expanded explanation of these metrics is included in Appendix B and can be used to better understand how each metric is derived. Other important metrics such as extreme temperature performance, charging speed, and range are primarily dependent on the metrics above and on the application utilizing the battery, so are not treated distinctly here. This report offers an intermediate understanding of these six performance metrics to better appreciate their impact on other market driven requirements.
The following sections present benchmarking data for leading technologies, for each performance metric, and provide targets for future performance. The battery technology benchmarking was conducted by aggregating state-of-the-art performance data of current battery technologies. This includes publicly available data on battery materials, cells, and systems of commercially available and deployed batteries, as well as information on next-generation battery technologies reported by industry and in peer-reviewed literature. Target battery requirements for different applications and from various battery technology roadmaps were collected and compared to provide context for the use-cases of different battery technologies and designs, and to set expectations for future state-of-the-art performance targets. For consistency, the benchmarks are offered at the cell level, as battery performance is largely driven from design and optimizations at the cell level and offers most opportunity for innovation.
Publicly accessible performance data of commercially available battery cells for multiple chemistries, capacities, form factors, and applications are aggregated to provide a benchmark of modern battery capabilities.Reference [24] These reference cells and their applications are shown in Table 1. The technology in commercially available cells tested today likely originates from RD&D activities conducted in years prior; the data presented in this section reflects the state-of-the-art in battery technology from approximately the early to late 2010s.
| Cell Manufacturer | Product Name | Target Applications |
|---|---|---|
| A123 Systems | 26700 NCA GL | motorsports, Formula 1Reference [25] |
| BYD | Blade C102F | electric vehiclesReference [26] (2022 long-range BYD Dolphin) |
| BYD | C45F-302Ah | electric power systems, solar energy storage systems, electric vehicles, electric motorcycles, e-bikes, micro-mobility applicationsReference [27] |
| CATL | Tesla Model 3 | electric vehiclesReference [24] (2023 Tesla Model 3) |
| Farasis | P79B3 | electric vehiclesReference [28] |
| HiNa Battery | NACR26700 MP3.0 (A) | e-bikes, portable and residential energy storage systemsReference [29] |
| LG Energy Solution | INR21700-M58T | consumer electronics, e-scooters, e-bikes, power toolsReference [30] |
| LG Chem | E66A | electric vehiclesReference [31] (Audi e-tron GT quattro, 2019 Porsche Taycan) |
| LG Chem | E61V | electric vehiclesReference [24] (2019 Audi e-tron) |
| Molicel | INR21700-P45B | electric vehicles, electric vertical take-off and landing aircrafts (eVTOL), micro-mobility, home appliances and other applicationsReference [32] |
| Panasonic | Tesla Model Y 21700 | electric vehiclesReference [24] (2020 Tesla Model Y) |
| Primearth EV Energy | Hybrid Toyota Camry | hybrid electric vehicleReference [24],Reference [33] (2019 Hybrid Toyota Camry) |
| Samsung | CS1200R | electric vehiclesReference [20] (2019 BMWi3) |
| Samsung | BMW 530e | plug-in hybrid electric vehiclesReference [20] (2019 BMW 530e) |
| Tesla | Tesla Model Y 4680 | electric vehiclesReference [34] (2022 Tesla Model Y) |
While it may not be possible to independently maximize each battery performance metric, it is only necessary to ensure that the battery performance envelope exceeds its application requirements. Therefore, the benchmarks and targets presented below are offered to decision-makers to understand the relative value of innovation ventures, although trade-offs are inherent to purpose-driven design and proper discretion should be used when selecting performance targets. See Appendix B for more discussion on trade-offs and composite metrics.
4.1. Cell Energy Density
Cell energy density benchmarks of commercially available cells from Table 1 are presented here along three views.
- Volumetric and gravimetric energy densities by cell format (Figure 15)
- Volumetric and gravimetric energy densities by cell chemistry (Figure 16)
- Gravimetric energy densities and capacity by cell format (Figure 17)
Targets for energy density are selected on the basis of cell performance and affordability.
2035 Performance Target: High performance is generally achieved through use of NMC cathodes, and innovations on the anode are expected to push energy densities further. Figure 15 and Figure 16 show a 2035 gravimetric energy density target of 500 Wh/kg and a volumetric energy density target of 1150 Wh/L.
Affordability Target: Affordable batteries must balance low cell manufacturing costs and energy densities suited to their end application. However, high performance cells may require more expensive cell manufacturing techniques and input materials to achieve their high performance. LFP is a likely candidate for meeting both affordability and acceptable performance, with a 2035 gravimetric energy density target of 270 Wh/kg and a volumetric energy density target of 550 Wh/L.
Na-Ion Target: Finally, this section would not be complete without acknowledging the potential of sodium-ion batteries as a competitive alternative to lithium-ion batteries for stationary and low-range mobility storage applications. For this battery type, a long-term target is outlined in Figure 32 for a gravimetric energy density of 220 Wh/kg and a volumetric energy density of 500 Wh/L.
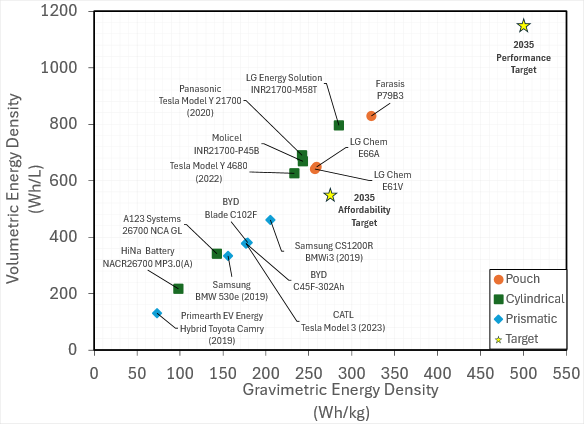
Figure 15: Volumetric (measured in Wh/L) and gravimetric (measured in Wh/kg) energy densities for selected commercially available cells labeled by cell format (pouch, cylindrical, or prismatic). Energy densities are measured by discharging from 100% SOC at C/10 rate at 25°C until reaching the lower voltage limit (either 2V or 2.5V).Reference [24]
Figure 15 - Text version
The scatter plot compares gravimetric and volumetric energy densities for three commercially available cell formats — pouch, cylindrical, and prismatic —as well as two 2035 targets:
- Pouch cells (orange circles): Gravimetric energy density of ~250 to ~325 Wh/kg and volumetric energy density of ~620 to ~810 Wh/L.
- Cylindrical cells (green squares): Gravimetric energy density of ~100 to ~275 Wh/kg and volumetric energy density of ~200 to ~800 Wh/L.
- Prismatic cells (light blue diamonds): Gravimetric energy density of ~75 to ~200 Wh/kg and volumetric energy density of ~100 to ~450 Wh/L.
- 2035 targets (yellow stars):
- Affordability Target: 270 Wh/kg gravimetric and 550 Wh/L volumetric.
- Performance Target: 500 Wh/kg gravimetric and 1150 Wh/L volumetric.
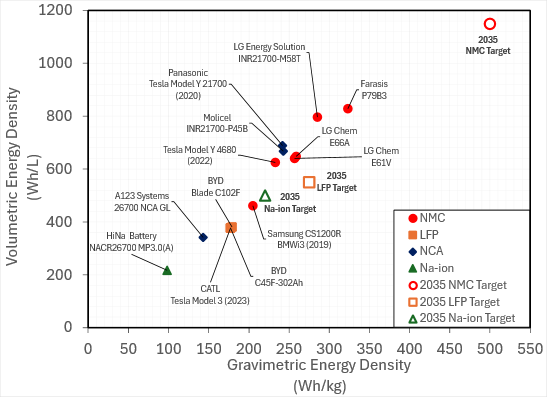
Figure 16: Volumetric (measured in Wh/L) and gravimetric (measured in Wh/kg) energy densities for selected commercially available cells labeled by cell chemistry (NMC, LFP, NCA, Na-ion). Energy densities are measured by discharging from 100% SOC at C/10 rate at 25°C until reaching the lower voltage limit (either 2V or 2.5V).Reference [24]
Figure 16 - Text version
The scatter plot compares gravimetric and volumetric energy densities across four commercially available cell chemistries, with marker shapes identifying each chemistry: NMC (circles), LFP (squares), NCA (diamonds), and sodium-ion (triangles).
- NMC (red circles): Current gravimetric energy densities range from ~200 to ~325 Wh/kg, with volumetric energy densities from ~450 to ~850 Wh/L. A 2035 target (open red circle) indicates 500 Wh/kg and 1150 Wh/L.
- LFP (orange squares): Current gravimetric energy density of ~175 Wh/kg and volumetric energy density ~350 Wh/L. The 2035 target (open orange square) indicates 270 Wh/kg and 550 Wh/L.
- NCA (blue diamonds): Current gravimetric energy densities range from ~150 to ~240 Wh/kg and volumetric energy densities from ~350 to ~700 Wh/L.
- Na-ion (green triangles): Current gravimetric energy density of ~100 Wh/kg and volumetric energy density ~200 Wh/L. A 2035 target (open green triangle) indicates ~225 Wh/kg and ~300 Wh/L.
- Values toward the upper right corner represent higher energy density. Among the chemistries shown, NMC achieve the highest gravimetric and volumetric energy densities.
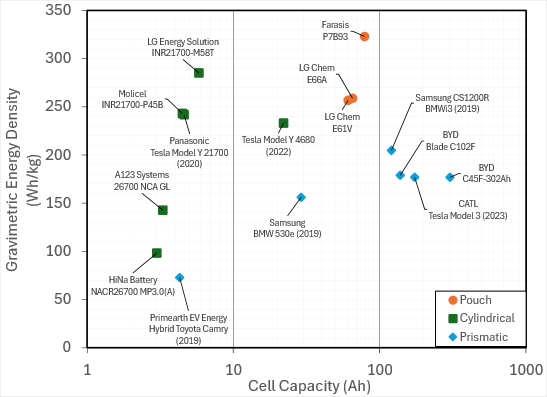
Figure 17: Gravimetric energy densities (measured in Wh/kg) and nominal cell capacities (measured in Ah) for selected commercially available cells labeled by cell format (pouch, cylindrical, or prismatic). Energy densities are measured by discharging from 100% SOC at C/10 rate at 25°C until reaching the lower voltage limit (either 2V or 2.5V).Reference [24]
Figure 17 - Text version
The scatter plot compares cell capacity in logarithmic scale against linear gravimetric energy density for commercially available pouch, cylindrical, and prismatic cell formats:
- Pouch cells (orange circles): Capacities between 60-80 Ah and gravimetric energy density between 250 and 330 Wh/kg.
- Cylindrical cells (green squares): Capacities between 3-20 Ah and gravimetric energy density between 100 and 290 Wh/kg.
- Prismatic cells (light blue diamonds): Capacities between 4-300 Ah and gravimetric energy density between 70 and 210 Wh/kg.
Takeaways
- As seen in Figure 15, the volumetric and gravimetric energy densities of commercial battery cells are highly correlated.Footnote c
- The anode and cathode chemistry play a significant role in determining the cell energy density (see Appendix C for supporting calculations). For instance, the prismatic BYD and CATL cells with LFP and graphite chemistry in Figure 15 and Figure 16 have nearly identical energy densities (177-179 Wh/kg and 377-381 Wh/L). However, NMC and nickel, cobalt, aluminum oxide (NCA) chemistries mostly have higher energy densities with more variation compared to LFP. The variation in NMC cells’ energy density is in part due to the variation in cathode and anode composition: NMC cathode compositions with higher nickel content and graphite anode compositions with silicon incorporation typically have higher energy densities. Other commercial pairings are outlined below.
The Farasis P79B3 NMC pouch cell is comprised of an NMC cathode with greater than 90% Ni composition and a graphite anode with some silicon incorporation, and it has the highest energy density of the selected cells (323 Wh/kg and 829 Wh/L).Reference [28],Reference [35]
The LG Chem E66A NMC pouch cell is comprised of an NMC cathode with 70% Ni composition (LiNi0.7Mn0.2Co0.1O2) and a graphite anode, and it has an intermediate energy density (259 Wh/kg and 648 Wh/L).Reference [31],Footnote [36]
The Samsung CS1200R NMC prismatic cell is comprised of an NMC cathode with 60% Ni composition (LiNi0.6Mn0.2Co0.2O2) and a graphite anode, and it has a lower energy density (205 Wh/kg and 461 Wh/L).Reference [37],Reference [38]
- As shown in Figure 16 sodium-ion batteries such as the HiNa Battery NACR26700 MP3.0(A) have lower energy density compared to conventional lithium-ion chemistry. This 3Ah cylindrical cell is comprised of a sodium, copper, manganese, and iron oxide cathode paired with an anthracite-derived soft carbon anode with energy densities of 98 Wh/kg and 217 Wh/L.Reference [39]
- The energy density of battery cells can span a wide range, as shown in Figure 15 and are optimized for the target application’s requirements, as shown in Figure 17. However, cell capacity alone is insufficient to determine a battery’s application, as both small and large capacity cells may be used for the same application. For example, one of the 2020 versions of the Tesla Model Y uses 4.6 Ah cylindrical cells from Panasonic with NCA cathode and graphite anode, and one of the 2022 versions of the same vehicle uses 22 Ah cylindrical cells with NMC811 (LiNi0.8Mn0.1Co0.1O2) cathode chemistry and graphite anode.Reference [40],Reference [41]
- Figure 17 shows how there is a growing trend toward increasing cell capacity and a shifting preference for large-format cells (especially prismatic cells) in mobility and stationary storage applications. This is because they can increase the cell volumetric energy density due to improved volume efficiency of the active material share and lower the cost due to reduction of manufacturing steps that scale with number of cells.Reference [27],Reference [42], Reference [43],Reference [44]
4.2. Cell Power Density
The continuous discharging power capability of the cells in Table 1, are presented in Figure 18. The peak power capability, or the maximum power that can be supplied for 5 minutes starting from 100% SOC is included for reference in Figure 19.
Importantly, battery cells used in hybrid electric vehicles (HEVs), PHEVs, and BEVs exhibit variation in power capability, as shown in Table 2. This table highlights how three prismatic cells from Primearth EV Energy and Samsung shown in Figure 15, Figure 17, and Figure 18 serve vehicles of similar size but with different levels of electrification, namely the 2019 Toyota Camry HEV, the 2019 BMW 530e PHEV, and the 2019 BMWi3 BEV.
Targets for continuous discharge power density are shown in Figure 18 for BEVs and PHEVs.
BEV Target: BEVs require less power density, balancing instead high power and energy densities to achieve the desired range. The longer-term target for BEV batteries is 1000 W/kg.
PHEV Target: PHEVs require higher power density compared to BEVs, utilizing smaller cells. The longer-term target for PHEV batteries is 1750 W/kg.
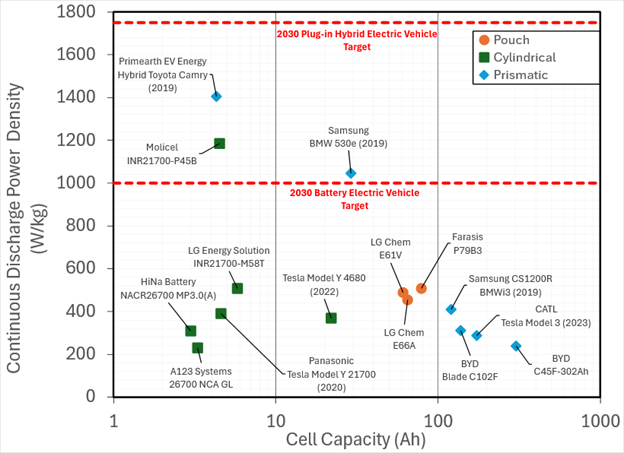
Figure 18: Continuous discharge power densities (measured in W/kg) and nominal cell capacities (measured in Ah) for selected commercially available cells labelled by cell format (pouch, cylindrical, or prismatic). Continuous discharge power densities are determined from discharging the cell from 100% SOC at 25°C until reaching 10% SOC and either reaching the lower voltage limit (either 2 or 2.5V) or reaching a maximum surface temperature of 68°C.Reference [24]
Figure 18 - Text version
The scatter plot compares cell capacity in logarithmic scale with linear power density under continuous discharge for commercially available pouch, cylindrical, and prismatic cell formats:
- Pouch cells (orange circles): Capacities between 60-80 Ah and continuous discharge power densities between 450-500 W/kg.
- Cylindrical cells (green squares): Capacities between 3-20 Ah and continuous discharge power densities between 200-1200 W/kg.
- Prismatic cells (light blue diamonds): Capacities between 4-300 Ah and continuous discharge power densities between 200-1050 W/kg.
Overall, smaller-capacity cells demonstrate higher continuous discharge power densities.
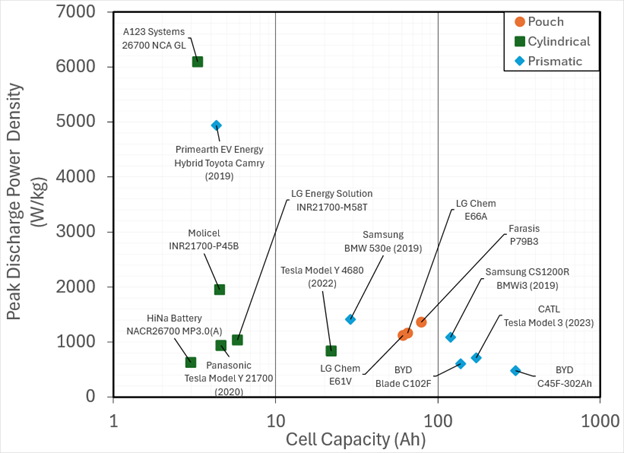
Figure 19: Peak discharge power densities (measured in W/kg) and nominal cell capacities (measured in Ah) for selected commercially available cells labelled by cell format (pouch, cylindrical, or prismatic). Peak discharge power densities are determined by discharging the cell from 100% SOC at 25°C for 5 minutes.
Figure 19 - Text version
The scatter plot compares cell capacity in logarithmic scale with peak discharge power density for commercially available pouch, cylindrical, and prismatic cell formats:
- Pouch cells (orange circles): Capacities between 60-80 Ah and peak discharge power densities between 1000-1400 W/kg.
- Cylindrical cells (green squares): Capacities between 3-20 Ah and peak discharge power densities between 600-6000 W/kg.
- Prismatic cells (light blue diamonds): Capacities between 4-300 Ah and peak discharge power densities between 400-5000 W/kg.
Overall, the trend shows that the smaller the cell capacity, the greater the peak discharge.
| Cell Manufacturer | Model | Electric Range (km)Reference [44],Reference [45],Reference [39] | Vehicle Weight (lbs)Reference [37],Reference [38],Reference [39] | Pack Size |
Continuous Discharge Power Density (W/kg) |
|---|---|---|---|---|---|
| Primearth EV Energy | 2019 Hybrid Toyota Camry | 0 | 3472 | 1 | 1406 |
| Samsung | 2019 BMW 530E | 26 | 4297 | 9.2 | 1046 |
| Samsung | 2019 BMWi3 | 203 | 3276 | 42.2 | 410 |
Takeaways
- The power density of a cell can range widely depending on the intended application. Smaller cells are most likely to find use in high-power applications, consumer electronics, and more niche implementations of batteries. Larger cells generally do not reach the power densities of their smaller counterparts.
- The power capability of battery cells can also vary across a wide range of applications, tailored to the duty cycle and power requirements.
- Lower power capability example: The 302 Ah BYD C45F-302Ah prismatic LFP cell can be used in stationary storage applications, which may follow a diurnal charging and discharging schedule (i.e. a charge and discharge over several hours once a day).
- Higher power capability example: The 3.3 Ah A123 Systems 26700 NCA GL cylindrical cell which is used in motor sports applications such as the energy recovery system in Formula 1 vehicles, where battery cells are used to recover energy from braking to provide rapid bursts of energy that add additional horsepower in the smallest possible package.Reference [25],Reference [49]
- HEV, PHEV and BEV of similar weight vary in range, which is directly related to pack size, but their battery packs accept comparable power inputs, typically during regenerative breaking, leading to variation in their power density requirements.
4.3. Cell Lifetime
While energy and power density can be assessed directly after a cell is manufactured, cell lifetime requires repeated measurements over a period of months to several years. Comprehensive and publicly available cell lifetime data for specific commercial cells such as those in Table 1 is therefore sparse. Available lifetime data is presented here for three important measures: calendar lifetime, cycle lifetime, and lifetime vehicle duty cycling. (Note that each are dependent on numerous factors that affect the cell degradation rate including temperature, DOD, and C-rate, which are contextualized below.)
Calendar lifetime or calendar aging is shown in Figure 20 and summarized in Table 3 for cylindrical, pouch, and prismatic formats and LFP, NCA, NMC, and LCO (lithium cobalt oxide) cathode chemistries paired with graphite anodes.Reference [50]
Cycle lifetime is shown as Equivalent Full Cycles (EFC) in Figure 21, which is sourced from a cycling study of cylindrical 18650 type cells, manufactured by A123 Systems, Panasonic, and LG Chem, and with LFP, NCA, and NCA cathode chemistries.
Application-specific cycling data is the most relevant benchmark for evaluating cell lifetime. Lifetime vehicle duty cycling for the 2020 Volkswagen ID.3 Pro Performance vehicle is shown in Figure 22. This vehicle utilizes a mid-size battery pack (58 kWh), which is comprised of 9 battery modules, each containing 24 pouch cells from LG Chem with 78 Ah capacity (the LG Chem E78 cellFootnote d).Reference [36]
Benchmarking this data, LFP shows a significant advantage over the cycling lifetime of both NMC and NCA. Given the dependence of cycle life on several conditions, including temperature and DOD, the benchmark for cycle life for LFP is offered as 6000-8000 cyclesFootnote e. For NMC and NCA, where the capacity fades faster given the same cycling conditions, the cycle life can be taken as 500-1000 cycles.
Target cycle life in the long term for LFP cathode chemistry could reach 10,000 cycles and make it more competitive for stationary storage purposes. For NMC and NCA chemistries, which will remain a good choice for high-end mobility applications due to their higher input material cost, a target cycle life of 2000 cycles is achievable.
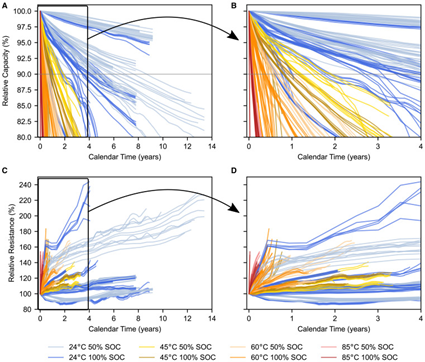
Figure 20: Calendar aging dataset showing relative capacity decline and resistance growth of 232 commercial lithium-ion cells stored at four temperatures (24°C, 45°C, 60°C, and 85°C) and two SOC values (50% and 100%).Reference [50]
Figure 20 - Text version
The figure illustrates the decline of cell capacity (shown in quadrants A and B), and resistance growth as a measure of cell degradation (shown in quadrants C and D) in cells stored up to 14 calendar years at different temperature. Subdued colours represent cell stored at 50% State of Charge (SOC), and bright colours represent storage at 100% SOC. Quadrants A and C display 14 calendar years of data, while quadrants B and D zoom in on the first four years.
- Cells stored at 24°C (blue): Most of the relative capacities reach under 80% after four years of storage, without a defined path of resistance growth
- Cells stored at 45°C (brown): Relative capacity reaches under 80%, and resistance growth exceeds 130% before four years.
- Cells stored at 60°C (orange): Relative capacity reaches under 80% and resistance growth surpasses 170% before two years.
- Cells stored at 85°C (red): Relative capacity reaches under 80% and resistance growth exceeds 150% before one year.
| Storage condition | Cell performance | Capacity retained | Resistance growth* |
|---|---|---|---|
| 24°C at 50% SOC (mildest condition) |
Lowest performance | 80% after 8 years | 70% after 4 years |
| 24°C at 50% SOC (mildest condition) |
Highest performance | 97.5% after 8 years | None |
| 45°C at 100% SOC (aggressive condition) |
All | 80% after 2-3 years | 10-20% after 2 years |
| 85°C at 100% SOC (extreme condition) |
All | 80% after < 1 year | 40% after < 1 year |
*Indicator of declining power capacity
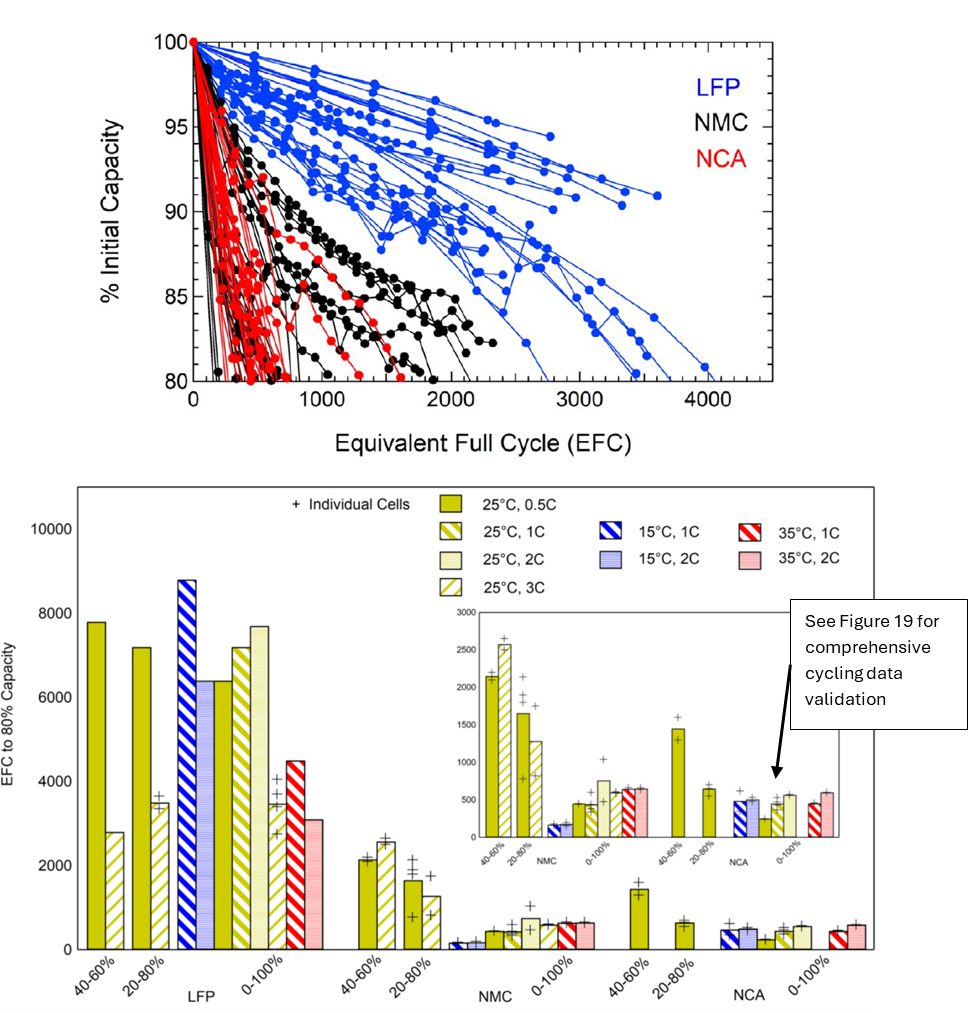
Figure 21: Discharge capacity retention and equivalent full cycle capacity for commercially available cylindrical cells with 18650 form factor and LFP, NMC, and NCA cathode chemistry, charged at a rate of 0.5C and discharged at variable rates and SOCs. Extrapolated Equivalent Full Cycle (EFC) of LFP, NMC and NCA are shown in top graph.Reference [52]
Figure 21 - Text version
The top figure compares the decline of cell capacity of different chemistries after thousands of charge-discharge cycles.
- Blue lines: LFP, black: NMC, red: NCA.
- LFP shows the highest retention of cell capacity for most of the datasets reaching over 3000 cycles before degradation reaches 80%.
- NCA shows the fastest degradation of cell capacity as none of the datasets surpasses 2000 cycles.
- Most of NMC datasets reach degradations under 80% between 1000 and 2500 cycles.
The bottom figure shows the Equivalent Full Cycles (EFC) needed to reach 80% capacity for LFP (left), NMC (center), and NCA (right):
- EFC is calculated considering the change in the State of Charge (SOC) of a cell during a charge and discharge cycle. An EFC calculated for a 40-60% cycle implies a charging cycle starting at 40% SOC and ending at 60%.
- Other cycles included in this figure are 20-80% and 0-100%.
- Blue bars represent charge-discharge cycles at 15 C, yellow-green bars at 25 C, and red bars at 35 C.
- The different patterns denote the different C rates for the charge-discharge cycle.
- The embedded figure repeats the same EFC information of the bottom figure with a readjusted Y axis.
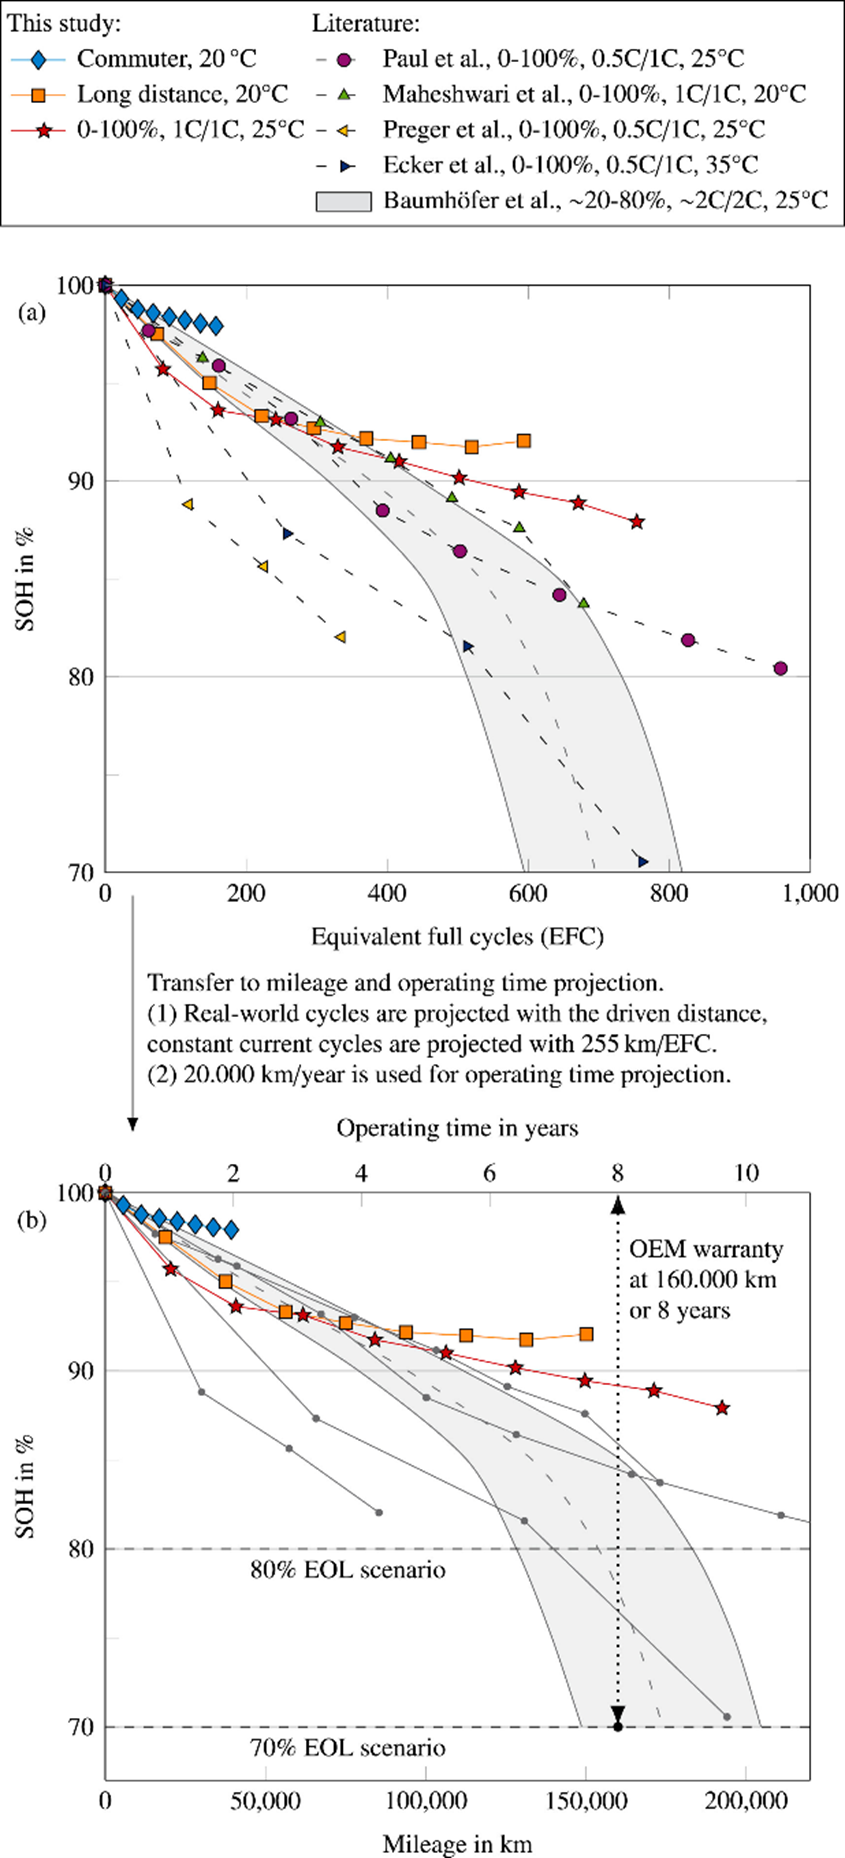
Figure 22: Capacity retention of a Volkswagen ID.3 battery cell for different duty cycles in terms of (a) equivalent full cycles and (b) conversion to mileage and operating time.Reference [51]
Figure 22 - Text version
The two plots show battery State of Health (SOH %) degradation versus cycle.
Top plot – SOH vs. Equivalent Full Cycles (EFC) from 0 to 1,000 cycles:
Multiple datasets compare real-world and literature results under different conditions.
- Commuter (20°C, blue diamonds): Gradual decline from 100% to ~97% at 200 cycles.
- Long distance (20°C, orange squares): Similar decline trend, reaching ~92% at 700 cycles.
- 0–100%, 1C/1C, (25°C, red stars): Steeper decline reaching under 90% at 500 cycles.
- Literature data: Various markers show faster degradation regardless of temperatures at charging rates.
Bottom plot – SOH vs. Mileage (0–200,000 km), with a driving rate of 255 km per EFC, and operating time (0–10 years):
The same datasets are projected to mileage.
- Commuter cycles maintain >97% SOH up to ~50,000 km; long-distance and 0–100% cycles drop to 92% near 100,000 km. By 150,000 km long-distance remain about 90% and 0–100% cycles drop below 90%.
- Most of the conditions tested maintain an SOH above the 80% by the End of Life of 160,000 km or 8 years.
Takeaways
- The study results shown in Figure 21, where cells were tested across a variety of cycling rates, temperatures, and SOC rangesReference [52], demonstrate that there is a consistent trend of improved cycling durability for LFP, followed by NMC and then NCA.
- Figure 21 also shows the extrapolated Equivalent Full Cycle (EFC) of different cathode chemistries across the same variety of cycling conditions and shows that LFP has a significant advantage over NMC and NCA cathode chemistries.
- Since comprehensive cycling data is only available for a few of the cells in Table 1, studies like the one shown in Figure 21 can be used as a proxy to benchmark commercial cell lifetime. To validate this, Figure 23 shows cycling data under multiple conditions for one of the cells from Table 1, namely the 4.5 Ah cylindrical INR21700-P45B cell from Molicel, which is a NCA chemistry cell. Reference [32],Reference [53] This figure shows that over 80% of the original capacity is retained after 500 constant current cycles at multiple charge and discharge conditions at room temperature: 1C charging and discharging (4.5A), 1C charging and 2.2C (10A) discharging, and 3C (13.5A) charging and 1C discharging. In Figure 21, the inset graph shows that NCA cells with a starting SOC of 100%, cycled at room temperature at 1C tend to retain 80% capacity after 500 equivalent full cycles. In the absence of comprehensive cycling data, trend studies can be used to benchmark cell lifetime.
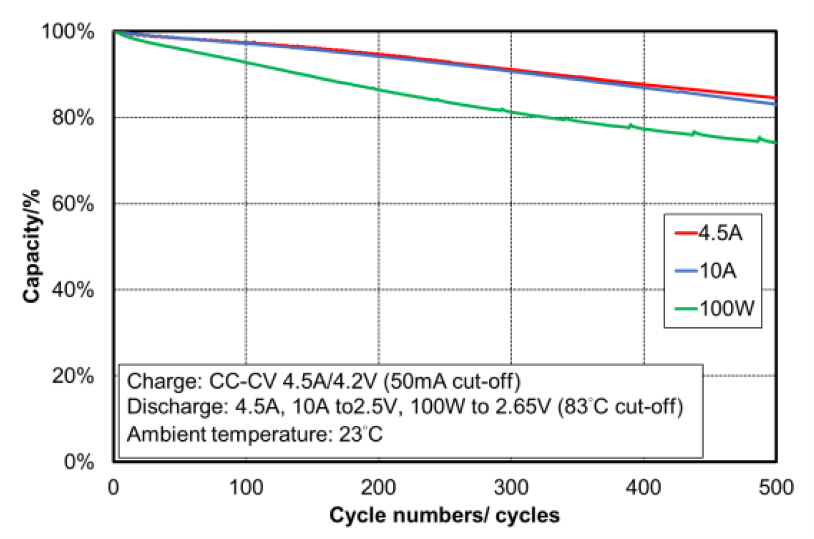
Figure 23: Capacity retention data for the 4.5 Ah cylindrical INR21700-P45B cell from Molicel.Reference 32,Reference [53]
Figure 23 - Text version
The line chart shows battery capacity retention (%) versus cycle number (0–500 cycles) under three discharge conditions:
- 4.5A (red line): Capacity decreases gradually from 100% to about 85% after 500 cycles.
- 10A (blue line): Follows a similar trend to 4.5A but ends a few percentage points lower after 500 cycles.
- 100W (green line): Shows a faster decline in cell capacity, reaching about 70% after 500 cycles.
- Tests conditions:
- Charge protocol: CC-CV 4.5A/4.2V (50mA cut-off)
- Discharge: 4.5A, 10A to 2.5V, 100W to 2.65V (83°C cut-off)
- Ambient temperature: 23°C
- Vehicle duty cycling, such as the European “commuter” and “long distance” trips shown in Figure 22 are typically less severe than constant current cycling.
- European urban and interurban driving, represented by the “commuter trip” cycling, retains a SOC between 70% and 80% after an hour or two of discharge. This corresponds to 28km trips recharged over approximately 30-minutes in between trips. (The mean C-rate is 0.2C for both charge and discharge, and maximum discharge and charge C-rates are 1.7C and 0.2C, respectively.) After 50,000 km of driving over 2 years (or just under 200 equivalent full cycles), over 97.5% of the original capacity is retained.
- European highway driving, represented by the “long distance” cycling, retains a SOC between 100% and 20% after two or three hours of discharge. This corresponds to 375 km trips recharged by fast (approximately 30 min) charges and slower charges (approximately 4 hours). (The mean discharge and charge C-rates are 0.5C and 0.3C, respectively, and the maximum discharge and charge C-rates are 2.4C and 1.7C, respectively.) After 150,000 km of driving over just under 8 years, (or approximately 600 equivalent full cycles), over 90% of the original capacity is retained.
- Both duty cycle examples for commuting and long distance retain a higher capacity compared to the constant current cycling between 0% and 100% SOC at 1C charge and discharge rates. This cycling retains just under 90% capacity after 600 full equivalent cycles.
- Vehicle OEM warranties, such as the one shown in Figure 22 and expressed as 160,000 km and 8 years of driving, are typically based on 80% capacity retention for vehicle duty cycling. This is reinforced by the fact that data sets shown in Figure 21, transposed to Figure 22 would not demonstrate sufficient capacity. On the other hand, cycling data for lab-scale cells such as those shown in Figure 24 below shows capacity retention over 96% after 3000 cycles and over 2.3 years (at 20°C temperature, 3.0 to 4.2 V range, at both C/3 and 1C charging and discharging rates). Extrapolating this data for an idealized battery with no losses, such a cell could power a BEV for over one million miles and at least two decades in grid energy storage!Reference [54] While lab testing can simulate duty cycles, it is primarily used to demonstrate durability for regulatory purposes, and is not typically used to determine end of life.
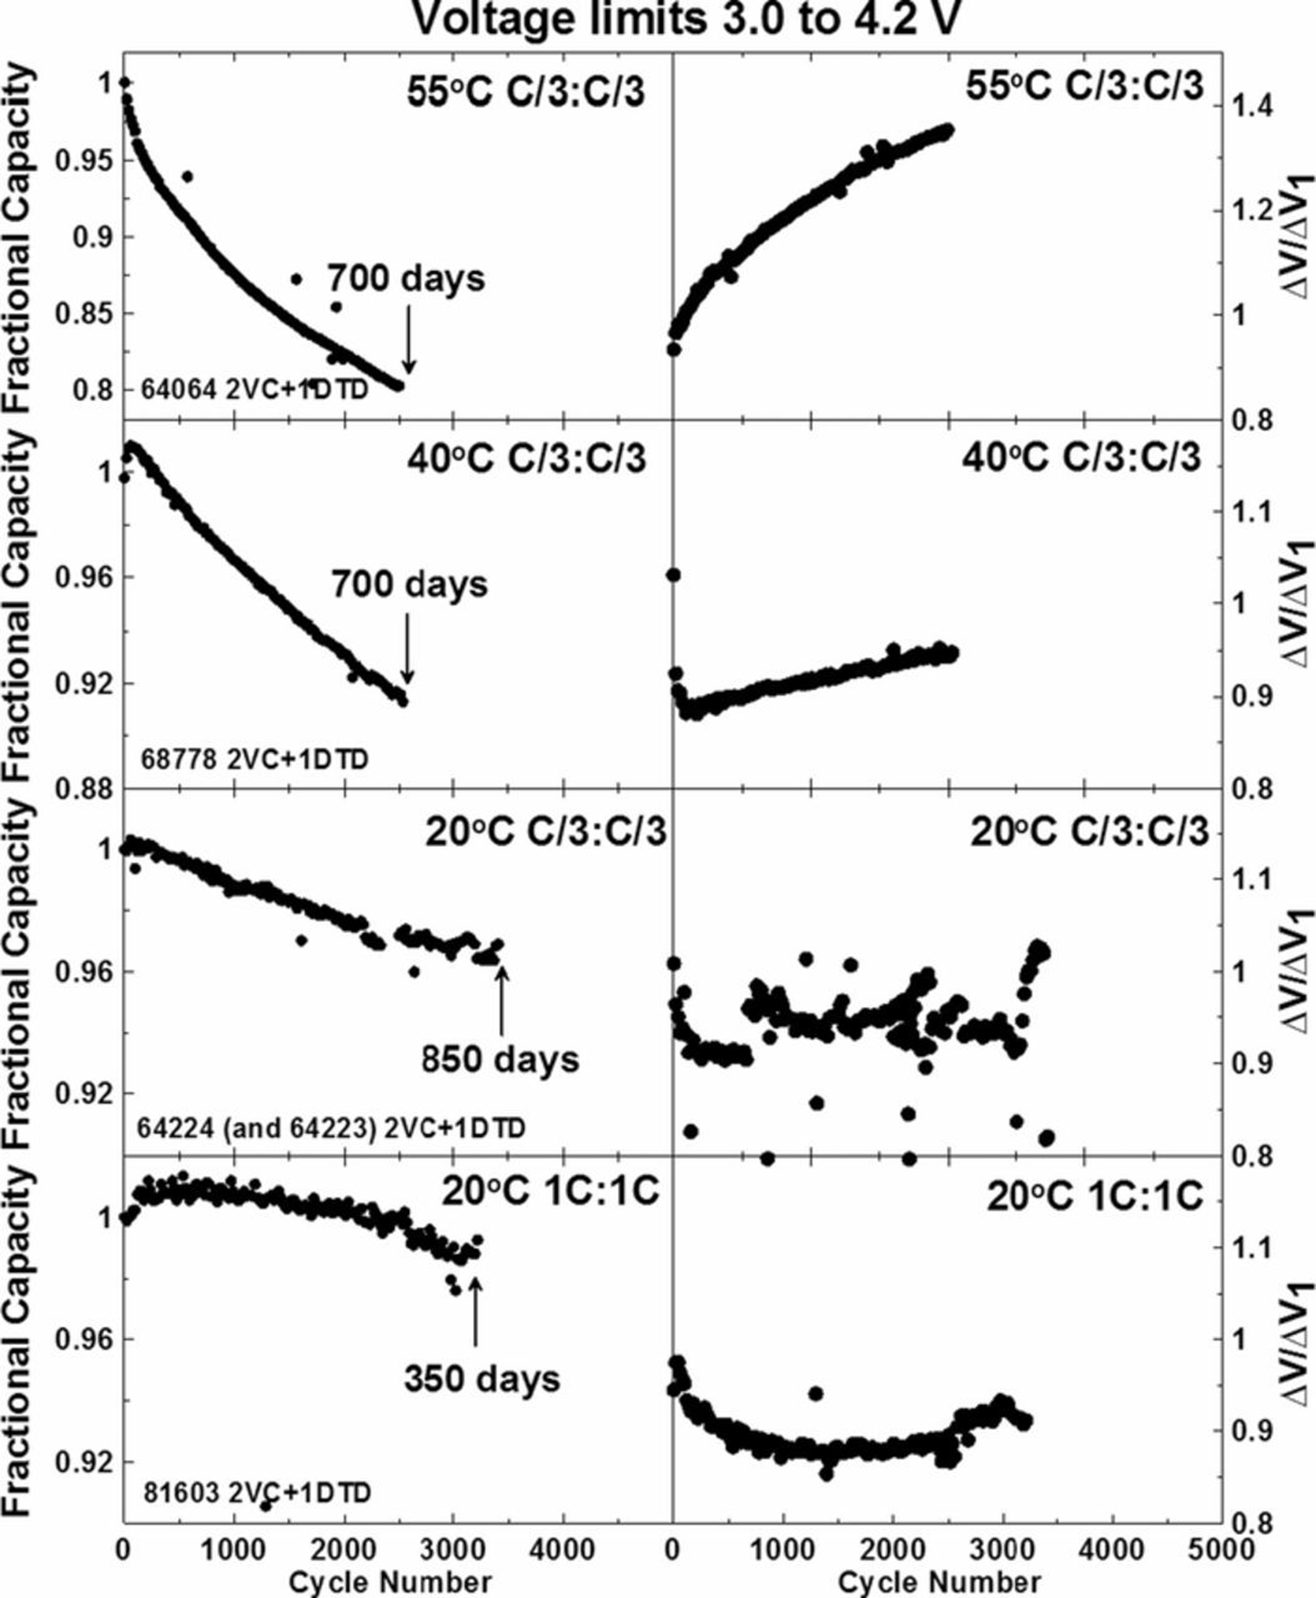
Figure 24: Fractional capacity and normalized voltage overpotential ∆V (indicative of resistance growth and power fade) of 240 mAh lithium-ion pouch cells constructed with single-crystal nickel manganese cobalt (NMC532) cathode material, artificial graphite, and common electrolytes, cycled from 3.0 to 4.2V at specified C-rates and temperatures.Reference [55]
Figure 24 - Text version
The compilation of figures presents four sets of lithium-ion cell performance plots (voltage limits of 3.0 to 4.2 V) under different conditions, with each row corresponding to a different temperature or cycling rate: 55°C C/3:C/3, 40°C C/3:C/3, 20°C C/3:C/3, and 20°C 1C:1C.
- Left column: Fractional capacity vs. cycle number
These plots show how capacity decreases under each condition.
- 55°C (C/3:C/3): Capacity fades from 1.0 to 0.8 over 700 days.
- 40°C (C/3:C/3): Capacity fades from 1.00 to 0.91 over 700 days.
- 20°C (C/3:C/3): Capacity fades from 1.00 to 0.96 over 850 days.
- 20°C (1C:1C): Capacity fades from 1.00 to 0.98 over 350 days.
- Right column: Normalized voltage overpotential vs. cycle number
These plots track changes in voltage behavior during cycling:
- 55°C (C/3:C/3): from 0.95 to 1.30 after 2500 cycles.
- 40°C (C/3:C/3): from 0.87 to 0.95 after 2500 cycles.
- 20°C (C/3:C/3): Scattered data points between 0.90-1.00.
- 20°C (1C:1C): Shifts from 1.00 to 0.95 after ~ 3500 cycles.
4.4. Cell Safety
Several safety standards organizations have developed international safety standards for rechargeable lithium-ion batteries. Safety standards act as benchmarks since batteries must meet the safety requirements therein to be deployed. For instance, the Molicel INR-21700-P45B cell benchmarked in previous sections meets the IEC 62133 and UL 1642 standards. The various leading safety standards are summarized below.
IEC 62133: This standard, set by the International Electrotechnical Commission, is generally used for lithium-ion batteries for consumer electronics, but also increasingly for cells destined for EV. The standard ensures proper chemical, mechanical, and thermal safety in a cell. Cells meeting this standard must pass tests involving: external short circuit testing; temperature cycling testing; free fall, vibration, and crush testing to evaluate mechanical safety; over-charging and forced discharge testing; and mechanical abuse testing, to ensure no fire or explosion occurs.
ISO 6469-1: Set by the International Organization for Standardization, this standard is used for rechargeable energy storage systems for electrically propelled road vehicles. Batteries used for transport applications are required to not leak, emit flames, rupture, or explode. Batteries are tested under various conditions, including vibration and mechanical shocks, rapid temperature changes, simulated vehicle crashes, water immersion, and fire exposure.
UL 2580 and UL 1973: Set by UL Standards & Engagement, these standards cover batteries for use in EVs (UL 2580) and energy storage systems (UL 1973). UL 2580 sets test requirements for battery resistance to environmental factors (thermal cycling, salt spray, water immersion), electrical stresses (overcharging, short circuits, imbalanced charging), mechanical stress (rotation, vibration, shocks, drops, and crushing), as well as fire exposure and single cell failure in a system. Both standards also apply a high potential test, used to evaluate the integrity of electrical insulation between the battery and the surrounding enclosure or vehicle. UL 1973 test requirements also include system level testing in high voltage applications.
UL 1642: More specific than UL 2580 and UL 1973, this standard applies specifically to lithium-ion battery cells. This performance standard is set through similar tests as those in the other UL standards, including electrical (short circuit, charging, discharging), mechanical (crush, impact, vibration), and environmental (heat, temperature cycling).
GB38031-2025: Set by China’s Ministry of Industry and Information Technology, “Safety Requirements for Power Batteries Used in Electric Vehicles” is a performance standard which includes tests at the cell, pack, and system levels. The cell level testing requirements include overcharge, over-discharge, short-circuit and crush tests, and for packs level testing requirements include vibration, mechanical shock, immersion, salt-spray, external fire resistance, amongst others. The most recent update has added a two-hour thermal containment period requirement to preclude fire or explosion, a five-minute early warning system for thermal incidents, real-world failure testing, fast-charging stress tests, and environmental stressors.Reference [56]
EUCAR: The European Council for Automotive R&D defines EUCAR hazard levels for the outcome of battery cell safety testing on a scale of zero to seven. The levels are defined in Table 4. These hazard levels can be used for the purpose of setting targets, setting no effect or loss of functionality as the ideal outcome of all safety testing.
| Hazard Level | Description | Classification Effect |
|---|---|---|
| 0 | No effect | No effect or loss of functionality |
| 1 | Passive protection activated | No defect, leakage, venting, fire, flame, rupture, explosion, or thermal runaway. No permanent damage to the cell. |
| 2 | Defect or damage | No leakage, venting, fire, flame, rupture, explosion, or thermal runaway. Cell is irreversibly damaged, repair needed. |
| 3 | Leakage < 50% | No venting, fire, flame, rupture, explosion. Electrolyte leaks less than 50%. |
| 4 | Venting >50% | No fire, flame, rupture, or explosion. More than 50% of electrolyte lost. |
| 5 | Fire or flame | No rupture or explosion. |
| 6 | Rupture | No explosion, but parts of active mass ejected. |
| 7 | Explosion | Disintegration of the cell. |
4.5. Cell Cost
Unlike other battery technology benchmarks, cost benchmarking is not done on an individual cell level, but rather on the aggregate for LFP and NMC chemistries. Cell chemistry is a major driver for battery costs and cost volatility. NMC chemistries require inputs of battery-grade nickel sulfate, cobalt sulfate, and lithium hydroxide, among others, which have seen high price volatility in previous years.Reference [57],Reference [58] LFP chemistries are somewhat less susceptible to this due to dependence on more abundant and overall cheaper inputs such as battery-grade iron and phosphate precursors, though lithium carbonate is still required.Reference [59] Figure 25 shows the historical and future projected price index benchmarks in USD for both NMC and LFP Li-ion cells.
In 2023, the benchmark cost for NMC was around 162$/kWh. For LFP, the benchmark cost was around 108$/kWh.
These costs are expected to decline further into 2040 offering a target NMC price of around 95$/kWh, and an LFP price of around 67$/kWh.Footnote f
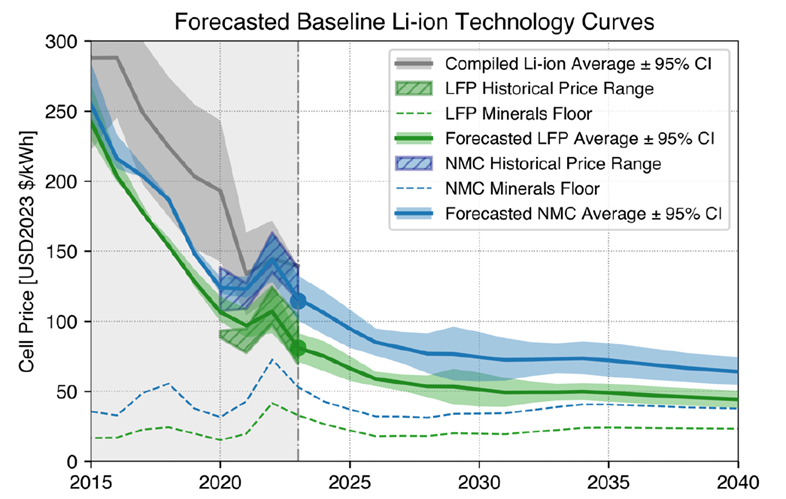
Figure 25: Historical and future price ranges (USD) of NMC and LFP batteries alongside total cost of input materials.Reference [60]
Figure 25 - Text version
The chart shows projected price forecast to 2040 for NMC (blue) and LFP (green) lithium-ion cells, presented in USD per kWh.
- Dashed lines indicate the forecasted price of minerals required for NMC and LFP production.
- 2025 projections: NMC ≈ $100/kWh, LFP ≈ $75/kWh.
- 2040 projections: NMC ≈ $70/kWh, LFP ≈ $50/kWh.
Takeaways
- Despite a temporary spike in price in 2022, the overall index has been on a steady decline over time. This is despite material costs staying relatively steady, as the cost of manufacturing (or, put differently, the gap between mineral price floor and average cell cost) has been decreasing over time.
- Battery prices are highly dependent on the price of battery grade reagents, which includes the cost of mining and refining to greater than 99% purity. To illustrate this, Figure 26 shows the sources of all material inputs which contribute to the cost of select lithium-ion chemistries.
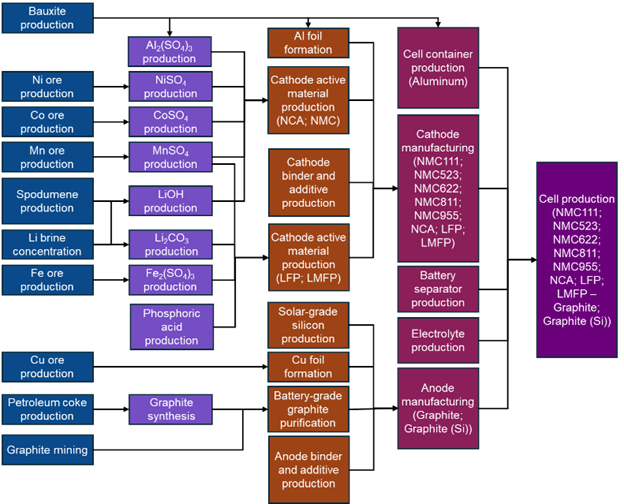
Figure 26: Flows of all input materials and processing steps from raw materials to cell production of select Li-ion battery chemistries. Adapted from Xu et al. Reference [61]
Figure 26 - Text version
The diagram illustrates the supply chain and production steps for lithium-ion battery cells, from raw material extraction to final cell assembly.
(From left to right)
- First column – Mineral extraction and concentration: The process begins with mining and concentration of key minerals such as bauxite (aluminium source), nickel, cobalt, manganese, spodumene (lithium source), iron, copper, petroleum coke, and graphite.
- Second column – Intermediate chemical processing: These minerals are converted into chemical compounds or reagents such as aluminum sulfate, nickel sulfate, cobalt sulfate, manganese sulfate, lithium hydroxide, lithium carbonate, and iron sulfate. Phosphoric acid and graphite purification also occur at this stage.
- Third column – Component manufacturing: Chemical reagents are combined to produce precursors for active materials. In the case of cathode materials NCA, NMC, LFP, LMFP are produced. Graphite and silicon undergo purification and binder preparation to produce anode materials. Production of aluminum and copper foils for current collectors along with binders and additives are also manufactured at this stage.
- Fourth column – Cell component production: Manufacturing of cathodes, anodes, separators, electrolytes, and cell containers (aluminum).
- Fifth column – Cell assembly: Integrating all components into battery cells, which can use different chemistries (NMC variants, NCA, LFP, LMFP, graphite, silicon).
- Since 2015, battery costs have declined by over 60% through a number of factors,Reference [19] including material price declines, material substitution, vertical integration, economies of scale, production efficiencies, and declining margins due to competition in the midstream.
- Innovation in cell design and manufacturing has enabled lower cost alternatives – one key driver of cost decline has been the shift to more abundant chemistries such as LFP. More recently, sodium-ion cells have potential to contribute to an overall lower price index on the aggregate as production of these abundant chemistries has increased in scale.
- Innovations in cell-to-pack configurations have also decreased this price index at the pack level, particularly for LFP. Comparing LFP and NMC cells, where NMC cells have higher energy density but higher cost, innovations in cell-to-pack configurations have allowed LFP chemistries to be competitive with pack-level energy density of NMC chemistries while maintaining lower cost.
4.6. Cell Sustainability
Cell sustainability can be measured in terms of GHG emissions in battery manufacturing, expressed as CO2-equivalent, but also in terms of other byproducts, including water and sulfate waste. Lifecycle Analysis (LCA) is used to account for the cradle-to-gate emissions footprint of specific battery technologies, based on the emissions footprint of all their input materials, regional electricity mix, and impact of all manufacturing processes. LCA is also used to measure material and byproduct streams.
Figure 27 shows region-specific estimates of GHG emissions from literature for LFP, NMC111, and NMC811 chemistries based on localized manufacturing in the United States, the European Union, and China.Reference [62],Reference [63] The assumed emission factor of the local grid is also presented to compare with the Canadian opportunity (based on 2019 and 2020 Canadian emissionsReference [64]).
Sulfate waste, in the form of water-soluble sodium sulfate or as gaseous sulfur compounds, can result from cathode manufacturing, from processing sulfide ores, or from electricity production, depending on the local grid. During production of NMC chemistries, the amount of sulfur waste byproduct (SOx) can vary from approximately 771 g/kWh for NMC111, up to approximately 1092 g/kWh for NMC811, depending on nickel content of the cathode, assuming a baseline LCA scenario.Reference [62]
High water consumption is another issue with battery manufacturing; water is used as a solvent during processing, is evaporated, consumed during hydroelectricity production, and used up in reactions. Assuming baseline LCA conditions, the water consumption in production of NMC batteries can vary from approximately 441 L/kWh for NMC111, down to approximately 390 L/kWh for NMC811. Reference [62]
GHG emissions target: Battery production has the potential to be significantly less GHG emission intensive. In an ideal scenario for battery production, electricity is sourced from a fully decarbonized grid, and as many processes as possible powered by fuels are powered by electricity instead. Furthermore, material sourcing in this ideal scenario can be modeled to come from increased shares of recycled content. In this ideal scenario, LFP and NMC could achieve a target GHG emission footprints of around 15-20 kg CO2eq/kWh and 20-30 kg CO2eq/kWh respectively. This target does not account for significant breakthroughs in battery manufacturing efficiency, or processes such as dry-coating or sulfate-free cathode production, which have the potential of reducing this footprint further. Reference [61],Reference [62]
Sulfate waste target: While state-of-the-art cathode production technologies produce sulfate waste byproduct, alternative methods that produce no sulfate waste have been demonstrated. In the scenario where these technologies are adopted, sulfate waste from cathode production may be eliminated as a target.
Water consumption target: For wastewater tied to hydroelectricity production, which lies outside the scope of battery innovation, no target is set. However, alternative cathode production technologies that nearly eliminate water waste have been demonstrated. In the scenario where these technologies are adopted and improved upon, water waste from cathode production may be eliminated as a target.
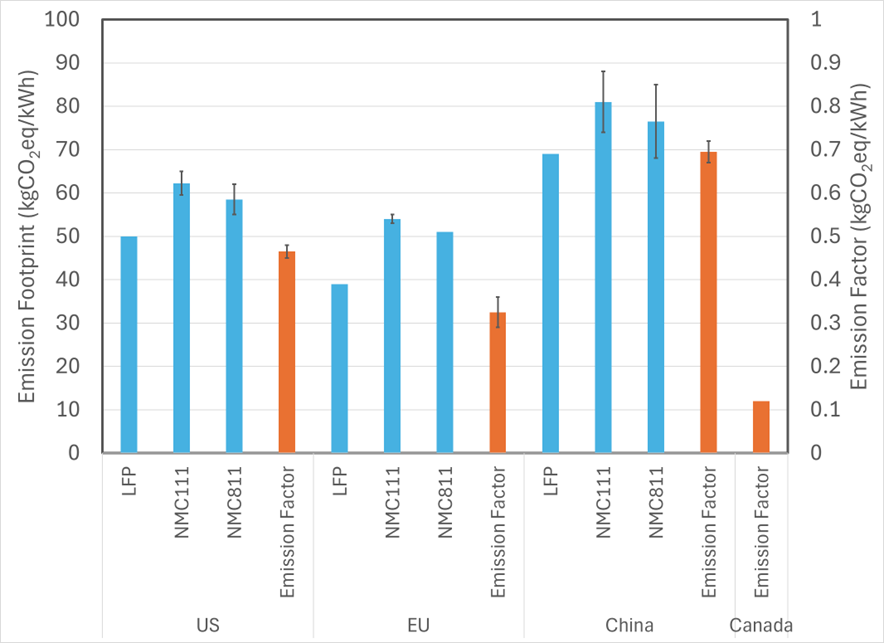
Figure 27: (left axis, blue bars) LCA-derived GHG emission footprints of LFP and NMC chemistries manufactured in United States, European Union, and China; (right axis, orange bars) Regional electricity production emission factors for United States, European Union, China, and Canada grids. Note: The error bars show the variations in the calculated GHG emission footprint across these sources, and show how assumptions can impact the final accounting, but that nonetheless, there is general convergence between these analyses.
Figure 27 - Text version
The bar chart compares the emission footprints (kgCO₂eq/kWh) of three battery chemistries—LFP, NMC111, and NMC811—alongside regional emission factors for the US, EU, China, and Canada. Blue bars show the battery production footprints, while orange bars represent emission factors. Error bars indicate variability.
- US: Battery footprints range from ~50 to ~65; emission factor is ~0.45.
- EU: Battery footprints range from ~40–50; emission factor is ~0.30.
- China: Battery footprints fall between ~70–80; emission factor is ~0.70.
- Canada: Only the emission factor is shown, at ~0.10.
Takeaways
- The GHG emissions footprint is in part commensurate with emission intensity of the local grid, meaning battery manufacturing localized in Canada has the potential to produce batteries with significantly lower GHG footprint than each of the regions shown in Figure 23.
4.7. Innovation Opportunities for Achieving Targets
There are multiple innovation approaches looking to bridge gaps between current battery performance and future targets, while also strengthening the value propositions for decarbonization, security, and competitiveness of the Canadian battery value chain. Innovation in the design and production of lithium-ion battery materials, cells and packs is an important path forward, but there are also various other chemistries, architectures, and variations on the standard battery cells benchmarked above which are also considered priorities in the SABI. These chemistries are emerging, scaling, or currently at-scale and often serve niche applications which require performance metrics not easily achievable by NMC or LFP cells.
4.7.1. Lithium-ion Batteries
Incremental advances across the battery value chain have proven effective to consistently improve performance while also reducing cost. This continues to motivate innovations in lithium-ion battery design.
One segment of the battery value chain that offers an opportunity for innovation is battery materials design and synthesis. Innovation in this area can enable production of cell components with fewer, less energy-intensive, and less waste-producing steps without sacrificing performance. Examples include innovation in morphology control and microstructure engineering of battery materials, such as single-crystal cathode materials, particle-size control, coatings, and dopants. These also have the potential to improve energy density, power density, lifetime, and safety.
Further downstream, innovative design and production of cells and packs also hold potential to improve battery performance metrics.
- Cell designs such as “anode-less” architectures, where the anode is formed from plating lithium metal from the cathode in the first charge cycle, are an example of an innovative pathway to increase energy density and reduce manufacturing cost.
- “Tabless” cell architectures that enable a continuous current collector tab are another example that could increase cell power capability, enabling high-capacity and more energy-dense cylindrical cells.
- Innovative combinations of anode, cathode, and electrolyte can endow cells with improved low-temperature capability or extended cycle life. Long cycle life can open the door to new battery applications like extended reuse of EV batteries in second-life operation such as stationary storage, and therefore reducing lifetime cost, GHG emissions, and the recycling burden.
- Dry coating during cell manufacturing is an innovative method to directly press the cathode and anode materials to the current collector and avoids the traditional wet process, which is more energy intensive, costly, and may use toxic solvents.
- Innovation to reduce the time of cell formation, which is the final cell production step and involves slow charge and discharge cycles taking several days, is another approach to reduce cost and energy consumption.
- Innovations in cell-to-pack configurations allow for more efficient organization of cells on the pack level which, while not improving cell-level energy density, can improve the pack energy density, which ultimately drives the battery-end use performance.
- Innovation in thermal management and battery management systems are also pathways to increase longevity and safety of batteries.
4.7.2. Advanced Lithium Batteries - Anodes
Most commercial NMC and LFP cathodes are paired with a graphite-based anode due to the favourable combination of graphite’s cycling stability and energy density. Graphite has a theoretical capacity of 372 mAh/g, which is relatively low compared to silicon or lithium metal, which have theoretical capacities of 4200 mAh/g and 3860 mAh/g respectively. Both these materials are being researched for use in advanced anodes.Reference [65] Despite their higher theoretical capacities, their practical capacities are much lower, and they pose a challenge for next-generation anode materials because they exhibit low cycling stability.
For silicon anode-based batteries, when lithium ions migrate from the cathode into the anode’s silicon material, the material expands by up to 400%, pulverizing the anode and lowering the coulombic efficiency. A composite graphite/silicon anode can boost energy densities of batteries to an extent (over 20%), but high silicon loading has not yet reached commercial readiness. Through innovation in silicon anode design, battery cells using NMC cathode and silicon-based anodes could reach up to 350-400 Wh/kg in cell density in the medium term.Reference [66]
Similarly, lithium metal anodes have shown potential for use in high energy density cells, with the long-term potential to surpass 500 Wh/kg on the cell level. Lithium metal anodes have several drawbacks: chemical reactivity of the lithium metal leads to potential safety events; uneven plating of lithium on the anode during charging may eventually lead to penetration of lithium dendrites through the separator and create an internal short circuit; lower cycle life; and increased demand for Li for an already high demand mineral. To mitigate most of these issues, a solid electrolyte is used to block dendrite growth and replace flammable liquid electrolyte with non-flammable solid electrolyte, thus lowering the risk of a safety event. Solid electrolyte material candidates primarily exist of oxide, sulfide, and polymer material classes. While these cell chemistries are still not commercially ready, continued innovation is needed to achieve viability in the medium to long term.Reference [67]
4.7.3. Advanced Lithium Batteries - Cathodes
The NMC cathode assumes about half the cost of modern lithium-ion battery cells and largely determines their energy density, as it occupies a little over one-third of the cell mass and volume.Reference [68] Innovation in cathode materials is therefore one of the key opportunities for meeting future battery performance targets.
Developing cathode chemistries with higher capacity and/or voltage offers the most direct pathway to increasing energy density. Substituting critical battery metals with more earth abundant battery metals offers the most direct pathway to reducing cost. Engineering and optimizing the microstructure of cathode materials is key to improving their performance, and finding efficiencies in production and manufacturing is another means to reduce cost.
In the medium term, continuing the trend of increased substitution of cobalt with nickel in layered oxide cathode materials like NMC simultaneously increases energy density and lowers cost. However, continued innovation is needed to maintain cycle life and safety due to faster degradation and increased thermal instability.Reference [69] Innovation to increase the upper voltage limit while maintaining stability in cells with mid-nickel NMC formulations is another avenue to increase energy density while maintaining cost.Reference [42]
Adjustments to the LFP manufacturing process to optimize microstructure and yield high compaction density translates to somewhat improved cell energy density and fast-charging capability, but this currently adds cost.Reference [42] Substitution of iron with manganese (which is also earth-abundant) to yield lithium iron manganese phosphate (LMFP) maintains the capacity and lower cost of LFP compared to NMC while increasing voltage and therefore energy density, but it also introduces poor rate capability and reduced cycle life.
Further out, lithium- and manganese-rich (LMR) layered structure cathodes are an evolution of NMC that substitutes nickel and cobalt with lithium and manganese, which results in specific capacities that can exceed 250 mAh/g (compared to about 200 mAh/g practical capacity for NMC with 80% nickel content) and a materials level energy density near 900 Wh/kg. Cells with LMR cathodes currently suffer from voltage fade, large initial capacity loss, poor rate capability and limited cycle life, which impedes their commercialization.Reference [70]
Another class of next-generation cathode materials called cation-disordered Li-excess rocksalts (DRXs) is capable of 300 mAh/g practical capacity and 1000 Wh/kg materials level energy density. These cathode materials include a variety of compositions including oxides and oxyfluorides with a variety of transition metals such as manganese, nickel, vanadium, molybdenum, chromium, and iron.Reference [71] Similar to LMR cathodes, DRX cathodes currently suffer from poor cycle performance and low round-trip efficiency, which also impedes their commercialization.
Sulfur cathodes have a theoretical specific capacity of 1675 mAh/g while using earth-abundant and environmentally benign materials. When paired with a lithium metal anode, a Li-S battery has a high theoretical energy density of 2500 Wh/kg. There are practical challenges with both a lithium metal anode and sulfur cathode that must still be resolved: low electrochemical utilization of sulfur, fast capacity fading, and low coulombic efficiency.Reference [72]
4.7.4. Flow Batteries
Redox flow batteries have an open cell architecture based on reversible reduction and oxidation reactions of active materials in an electrolyte solution. The electrolyte is stored in two tanks (the anolyte and catholyte) and passes through half-cell stacks separated by an ion-exchange membrane. Scaling the number of stacks will increase the power output.
These systems decouple the energy density and the power density because the tank size and stack size can be controlled independently, which is useful for stationary storage applications to control the duration of energy storage. These systems have traditionally been able to cycle for much longer than Li-ion batteries with minimal degradation, but Li-ion innovation is quickly catching up in this area.
Vanadium redox flow batteries are currently the dominant redox flow battery technology and is based on the four stable oxidation states of vanadium. While the energy density of vanadium redox flow batteries is generally much lower than that of lithium-ion (only 25-30 Wh/kg), these systems benefit from a cycle life of around 15,000 cyclesReference [73], compared to a current maximum of 5,000 cycles for a lithium-ion battery for stationary storage applications. The cost of the system is also significant. However, due to the long cycle life, the levelized cost of storage (LCOS) is comparable to that of lithium-ion batteries. Given that the electrolyte is aqueous, these systems are inherently safer (but more toxic) than lithium-ion-based ones.Reference [74]
Next-generation flow batteries aim to improve upon vanadium-only flow batteries, by utilizing lower cost and/or higher energy density chemistries such as organic active molecules, iron/chromium, vanadium/bromine, bromine/polysulfide, zinc/cerium, or zinc/bromine, for instance, but these adjustments often come at the expense of higher capacity fade, lower coulombic efficiency, and lower power density.Reference [75],Reference [76]
4.7.5. Sodium-Ion Batteries
Sodium-ion batteries are promising to reach energy densities on par with LFP cells, but without the need for lithium, copper, or graphite as a raw mineral input. Under certain design optimizations, they promise practical volumetric energy densities, and offer better performance at lower temperatures. Sodium-ion batteries have reached commercialization, with CATL’s first generation sodium-ion cell having a cost around $110/kWh in 2021. The minerals price for sodium-ion batteries is lower than those for Li-Ion batteries today, offering potential for a lower cell price through innovation.Reference 39
Sodium ions do not alloy with aluminum current collectors at normal conditions, offering an advantage over lithium-ion, since there is no need for more expensive copper current collectors.Reference [77] Further development of sodium-ion chemistries is still needed to boost the currently limited energy density; this can be achieved through finding optimal combinations of cathode and anode materials. Finally, cost of manufacturing can further decrease beyond that of the first-generation cells upon achieving production at-scale. In the long term, sodium-ion batteries could achieve cell energy densities exceeding 200 Wh/kg.Reference [78]
4.7.6. Other Metal-ion Batteries
Aside from lithium and sodium, which each have one valence electron that is transferred in the redox process, several other metals are candidates for rechargeable, intercalating battery chemistries.
- Zinc, having two valence electrons, is a potential candidate due to the abundance of zinc as well as its compatibility with aqueous electrolytes, promising a high degree of safety, though a lower voltage window. Limits to energy density for this chemistry mean it is most suited to stationary storage applications. In the long term, zinc-ion batteries could reach energy densities of 120 Wh/kg and 200 Wh/L.
- Magnesium, another divalent cation, has the potential for high energy density due to having twice as many electrons transferred per ion compared to lithium, despite its higher atomic mass. This cell configuration is still far from commercialization, and much of the current research is focused on right electrode material selections. In the long term, magnesium-ion batteries have the potential to compete with lithium-ion batteries on energy density while depending on more abundant mineral sources.Reference [78]
4.7.7. Metal-Air Batteries
Rechargeable metal-air batteries use a metal anode and oxygen as the cathode. In an open battery architecture, ambient air can be used, although compression and a gas diffusion electrode are then needed to prevent side reactions and to optimize air flow. An electrolyte is also necessary. Due to the lack of a solid cathode material, the energy density of this battery type is primarily driven by the choice of anode.
Lithium-air batteries have the potential for very high energy densities, as well as lower cost compared to lithium-ion batteries due to fewer material inputs. This technology is still very low TRL due to stability and safety issues such as dendrite growth. Rechargeable zinc-air and iron-air batteries are candidates for stationary storage systems due to their chemical abundance and good energy density. Compatibility with aqueous electrolyte also promises high safety of these systems. However, more innovation is needed to overcome poor cycle life and stability issues seen in these batteries.Reference [78]
5. Conclusion
Canada’s battery needs are driven by the electrification of transportation and by providing electric grid resilience through stationary storage and expected to reach 200 GWh/yr by 2035. The Canadian battery ecosystem is still nascent, and in order to meet the objectives of decarbonization, security, and competitiveness, it must address the vulnerability along the middle segments of the battery value chain. This segment is largely populated by smaller and less established entities, compared to those in the upstream and downstream portions of the value chain, although supported by growing innovation infrastructure.
Performance benchmarks for energy density, power density, lifetime, safety, cost and sustainability provide useful references for innovators and decision makers to characterize and compare batteries of varying applications and target markets. Innovations for batteries will further refine and expand their ability to meet the specific decarbonization and electrification challenges for civilian and defense applications. These include long-haul freight, marine and aerospace applications, electricity storage for residential, commercial, utility, and off-grid settings, to name a few. A thorough knowledge of the various battery performance metrics is needed to optimize these key metrics and meet final application requirements. The benchmarks, targets and innovations discussed in this report provide a common reference for the future work to achieve these optimizations.
Innovation must continue to be at the forefront of the Canadian battery ecosystem to meet future performance metric targets, pushing forwards the state-of-the-art of battery cells. This is achievable through the following advances: manufacturing techniques, which can reduce costs and become less environmentally impactful; cell design, which can boost energy density or power density metrics; and battery chemistry innovations, which can tap into properties of alternative battery materials and components to achieve performances which are harder to reach for standard lithium-ion battery cells.
Appendix A - Explanation of Key Terms
Anode, Cathode, and Electrolyte
The Anatomy of a Battery framework identifies the anode, cathode, and electrolyte as the critical components that define any battery type. Electrical energy is generated by conversion of chemical energy via electron charge-transfer (i.e. redox) reactions at the anode and cathode (i.e. the electrodes). These are separated by an electrolyte that provides ionic conductivity, while the electrons migrate through an external circuit.Reference [1],Reference [2],Reference [79]
Closed Cell and Open Cell Architectures
Closed cell architecturesReference [80] include cell designs where the critical battery components are hermetically sealed together, which applies to conventional lithium-ion batteries (see Figure 28a) as well as next-generation battery types like sodium-ion and solid-state batteries. In these examples, the anode and cathode materials are made up of solids, but the electrolytes may be liquid or solid (as in the case of all solid-state batteries).
Open cell architecturesReference [81] include cell designs where the critical battery components are not hermetically sealed together, which applies to redox flow batteries (shown in Figure 28b) and metal-air batteries.
In a redox flow battery, the anode and cathode are electroactive species dissolved in solutions (called the ‘anolyte’ and ‘catholyte’, or the ‘negolyte’ and ‘posolyte’). These are stored in external tanks and pumped during charging and discharging through an electrochemical cell containing an ion-selective membrane.
Hybrid redox flow batteries include at least one solid active material that is contained within the cell. Metal-air batteries typically consist of a metal anode, a liquid electrolyte, and an air (oxygen cathode) that is open to the environment.
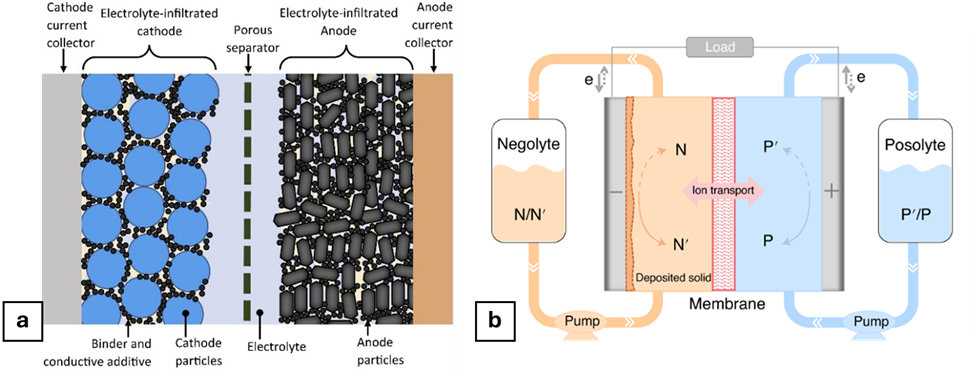
Figure 28: Schematic depictions of representative closed and open cell architectures, shown for (a) a conventional lithium-ion battery (closed system), and (b) a redox flow battery (open system).Reference [82],Reference [83]
Figure 28 - Text version
Two schematic diagrams comparing battery architectures:
- (a) Layered cross section of conventional lithium-ion battery (closed system) showing layers from left to right: cathode current collector, electrolyte-infiltrated cathode with binder and conductive additive, porous separator immersed in the electrolyte, electrolyte-infiltrated anode with anode particles, and anode current collector.
- (b) schematic system of redox flow battery (open system) depicting two tanks labeled Negolyte (N/N′) and Posolyte (P′/P) connected by pumps to a central membrane reactor equipped with current electrodes on each side of the membrane. Ion transport occurs across the semipermeable membrane between N′ and P′, with deposited solid indicated in the negative side. Electron flow moves through an external load between the positive and negative sides.
Non-active Components
In addition to the anode, cathode, and electrolyte, there are various non-active componentsReference [79] that play supporting but vital roles in battery operation, some of which are highlighted for in Figure 28 for conventional lithium-ion batteries.
A Separator is a physical barrier between the anode and cathode that prevents electrical shorting and therefore plays an important role in providing safety. It must be permeable to the ions in the electrolyte but also inert to the battery environment. Porous separators composed of polymeric materials such as polyethylene (PE) and polypropylene (PP) or composites of polymeric and ceramic materials are most used in conventional lithium-ion batteries.Reference [84],Reference [85] In a solid-state battery, which is a next-generation battery technology, not only is the liquid electrolyte replaced by a solid electrolyte in the electrodes, but so is the electrolyte-filled separator.Reference [86]
Current collectors and tabs are bridging components that collect electrical current generated at the electrodes and connect with external circuits. Commercial current collectors for lithium-ion batteries are aluminum and copper foils for cathodes and anodes, respectively.Reference [87] The tabs are welded to the current collectors and are made of small metallic strips.
Conductive Additives are added in small amounts to the electrode to facilitate electron-conducting pathways from the current collector to the anode and cathode particles. These electronically conductive additives are typically carbon-based.
Small amounts of binder, typically comprised of polymers (such as polyvinylidene fluoride, PVDF, for the cathode or styrene-butadiene rubber/carboxymethyl cellulose, SBR/CMC, for the anode), are responsible for homogeneous coating and adhesion of the active anode and cathode particles to the metal current collectors.Reference [88] The binder also maintains the mechanical integrity of the electrode, which repeatedly changes volume during cycling.
Cell Voltage
The voltage of a battery cell is the electric potential difference between the anode and cathode and is measured in volts (V). Because of the coupling between the flow of electrons (through the external circuit) and ions (through the electrolyte) that defines a battery, the cell voltage is directly related to the chemical potential difference between the anode and cathode and is therefore an intrinsic property of the materials.
A voltage range is defined by both upper and lower operating voltage limits that dictate the where the cell can be safely and reversibly operated. A battery cell functions on the reversible chemical reaction between the active materials to repeatedly store and release energy on demand.
At too high a voltage, the electrolyte will decompose due to oxidation reactions (i.e. losing electrons) at the delithiated cathode and reduction reactions (i.e. gaining electrons) at the lithiated anode.Reference [89] At too low a voltage, the copper current collector will oxidize, dissolve, and deposit at the cathode causing an internal short circuit.Reference [90] The voltage limits may be adjusted to be more or less restrictive depending on conditions such as temperature or battery aging.
While a battery operates in a voltage range defined by the upper and lower voltage limits, it is often convenient to specify voltage at a single value or nominal voltage, which is an averaged value within the voltage range.
Capacity (Q)
The capacity (Q) of a battery cell refers to the amount of charge (i.e. number of electrons) that can be stored within the cell voltage limits, which is directly related the amount of active anode and cathode material in the system. Capacity is most often measured in amp-hours (Ah), where 1A is defined as a flow of electric current of 1 Coulomb per second (1C/s), and a Coulomb is the fundamental unit of electric charge.
Pack Voltage (V) and Capacity (Ah)
Battery packs are comprised of multiple battery cells that are wired together in series and/or parallel configuration.Reference [91] When two identical cells are connected in series (i.e. end-to-end in an electric circuit), the system voltage is the sum of the voltages of the individual cells, while the system capacity remains constant as the capacity of one of the two constituent cells. When two identical cells are connected in parallel (i.e. with branching electric paths that divide the current), the system voltage remains constant as the voltage of one of the constituent cells, while the system capacity is the sum of the capacities of the individual cells. In larger packs, cells are commonly grouped in parallel and then wired in series and called a series string of parallel configurations.
Current (I)
Current (I) is defined as the flow electric charge (i.e. flow of electrons) and measured in amps (A). One amp is defined as a flow of electric current of 1 coulomb per second (1C/s), where a coulomb is the fundamental unit of electric charge. In a battery, during discharge, current is generated due to electrons flowing from the anode, where the active species is oxidized, to the cathode, where the active species is reduced, passing through an external circuit.
C-Rate (h-1)
The C-rate is a normalized indicator of the charging or discharging rate of a battery and is obtained by dividing current by capacity and measured in h-1. The reciprocal of the C-rate is therefore the duration of charging or discharging. For example, charging at a rate of 1C corresponds to a full charge from 0 to 100% state of charge in one hour, charging at 2C corresponds to a full charge in thirty minutes, and charging at C/2 corresponds to a full charge from in two hours.
For batteries with closed-cell architectures, the maximum C-rate is a fixed quantity and property of the cell design, but for batteries with open-cell architectures the C-rate may be variable. For example, for a redox flow battery, the capacity may be increased with larger quantities of anolyte and catholyte contained in larger tanks, independent of the electrochemical cell which controls the rate capability.
State of Charge (SOC) and Depth of Discharge (DOD)
The state of charge (SOC) is a measure of the remaining capacity available in a cell and is expressed as a percentage, where 0% corresponds to the lower voltage limit and 100% corresponds to the upper voltage limit. The depth of discharge (DOD) is an inverse measure, where 0% corresponds to the upper voltage limit and 100% corresponds to the lower voltage limit.
Coulombic Efficiency
Coulombic efficiency is the ratio of discharge capacity to charge capacity within the same cycle and is expressed as a percentage. A coulombic efficiency of 100% means all the charge that is put into a battery can be extracted in the ensuing discharge cycle. Coulombic efficiency is widely considered a quantifiable indicator of the reversibility of a battery, and the coulombic efficiency of a lithium-ion cell is normally better than 99% under normal operating conditions.
Round-trip Efficiency
Round-trip efficiency is the ratio of total energy output (on discharge) to total energy input (on charge) into the system. Because the charging voltage is higher than the discharging voltage, the round-trip efficiency is typically lower than the coulombic efficiency. For a conventional lithium-ion battery operating under normal conditions, the round-trip efficiency can vary between 85% and 95%.Reference [92]
Battery Cell Formats
Half and Full Cells
In R&D settings, battery cell designs are often geared towards characterization as opposed to optimizing performance metrics. One common configuration is a “half-cell” which is used to monitor the potential of one electrode independently of the other electrode and thus, as much as possible, evaluate individual battery electrode materials.Reference [93] In a lithium-ion battery, the electrode of interest is most often paired with a lithium metal electrode (serving as the reference and counter electrode) with a larger reservoir of capacity. Utilizing an excess of counter electrode material with a constant potential like lithium metal serves the purpose of minimizing its influence in cell voltage measurements.
Batteries geared towards practical applications are constructed in “full-cell” configurations, where the anode and cathode material capacities are closely matched or balanced. The capacity ratio of anode to cathode or “N/P ratio” is kept close to a value of 1. Cell voltage measurements in full-cell configurations reflect the combination of behavior at both electrodes.
Coin, Pouch, Cylindrical, and Prismatic Cells
Battery cells come in a variety of shapes and sizes depending on the intended use and application. For commercial lithium-ion batteries, which are closed-cell architectures, the four most common cell formats (coin, pouch, cylindrical, and prismatic) are depicted in Figure 29.Reference [94],Reference [43]
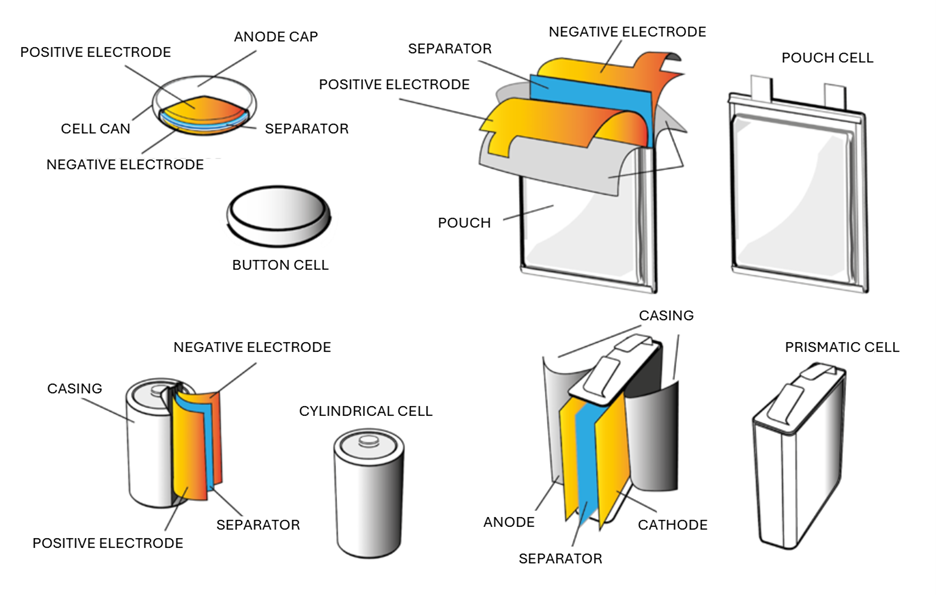
Figure 29: Typical cell types for commercial lithium-ion batteries.Reference [95]
Figure 29 - Text version
The illustration presents four different cell formats:
- Button (coin) cell – upper left: The negative electrode sits at the bottom of the cell, followed by the separator and the positive electrode. All layers are enclosed in a cell can beneath the anode cap.
- Pouch cell – upper right: Inside the pouch, the positive and negative electrodes are electrically isolated by the separator.
- Cylindrical cell – bottom left: The casing contains the positive and negative electrodes electrically isolated by the separator in a jellyroll configuration.
- Prismatic cell – bottom right: The casing covers the anode, separator, and cathode.
Coin cells have low capacity and are used mostly in R&D settings, where they are most often constructed by hand, or in small portable electronics. R&D lithium-ion coin cells with single-sided electrodes have capacities less than 10mAh,Reference [96] while commercial rechargeable CR2032 lithium-ion cells for portable electronics have capacities less than 100mAh.Reference [97]
Pouch cells are a rectangular, flexible, flat, and lightweight battery design where the cell contents are enclosed in a sealed aluminum-polymer composite film, similar to materials used in the food packaging industry (like potato chips). While the pouch foil material is lightweight and relatively low cost, it has lower mechanical stability compared to other formats with rigid enclosures. Pouch cells can be constructed with capacities as small as 25 mAh (for a 5 x 7 cm2 single layer R&D pouch cell),Reference [96] and in the upper limit, today they can exceed capacities of 100 Ah.Reference [98]
Cylindrical cells come in more standardized dimensions, such as 18650 (18 mm diameter and 65 mm length, 1-4 Ah capacity), 21700 (21mm diameter and 70 mm length, 2.5-5.5 Ah capacity), and more recently 4680 (47 mm diameter and 80 mm length, >20 Ah capacity), and the cell contents are enclosed in a rigid metallic casing.
Prismatic cells are a rectangular battery design where the cell contents are enclosed in a rigid metallic casing. Prismatic cells can be constructed with capacities less than 1 Ah, and in the upper limit, today they can exceed capacities of 1000 Ah.Reference [99],Reference [100]
Appendix B - Battery Performance Metrics Descriptions
Energy Density
The energy that can be stored in a cell (measured in watt-hours, Wh) is obtained by multiplying its nominal cell voltage (measured in V) by its cell capacity (measured in Ah). Energy density is then defined as the total amount of energy stored per mass or volume and is expressed in Wh/kg for gravimetric density and Wh/L for volumetric density, though other units may be used depending on the application.
This metric can be defined at different scales including at the active material (i.e. anode and cathode), cell, module, and pack levels, with a general rule of decreasing energy density along these levels. This follows as more non-active components such as the separator, current collectors, enclosure, and thermal management system contribute to the mass and volume of the system, without increasing the stored energy. The active material energy densities therefore define the theoretical energy density but the pack level energy density is used to select suitability for applications.
To illustrate this, the gravimetric and volumetric energy densities of two different lithium-ion cathode and anode chemistries is shown below in Figure 30. The energy density is shown at the theoretical and practical materials level, the cell level, and pack level.Reference [101] This shows that while the theoretical energy density for NCA is high, once combined with a select anode, and integrated into a cell and pack, the NCA battery yields similar energy density as an LFP battery, whose theoretical energy density is roughly half that of the NCA battery. A more complete example for LFP cathode and graphite anode chemistry is detailed in Appendix C - Cell Energy Density Sample Calculation.
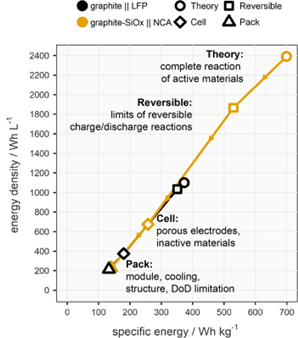
Figure 30: Gravimetric and volumetric energy densities for LFP/graphite and NCA/graphite-SiOx cathode and anode chemistries at the theoretical and practical materials level, the cell level, and the pack level.Reference [101]
Figure 30 - Text version
Scatter plot shows the volumetric (Wh/L) and gravimetric (Wh/kg) energy density values for different lithium-ion battery configurations. Two chemistries are shown:
- Graphite || LFP (black markers)
- Graphite-SiOx || NCA (orange markers)
Marker shapes represent four levels:
- Theory (circle): Highest values based on a complete reaction of active materials.
- Graphite-SiOx || NCA: Up to ~2400 Wh/L and ~700 Wh/kg
- Graphite || LFP: ~1100 Wh/L and ~375 Wh/kg
- Reversible (square): Slightly lower values, reflecting limits of reversible reactions.
- Graphite-SiOx || NCA: ~1900 Wh/L and ~525 Wh/kg
- Graphite || LFP: ~1000 Wh/L and ~350 Wh/kg
- Cell (diamond): Mid-range values that account for porous electrodes and inactive materials.
- Graphite-SiOx || NCA: ~650 Wh/L and ~250 Wh/kg
- Graphite || LFP: ~400 Wh/L and ~175 Wh/kg
- Pack (triangle): Lowest values, considering module, cooling, structure, and depth-of-discharge limitations.
- ~200 Wh/L and ~125 Wh/kg for both chemistries
Power Density
Power density is a measure of the rate capability of a battery, describing the flow of energy that can be input or output during charging and discharging, respectively, normalized by mass (expressed in W/kg) or volume (expressed in W/L).
Power (measured in watts, W) is defined as the product of current (I) and voltage (V), and it reflects both the time-independent and time-dependent mechanisms that occur in a battery’s operation (i.e. the thermodynamics and kinetics, respectively). For a lithium-ion battery, the kinetics at play include diffusion of lithium in the active materials, electron conduction in the electrodes, mass transport of lithium in the electrolyte, phase transitions, and charge transfer reactions, to name a few. For comparison, energy density is a time-independent property of a battery.
Battery power requirements are specified under precise conditions, including but not limited to the magnitude (or C-rate), direction (charging or discharging), temperature, duration (continuous or pulse power), and state of charge (SOC).
At higher charging and discharging rates, batteries increasingly undergo dissipative processes that contribute to heat generation and phenomena that may lead to degradation, rather than the desired reversible interconversion of chemical and electrical energy. Charging and discharging at higher rates leads to early breaching of the upper and lower voltage limits, respectively, and therefore limits the accessible capacity and lowers the round-trip efficiency, illustrating an inherent trade-off between energy and power.
In a battery with a closed-system architecture, the rate capability can be improved by increasing the quantity of inactive components relative to the active materials, by employing thinner electrode coatings, thicker current collectors, more conductive additives, or more electrolyte, for example. However, this comes at the cost of lowering the cell energy density and is illustrated in Figure 31. This figure shows that for a selected battery chemistry, cell design and electrode engineering (NMC 111 vs NMC 622) can modify the power-to-energy ratio (P/E) of cells across a substantial range.Reference [102]

Figure 31: Estimated battery peak charging power versus cell energy density for groupings of selected cathode active materials paired with graphite anodes for a hypothetical 100 kWh battery pack. Adapted from Masias et al.Reference [102]
Figure 31 - Text version
The chart shows the relationship between peak charging power (kW) and cell energy density (Wh/L) for two lithium-ion chemistries: NMC 111 and NMC 622. Materials with higher energy appear farther to the right on the figure.
- NMC 111 (blue region): Covers an energy density range of ~100–450 Wh/L and peak charging power of ~100–950 kW, with power-to-energy (P/E) ratios of 26, 9, and 4.
- NMC 622 (red region): Covers an energy density range of ~300–500 Wh/L and peak charging power of ~200–950 kW, with power-to-energy (P/E) ratios of 16 and 7.
In a lithium-ion battery, charging at high rates also runs the risk of promoting undesired lithium metal plating rather than incorporation into the graphitic anode. Charging lithium-ion batteries at low temperatures worsens lithium metal plating (as lower temperatures correspond to slower kinetics of all processes and therefore lower power capability). In general, it is more challenging to sustain higher power for longer durations as opposed to shorter pulses, higher charging power at high SOC as opposed to low SOC, and higher discharging power at high depth of discharge (DOD) as opposed to low DOD.
Lifetime
One of the key value propositions of batteries is their ability to charge and discharge for many cycles and long times with limited degradation of performance. While primary batteries without charging capability exist and are implemented in applications that can comply with one-time use, their role in the energy transition is limited and are not considered further in the analysis presented in this report.
In an idealized scenario, a battery operated in conditions where the targeted reversible electrochemical reaction occurs to the exclusion of all undesired reactions and irreversible processes can last indefinitely. In practice, as the number of charge and discharge cycles increases and as time elapses, the performance and life of a battery gradually deteriorate due to the laws of thermodynamics. For lithium-ion batteries, which can reach very high coulombic efficiencies (99.99%) accumulating 2000 cycles still will reduce the capacity by just under 20% (i.e. 0.99992000 = 0.82).
Different cell designs and battery chemistries will undergo different degradation mechanisms that limit their energy and power capability (expressed as the state of health, or SOH). Main aging pathways that occur in lithium-ion batteries include but are not limited to the following: contact loss between current collectors and electrodes due to corrosion and cracking; cathode micro-structure disordering; active material micro-cracking and degradation; transition metal dissolution; dendrite formation and precipitation; and surface film formation and growth.Reference [103]
Different battery degradation mechanisms are triggered under varied operating conditions, not only during cycling, but also when no current is being passed through the cell, known as calendar aging. Calendar aging is accelerated at higher temperatures, which increases the rate of all thermally driven reactions, and at higher SOCs, which represent more reactive conditions in the cell. When batteries are stored at a charged state for an extended period, parasitic chemical reactions will also lead to self-discharge that lowers the charging capacity (expressed as a percentage lost per month), some fraction of which can typically be recovered on the ensuing charge.
Battery degradation during cycling will also depend on specific conditions, such as the temperature, SOC window, C-rate, and specific duty cycle. In laboratory settings, batteries are most often cycled under conditions with constant current and temperature across the full SOC range (i.e. from 0 to 100% SOC with specified voltage limits). For lithium-ion batteries, a judicious selection of anode, cathode, and electrolyte materials as well as cycling conditions can enable several thousands of cycles before reaching end of life conditions, often considered 80% of the original capacity.
Battery duty cycles have current oscillations, pulses and rests, and profiles that are more difficult to standardize for laboratory testing. Therefore, the number of cycles is typically specified as the amount of accumulated capacity throughput (measured in Ah), energy throughput (measured in Wh), or full equivalent cycles (the capacity throughput normalized by cell capacity). For dynamic cycling conditions, only a statistical description of the operating conditions can be used, such as time-based histograms and mean, minimum, and maximum values.
These distinctions are important as constant-current and application-specific cycling may have different effects on battery aging. In lithium-ion batteries, for example, a study comparing 37 different dynamic discharge profiles with average discharge currents ranging from C/16 to C/2 on 92 commercial silicon oxide-graphite/nickel cobalt aluminum (NCA) cells found that battery lifetime increased by up to 38% in comparison to constant-current cycling with the same average C-rate and voltage window.Reference [104]
Battery warranty periods are driven by failure rates rather than actual end of life conditions. For example, if an 8-year warranty corresponds to 1% of cells prematurely reaching end-of-life conditions, and battery lifetime is normally distributed with a standard deviation of 3 years, then the mean battery lifetime is 15 years.
Safety
Ensuring safety is critical in all battery applications. This is especially true when in a charged state since batteries contain high concentrations quantities of oxidizer (cathode) and fuel (degraded anode reacting with electrolyte), most often in close proximity and in a sealed environment.Reference [105] To underscore this point, this close arrangement of oxidizer and fuel is not unlike those for explosives and rockets.
Normal operation of a battery involves the safe and controlled interconversion of chemical and electrical energy over many cycles. Microscopic faults and in-service threats can lead to abrupt, irreversible, and uncontrolled release of energy or thermal runaways. To demonstrate safety performance, batteries are subject to multiple mechanical, electrical and thermal abuse tests to simulate the microscopic fault mechanisms and macroscopic effects of thermal runaway faults and abusive conditions.
| Mechanical: | Crush, penetration, breakage, bending |
|---|---|
| Electrical: | External short circuit, internal short circuit, over-discharging, overcharging |
| Thermal: | External heat exposure, external ignition sources, thermal shock test, inappropriate thermal management |
For individual lithium-ion batteries, field failures from manufacturing defects causing internal short circuits may have very low probabilities (e.g. catastrophic failure rates for 18650 cells are estimated at 1 in 1 to 4 million cells), but considering hundreds to several thousand cells can be deployed in a given target application, the leads to an important increased risk of a safety event.Reference [106]
No single metric or parameter determines battery safety and multiple different failure modes can lead to a safety event. Several approaches are implemented together across battery scaling (materials, cells, packs, and system) and stages of a battery’s lifecycle to reduce the probability of a safety event and lessen its severity should one occur.Reference [93] Accordingly, several organizations and countries have developed safety standards and testing protocols which are crucial to engineering safety in battery applications.
Cost
The cost of a battery is most affected by the cost of the following:
- input materials - precursors for cathode and anode, electrolyte, current collectors, separators, casing, etc.;
- energy input - electricity, transportation, heat; and
- manufacturing - direct costs such as labour, equipment, consumables and production volume and indirect costs such as engineering, overheard, shipping and import costs.
This cost is cumulative along the entire value chain although it is sometimes expressed only at the material, cell, pack or system level. The cost of a battery is generally expressed as dollars per production volume reflecting the total economy of scale of large-scale production, for example, $/kWh or $/kg.
The cost of a battery cell is a composite metric, reflecting both the cost of the inputs, and the energy stored inside the cell. A battery using inputs of half the cost of another battery, but with lower energy density for those materials, will not be half the cost on a normalized basis. Power cells are generally more expensive than energy cells on a $/kWh basis, since power cells optimize power density through addition of non-active materials at the cost of active materials in the same volume.
Much of the battery supply chain is localized in China (with the exception of mineral sourcing), and features multi-step, sequential processes to transform raw materials to a finished battery module. Achieving this at-scale while vertically integrating across the supply chain reduces prices by allowing downstream firms to supply inputs at-cost as well as create economies of scale which reduce CAPEX per unit production. The knowhow that comes with higher manufacturing throughput translates to improved yields, as processes are made more efficient which reduces the overall OPEX of ongoing manufacturing output.Reference [107]
Geography and jurisdiction also influence the cost of battery manufacturing. Local considerations like electricity prices and labour costs, cost of transportation of physical goods, as well as regulatory barriers and import tariffs all add costs which vary dramatically across regions. Favourable commodity pricing and policy, increased automation leading to lower labour requirements, and geographical consolidation are all factors which drive down cost.
Finally, in addition to upfront cost, battery operation and maintenance requires additional capital input throughout the ownership lifetime. Battery charging requires purchase of external charging equipment as well as costs of electricity input. Costs of maintaining battery systems also contribute to the total cost of ownership, such as replacing defective parts.
Sustainability
Batteries can significantly decarbonize transportation applications (provided a clean electricity input) and enable decarbonization of the electricity grid (in combination with intermittent renewables). Nonetheless, there is still a front-loaded emissions cost for the production of battery systems. The impact of battery manufacturing and use can be measured from cradle-to-gate (called embedded emissions). This is done by accounting the emissions of the entire manufacturing supply chain up to the time it is put into service. It can also be measured from cradle-to-grave, where the emissions from manufacturing are compared with the total lifetime emissions reductions stemming from operation of the product, or in terms of cradle-to-cradle, where the emissions associated with end-of-life, reuse, and recycling are also accounted for.
To normalize emission impacts and compare them against alternatives, emissions are expressed as kgCO2eq/kWh. This metric accounts for the total tonnes of CO2 emitted during manufacturing, in addition to all other greenhouse gasses (GHGs) emitted. These other emitted GHGs are converted to tonnes of CO2 that would have the equivalent global warming potential. This number, whether on the material, cell, or pack level, is then normalized to the total size of the battery.
Much like cost of a battery, total GHG emissions from battery manufacturing are accumulated throughout the process of turning raw materials into battery systems. There is a GHG footprint associated with the extraction of each raw material, stemming from all associated mining activities such as operation of mining equipment, clearing land vegetation and soil, transportation of ores, and blasting. Purification to battery grade precursors also requires a large energy input, both thermal and electrical. Thermal heating may be sourced from carbon-emitting fuels such as coal or natural gas, and electricity will be sourced from the local grid, and has its own GHG footprint. Smelting may also require a reducing agent, often carbon, which will be directly consumed in the process and emit CO2. Electricity is also used during manufacturing and assembly processes for components, cells, and packs, which again emits based on the GHG footprint of the local grid. Finally, transportation of components and cells across geographies also contributes to the total GHG footprint of batteries.
Battery manufacturing is also associated with the production of other waste byproducts which, while not contributing to the greenhouse effect, cause other environmental sustainability concerns.
Sulfate waste: The conversion of raw mineral inputs to cathode material requires a middle step of converting metals to metal sulfates, which then creates sodium sulfate byproduct upon production of cathode material. While non-toxic in nature, excessive concentrations of sodium sulfate leads to environmental concerns such as promotion of microorganism blooms in watersheds and eutrophication.Reference [108]
Water: There is also a large water usage footprint in battery production. Water is used as an input in the cathode production process as a solvent and is removed as wastewater carrying sodium sulfate and ammonia. Water is also used in hydroelectricity production, which can be a significant input depending on local electricity mix.Reference [109]
Trade-offs and Composite Metrics
The performance metrics discussed in this Appendix are interrelated and have several fundamental trade-offs which are influenced by battery design and chemistry.
A first trade-off to examine is how batteries provide less energy when discharged at a higher rates, but nonetheless a battery with higher energy and power density is capable of a more extreme release of energy.Reference [110],Reference [111] This is shown in Figure 32 for NCA, NMC, and LFP battery cathode materials are compared across power and energy density, and tested at different ambient temperatures and at various discharged rates. Chemistries with high concentrations of nickel exhibit higher energy and power density than lithium iron phosphate, but they also have lower thermal stability, higher cost, and are more likely to have shorter cycle life (depending on the specific cycling conditions). Therefore higher energy batteries require more thermal management and have a higher potential for safety events.
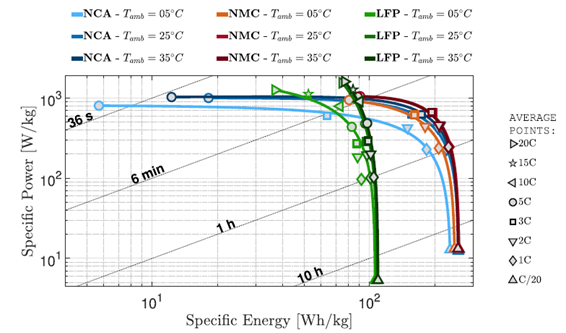
Figure 32: Energy density and power density trade-off for selected commercial cylindrical lithium-ion cells with NCA, NMC, and LFP cathode chemistry tested at different ambient temperatures.Reference [111]
Figure 32 - Text version
This log-log plot shows specific power (W/kg) versus specific energy (Wh/kg) for three lithium-ion chemistries at ambient temperatures of 5°C, 25°C, and 35°C.
- NCA (blue curves): High specific power (~800-1000 W/kg) at low specific energy, (~10 Wh/kg), with power decreasing as energy increases toward ~250 Wh/kg.
- NMC (orange and red curves): Similar trend, with ~1000 W/kg at ~80-90 Wh/kg and decreasing power as energy increases toward ~250 Wh/kg.
- LFP (green curves): Steep drop in power, from ~1000-1100 W/kg at ~75 Wh/kg to near zero power input by ~100 Wh/kg.
- Markers indicate average discharge rates: triangle-left (20C), star (15C), triangle-right (10C), circle (5C), square (3C), inverted triangle (2C), diamond (1C), and triangle (C/20).
- Diagonal lines represent discharge times of 36 s, 6 min, 1 h, and 10 h.
Three other useful metrics to consider for trade-offs between different battery performance metrics, are available energy, levelized cost of storage (LCOS), and annuitized capacity cost (ACC). These encapsulate a combination of energy, power, safety, lifetime, and/or cost.
Available Energy refers to the energy capacity (expressed in Wh) for a range of SOC to meet specified power requirements for a given application. The available energy can also be expressed as an end-of-life (EOL) condition, and can therefore be a composite metric for energy, power, and lifetime information.
Levelized Cost of Storage (LCOS) is a measure of the overall cost per unit of discharged electricity, taking all costs incurred over lifetime divided by the cumulative delivered electricity (expressed in $/MWh).Reference [112] The costs incurred over the lifetime include investment, operating costs, charging, and end of life disposal, while the lifetime energy discharged is the product of discharge energy capacity, number of discharge cycles per year, and years of operation. LCOS is expressed as follows.
Annuitized Capacity Cost (ACC) is a measure of the lifetime cost (as defined above) divided by the product of power capacity and lifetime (expressed in kW∙years):Reference [112]
Appendix C - Cell Energy Density Sample Calculation
Gravimetric Energy Density Calculations for Lithium Iron Phosphate (LFP) Cathode and Graphite Anode Chemistry
The illustrative example below is derived from first principles, the gravimetric energy density at the materials level (theoretical and practical), and compares to values of a representative commercial cell and pack.
Theoretical Materials Gravimetric Energy Density
The nominal voltages of LFP (chemical formula LiFePO4) and graphite (chemical formula C6) in lithium metal half cell configurations are approximately 3.35 V vs. Li/Li+ and 0.1 V vs. Li/Li+, respectively, so the nominal voltage of an LFP-graphite full cell will be approximately 3.25 V.
The theoretical gravimetric capacities (Qth) of the cathode and anode materials are obtained by calculating the molar mass (M) from their respective chemical formulas (where 1 mol = 6.022 x 10²³ atomic formula units), where there is one electron stored for every lithium ion that can be theoretically inserted into the electrode materials’ atomic crystal structures.
,
where n =1 (i.e. 1 electron per lithium), and F is Faraday’s constant, which reflects the charge of 1 mole of electrons, and where the charge is expressed in Ah.
In an equally balanced full-cell configuration with equal capacities of LFP anode and graphite cathode (i.e. N/P =1), the theoretical gravimetric capacity of the active materials is the following.
The theoretical gravimetric energy density of the active materials (Wmaterial_th) is obtained by multiplying Qmaterials_th by the nominal cell voltage.
Practical Materials Gravimetric Energy Density
In practice, the entirety of the theoretical capacity is not available for cycling even at very low charging and discharging rates, and only a fraction of theoretical capacity is reversible, which is the practical materials gravimetric energy density (Qpr).
Additional practical considerations such as lower first-cycle coulombic efficiency and N/P ratio deviating from unity will further lower the practical materials energy density.Reference [113]
Cell Gravimetric Energy Density
In the previous calculations, only the mass of the active materials was considered in the calculation and did not include the mass of the inactive cell components and enclosure, which will lower the energy density. In this sample calculation, we use the BYD Blade C102F cell. This is a large format prismatic LFP-graphite cell used in EVs (shown below in Figure 33) which has 138 Ah capacity (Qcell) and weighs 2.54 kg (mcell).Reference [114]
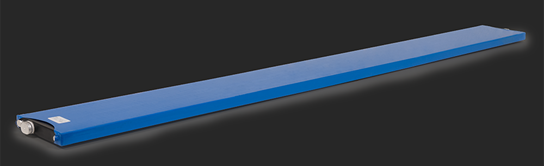
Figure 33: Image of a BYD Blade C102F prismatic LFP cell.Reference [106]
The cell energy density is the following.
Pack Gravimetric Energy Density
Individual cells are wired together and typically grouped into modules and then into packs. Cells may also be grouped directly into a pack, known as cell-to-pack integration (depicted in Figure 34).Reference [115]
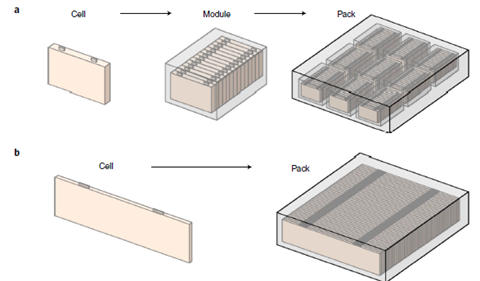
Figure 34: A schematic illustration of (a) a conventional battery pack comprised of prismatic cells and (b) a battery pack with cell-to-pack integration.Reference [115]
Figure 34 - Text version
Schematic illustration of li-ion cell packing methods:
- Conventional battery pack: A prismatic cell is packed into a module containing multiple prismatic cells. Several of these modules, nine in total, are packed into a battery pack.
- Cell-to-pack integration: A larger prismatic cell is integrated directly into a battery pack alongside other cells of the same size. Each large cell occupies a single cell position within a multi-cell pack structure, eliminating the need for traditional modules.
In this sample calculation, we use the long-range version of the BYD Dolphin battery pack. This passenger electric vehicle weighs 1650 kg, has a 185-395 km driving range (depending on weather conditions and city or highway driving), and consists of 104 BYD Blade C102F cells (ncells) wired in series and weighs 308.6 kg (mpack).Reference [116],Reference [117]
The pack energy density is the following.
Appendix D - Reference Data
The following appendix presents data tables which were used in part to establish benchmarks and targets in this report. This data was sourced from the European Council for Automotive R&D (EUCAR), Batteries Europe, the United States Advanced Battery Consortium (USABC), and the Fraunhofer Institute for Solar Energy Systems. The data is applicable to batteries for automotive applications, stationary storage applications, and emerging battery cell chemistries and designs including sodium-ion batteries, solid-state batteries, and other niche market chemistries (e.g. zinc-ion, lithium-air, sodium-sulfur, etc.).
| BEV – Parameter at Cell Level | Unit | Conditions | State of the art 2019 (approximated average values) | Target 2030 Mass market PC low range ~400km | Target 2030 Mass market PC high range >600km | Target 2030 Mass market commercial HDV |
|---|---|---|---|---|---|---|
| Specific energy | Wh/kg | @1/3C charge and discharge at 25°C (charging with CC and CV* step) | ~250 | 450 | 450 | 450 |
| Energy density | Wh/L | @1/3C charge and discharge at 25°C (charging with CC and CV* step) | ~500 | 1000 | 1000 | 1000 |
| Continuous specific power – discharge | W/kg | 180s, SOC100%-10%, 25°C | 750 | 1000 | 1000 | 1000 |
| Continuous power density – discharge | W/L | 180s, SOC100%-10%, 25°C | 1500 | 2200 | 2200 | 2200 |
| Peak specific power PC – discharge / peak specific power CV** - discharge | W/kg | 10s, SOC50%, 25°C / -25°C (PC) 60s, SOC50%, 25°C / -25°C (HDV) |
1500 / 500 | 1800 / 600 | 1800 / 600 | 1350 / due to performance |
| Peak power density PC – discharge / peak power density CV** - discharge | W/L | 10s, SOC50%, 25°C / -25°C 60s, SOC50%, 25°C / -25°C |
3000 / 1000 | 4000 / 1300 | 4000 / 1300 | 3000 / - |
| Charging rate | C (1/h) | SOC0%-80% | 3 | 3.5 | 3.5 | 3 |
| Self discharge | % | SOC100%, 25°C, 30 days | 1 | 1 | 1 | 1 |
Cycle lifetime WLTP for cars Cycle lifetime for truck / bus |
Energy throughput MWh | 25°C, DOD90% until SOH80% | ~20 | 22 to 24 | 22 to 24 | N/A |
| Hazard level | EUCAR safety levels | <=4 | <=4 | <=4 | <=4 | |
| Cost | €/kWh | 220 | 70 | 70 | 70 | |
| Cell volume per battery pack | % | 60 | 75 | 75 | 75 | |
| Cell weight per battery pack | % | 70 | 80 | 80 | 80 | |
| Lifetime expectation | Years & km | DOD90% | Lifetime of a car 150,000 km |
Lifetime of a car 150,000 km |
Lifetime of a car 150,000 km |
N/A |
| Cost | €/kWh | *+30% of cell cost | *+20% of cell cost | *+15% of cell cost | N/A |
PC = passenger car; HDV = heavy duty vehicle; CC = constant current; CV* = constant voltage; CV** = commercial vehicle.
| End of Life Characteristics at 30°C | Units | Cell Level |
|---|---|---|
| Peak discharge power density, 30s pulse | W/L | 1400 |
| Peak specific discharge power, 30s pulse | W/kg | 700 |
| Peak specific regen power, 10s pulse | W/kg | 300 |
| Usable energy density | Wh/L | 550 |
| Specific usable energy (defined at power target) | Wh/kg | 275 |
| Calendar life | Years | 10 |
| Cycle life (25% FC) | Cycles | 1000 |
| Cost (@250k annual volume) | $/kWh (USD) | 75 |
| Normal recharge time | Hours | < 7 hours, J1772 |
| Fast charge rate | Minutes | 80% useable energy target in 15 mins |
| Minimum operating voltage | V | >0.55 Vmax |
| Unassisted operating temperature range | Wh/kg | 70% specific useable energy at -20°C |
| Survival temperature range, 24 hr | °C | -40 to +66 |
| Maximum self-discharge | %/month | <1 |
FC = fast charge; values correspond to End-of-Life (EOL) at 30°C; refer to USABC EV testing manual for the definition and testing procedure.
| End of Life Characteristics at 30°C | Units | System Level | Cell Level |
|---|---|---|---|
| Peak discharge power density, 30s pulse | W/L | 1000 | 1500 |
| Peak specific discharge power, 30s pulse | W/kg | 470 | 700 |
| Peak specific regen power, 10s pulse | W/kg | 200 | 300 |
| Usable energy density @ C/3 discharge rate | Wh/L | 500 | 750 |
| Usable specific energy @ C/3 discharge rate | Wh/kg | 235 | 350 |
| Useable energy @ C/3 discharge rate | kWh | 45 | N/A |
| Calendar life | Years | 15 | 15 |
| DST cycle life | Cycles | 1000 | 1000 |
| Cost @ 250k units | $/kWh (USD) | 125 | 100 |
| Operating environment | °C | -30 to +52 | -30 to +52 |
| Normal recharge time | Hours | < 7, J1772 | < 7, J1772 |
| High rate charge | Minutes | 80%ΔSOC in 15 min | 80%ΔSOC in 15 min |
| Maximum operating voltage | V | 420 | N/A |
| Minimum operating voltage | V | 220 | N/A |
| Peak current, 30s | A | 400 | 400 |
| Unassisted operating at low temperature | % | >70% useable energy @ C/3 discharge rate at -20°C | >70% useable energy @ C/3 discharge rate at -20°C |
| Survival temperature range, 24 hr | °C | -40 to +66 | -40 to +66 |
| Maximum self-discharge | %/month | < 1 | < 1 |
DST = dynamic stress test
Energy
| KPI | Definition | System/ pack/ cell level | Unit | TRL | 2023 | 2027 | 2030 | 2035 | 2050 |
|---|---|---|---|---|---|---|---|---|---|
| Gravimetric energy density | Nominal energy content divided by weight of the cell* | Cell | Wh/kg | 7 | 250 | 400 | >400 | >500 | 750+ |
| Volumetric energy density | Nominal energy content divided by weight of the cell* | Cell | Wh/kg | 7 | 500 | 1000 | >1000 | >1000 | >1500 |
*Including sensors only if in-cell or on-cell and (dis)integrated BMS only if at cell level
Operation (power charging) related KPIs
| KPI | Definition | System/ pack/ cell level | Unit | TRL | 2023 | 2027 | 2030 | 2035 | 2050 |
|---|---|---|---|---|---|---|---|---|---|
| Gravimetric power density | Nominal average power delivered by the cell through a full discharge (based on the Usable Cell Energy) divided by the weight of the cell* | Cell | W/kg | 7 | 750 | 900 | 1000 | >1000 | >1500 |
| Volumetric energy density | Nominal average power delivered by the cell through a full discharge (based on the Usable Cell Energy) divided by the volume of the cell* | Cell | W/kg | 7 | 1500 | 2000 | 2500 | >2500 | >3000 |
*Including sensors only if in-cell or on-cell and (dis)integrated BMS only if at cell level
Gen4 Na-ion batteries for stationary storage applications
| Typical cathode materials | Typical anode materials | Typical other materials |
|---|---|---|
| NaxTMO2 layered oxides, Polyanionic cathodes (e.g. Na4Fe3(PO4)2P2O7, Na3V2(PO4)2F3, Prussian blues and its analogues | Hard carbons, soft carbons or Sn-based, Na metal-based | Solid electrolyte: sulfite-based e.g. Na3PS4, oxide-based e.g. Nasicon, or polymer-based |
| KPIs | SOTA | 2027 | 2029 | 2035 |
|---|---|---|---|---|
| Specific energy at cell level (Wh/kg) | - | 160 | 220 | - |
| Volumetric energy density at cell level (Wh/L) | - | 250+ | 500 | - |
| Cycles (EFC at 60-80%DOD) | - | 1000+ | 4000+ | - |
| EUCAR hazard level | - | 2 | 2 | - |
| Operating temperature range (°C) | - | Below RT to 60 | -20 to 80 | - |
| Cost per cycle (€/kWh/cycle) (pack level) | - | 0.5 – 1.0 | < 0.25 | - |
TM = transition metals, RT = room temperature
| 2021/2 (short term) | 2025 (medium term) | 2030 (long term) | 2035 (vision) | |
|---|---|---|---|---|
| Political Goals | - | EU goal: Gen.3 250-400 Wh/kg, 750-1000 Wh/L cost at pack level < 100 €/kWh |
EU goal: Gen.4 400-500+ Wh/kg, 800-1000+ Wh/L cost at pack level < 75 €/kWh |
- |
| LIB Market | 400 GWh | 0.5–2 TWh | 1-6 TWh | 2–8 TWh |
| SSB Market | PBE: < 2 GWh | OBE: 0–1 GWh SBE: 0–5 GWh PBE: 2-15 GWh |
OBE: 5–10 GWh SBE: 5–15 GW PBE: 5–30 GWh |
OBE: 10–20 GWh SBE: 20–50 GWh PBE: 10–50 GWh |
| SSB Applications | PBE: Buses; Industrial applications, e.g., AGV | OBE: Industrial heavy-duty & harsh environment equipment; Passenger cars SBE: Autonomous aircraft (drones); Passenger cars PBE: Stationary storage; Passenger cars and trucks |
OBE: Industrial heavy-duty & harsh environment equipment; Passenger cars SBE: Autonomous aircraft (drones); Passenger cars PBE: Passenger cars and trucks |
SBE: Passenger aviation, trucks |
| Cell Integration | All forms - Safety aspects of metallic lithium and H2S formation for sulfides in case of accident must be considered.
High volume changes must be compensated → high external pressure required (oxides, sulfides) / small external pressure required (polymers) PEB: needs heating to 50-80 °C |
All forms - Safety aspects of metallic lithium and H2S formation for sulfides in case of accident must be considered. High volume changes must be compensated → high external pressure required (oxides, sulfides) / small external pressure required (polymers) |
All forms - Safety aspects of metallic lithium and H2S formation for sulfides in case of accident must be considered. High volume changes must be compensated → high external pressure required (oxides, sulfides) / small external pressure required (polymers) |
All forms - Safety aspects of metallic lithium and H2S formation for sulfides in case of accident must be considered. High volume changes must be compensated → high external pressure required (oxides, sulfides) / small external pressure required (polymers) |
| KPI LIB | Energy density: 230-300 Wh/kg, 600-750 Wh/L Price: 90-175 €/kWh |
Energy density: 250-330 Wh/kg, 650-850 Wh/L Price: 60-130 €/kWh |
Energy density: 310-350 Wh/kg, 750-950 Wh/L Price: 45-105 €/kWh |
Energy density: 320-360 Wh/kg, 800-960 Wh/L Price: 45-90 €/kWh |
| SSB Cell concepts + SSB KPI | PBE: [Li metal] / [Polymer SE] / [Polymer SC, LFP] Energy density: 240 Wh/kg, 360 Wh/L |
OBE: [Li metal] / [Oxide SE] / [Gel catholyte, NMC]
Energy density: 315 Wh/kg,
1020 Wh/L |
- | OBE: [Li metal] / [Oxide SE] / [Gel catholyte, NMC] Energy density: 350 Wh/kg, 1140 Wh/L |
| Category | Technology | Today & Short term (2025) | Medium-/long term | Vision (2035) |
|---|---|---|---|---|
| LIB | 200-300 Wh/kg, 600-750 Wh/L 90-175 €/kWh |
Continuous improvement | 320-360 Wh/kg, 800-960 Wh/L 45-90 €/kWh |
|
| Me-ion | SIB | 140-160 Wh/kg, 250-300 Wh/L 80-120 €/kWh |
Optimizing material combinations | >200 Wh/kg, >400 Wh/L <40 €/kWh |
| Me-ion | SIB - Salt | <150 Wh/kg, 10-25 Wh/L |
Increasing operating voltage and reducing costs | <200 €/kWh* |
| Me-ion | MIB | 50-150 Wh/kg, 150-300 Wh/L | Stable cathode-electrolyte combination | >300 Wh/kg, >400 Wh/L <40 €/kWh |
| Me-ion | ZIB | 30-60 Wh/kg, 40-100 Wh/L | Stability of electrodes and electrolyte | 50-120 Wh/kg, 80-200 Wh/L |
| Me-ion | AIB | 30-35 Wh/kg, 35-50 Wh/L, but 9,000 W/kg and>20,000 cycles | Highly corrosive electrolyte | 45-50 Wh/kg, 45-80 Wh/L, but 10,000 W/kg and >50,000 cycles; 10-20% cost savings compared to LIBs |
| Me-S | Li-S | > 300 Wh/kg, 300-450 Wh/L | Cycling stability and power density | 550 Wh/kg, 700 Wh/L 50 €/kWh |
| Me-S | Na-S RT | >300 Wh/kg | Multiple challenges especially on cathode and anode side | >350 Wh/kg |
| Me-S | Na-S HT | 180-268 Wh/kg, 300-414 Wh/L, long calendar and cycle lives, 300-450 €/kWh* | Cost reduction and safety improvements | 220-300 Wh/kg, 320-440 Wh/L, long calendar and cycle lives, <300 €/kWh* |
| Me-air | Li-air | <= 500 Wh/kg, but with a very low cycling stability | Safety, energy efficiency, unhealthy side reactions | theoretical: 3500 Wh/k practical: 1230 Wh/kg |
| Me-air | Zn-air | 100-200 Wh/kg, only flow design with pot. high cycling stability, 100-150 €/kWh | No stable planar cell design, low performance | 200-300 Wh/kg, 2,000-14,000 cycles 10-100 €/kWh |
| V-RFB | 22-30 Wh/kg, > 10,000 cycles, 20 years calendar life | Improved operational temperature and automated cell stacking | >35 Wh/kg, > 10,000 cycles, 20 years calendar life |
Fraunhofer Institute roadmap for alternative battery technologies into 2035 and beyond. Adapted from original report.Reference [123]
Annex 1 – Firms in the Canadian Battery Ecosystem
At time of writing, this list compiles most of the known companies in the battery processing, component, cell, pack, application, and reuse and recycling segments of the value chain.
- 14156048 Canada Inc.
- Abound Energy Inc. (formerly zinc 8)
- AdvEn Inc.
- Adventec Manufacturing
- AECON
- Agora Energy Technologies Ltd.
- AGT Electric Cars
- Alberta Lithium Battery Company
- Alstom Transport Canada Inc.
- AltaStream
- AlumaPower Corporation
- AMERESCO
- Aqua-Cell Energy Inc.
- Arianne Phosphate
- ArlanXEO
- Asahi Kasei Honda Battery Separator Corp
- Aspin Kemp and Associates Inc.
- Atlas Power Technologies Inc.
- Atura Power
- Avalon Advanced Materials
- Aypa
- BASF Canada
- Batteries Expert
- BC Research Inc. (BCRI)
- BIKTRIX
- Blue Solutions Canada Inc.
- Bobaek America
- BYD Canada
- Cadex Electronics Inc.
- Call2Recycle
- Calogy Solutions
- Calumix Technologies Inc
- Canada Fluorspar (NL) Inc.
- Canadian Electric Vehicles Ltd.
- Canadian Energy
- CanBat technologies Inc.
- Cantec Systems
- CarbonIP Technologies Inc.
- Carbonix Inc.
- Chang Chun Group
- ChemBioPower Ltd.
- Cirba Solutions
- Clear Power Solutions
- Concept GEEBEE
- Conductive Energy Inc. (formerly LiEP Energy Ltd.)
- CONVERGENT
- Corvus Energy
- Critical Elements Lithium corp.
- CSA Group
- Damon Motors
- Destrier Electric
- Discover Battery
- E3 Lithium Corp.
- East Penn Canada
- eCAMION Inc
- Eclipse Automation
- EcoPro
- Eecomobility Inc.
- Eguana Technologies
- Electra Battery Materials Corp.
- Electrovaya
- EMP Metals
- Eneon ES
- Energy Plug Technologies
- enfinite
- Enlighten Innovations, Inc.
- E-One Moli Energy Ltd
- Epiroc (formerly FVT research Inc.)
- e-Storage Solutions
- Everwin Mobility
- EVLO
- Evolugen
- EVSX
- EVT Batteries
- Excell Battery
- Exro Technologies
- Eyelit
- e-Zinc Inc.
- Fenix Advanced Materials
- First Phosphate Corp.
- Flex-Ion Battery Innovation Centre, a division of Ventra Group Co.
- FLUENCE
- Focus Graphite
- Ford Motor Company
- Foreseeson Technology Inc.
- Fortune Minerals Limited
- Frontier Lithium
- G6 Energy Corp
- GBatteries Energy Canada Inc.
- General Motors (GM)
- GENOPTIC LED INC.
- Glencore
- Graphene Leaders Canada (GLC) Inc.
- Green Graphite Technologies
- Green Technology Metals
- GreenBattery
- Greenlight Innovation Corporation
- GREENWOOD SUSTAINABLE INFRASTRUCTURE
- Grengine Inc.
- H55 Canada
- Hartford Energy Solutions
- Hatch Ltd.
- Hexagon Purus
- Highwood Asset Management
- Honda
- Honda Posco Future M Co., LTD.
- HPQ Silicium Inc.
- Hutchinson Aéronautique et Industrie Ltée
- Hybrid Power Solutions Inc.
- Ignis Lithium
- Invinity Energy Systems (Canada) Corporation
- Kargo
- KFN Oil & Gas Co Ltd
- KSW DAHE International LTD
- Largo
- Letenda
- Levando Technologies Inc.
- Li-Cycle Corp.
- Li-Metal Corp.
- LION Electric
- Litens Automotive Group
- Lithion Recycling
- Lithium Universe
- LithiumBank Resources
- Litus Inc.
- Magnacharge
- MakeSens Inc.
- Malahat Centre of Excellence
- Manganese X Energy Corp.
- Mangrove Lithium
- Maplesoft
- Mason Resources
- Mazlite Inc.
- MEDATech Engineering Services Limited
- Metals Australia Ltd.
- Micro Bird
- Microgreen Energy
- Moment Energy Inc.
- Momentum Materials Solution
- Motor Coach Industries Ltd
- Motrec International Inc.
- Nano One Materials Corp.
- Nanode Battery Technologies
- Nanorial Technologies Ltd.
- NanoXplore Inc.
- Narval Energy
- Nautchiuk Environmental Inc.
- NEO Battery Materials Ltd.
- Neoen
- Neolithica
- Net Zero Metals
- New Flyer Industries
- New Nemaska Lithium
- NextStar Energy (Stellantis - LG Energy Solution JV)
- NiCAT Battery Technologies Inc.
- Northern Graphite Corp.
- Northland Power
- Northvolt
- Nouveau Monde Graphite
- Nova Bus/Volvo
- NOVONIX
- NRStor
- Nuvation Energy
- Nuvolt Energy Inc.
- Nuvvon
- Peregrine Energy Solutions LLC
- Pliant Power Devices Inc.
- Plus Power LLC
- Polar performance material
- Portable Electric Ltd.
- Potentia Renewables Inc.
- PowerCo (VW)
- Powin Energy Corporation
- Prairie Lithium Corporation
- Primobius Stelco Partnership
- Pulsenics
- Radiance Energy Corporation
- Rainhouse Energy Ltd.
- Recion Technologies Inc.,
- RecycLiCo Battery Materials Inc.
- Resonetics
- Rio Tinto Fer et Titane
- Rock Tech Lithium
- Salient Energy Inc.
- Sherritt International
- Shift Clean Solutions Ltd.
- Siemens
- Ski-Doo (Bombardier Recreational Products)
- Solid Ultrabattery
- Solus Advanced Materials
- Starz Energies Canada Inc.
- Stromcore
- Stryten Energy
- Sudano Consulting Inc.
- Summit NanoTech Corp
- Superionics
- Surrette Battery Company Ltd
- SysNergie Inc
- Taiga Motors
- Taranis Energy
- Tekna
- Teric Power
- Tesla Motors Canada ULC
- Toda Advanced Materials
- Transalta
- Trion Battery
- Troes Corp
- UgoWork
- Ultium CAM JV
- Umicore Canada
- VAH Power (Canada) Inc.
- Vale Canada Limited
- Vanadium Corp
- Vecture Inc.
- Veolia North America
- Volinergy Technologies Inc.
- Volt Carbon
- Volta Energy Solutions
- Voltari Marine Electric
- Volterra Battery Manufacturing
- VRB Energy
- Zen Electric Bikes
- Zen Energy Inc.
- Zentek Ltd.