
Table of Contents
Download the State of Canada's Forests:
Annual Report 2025 (PDF, 5.46 MB)
Details
- Publication date:
February 5, 2026 - Author(s):
Natural Resources Canada - ISSN:
1196-1589 (Print)
1488-273651 (Online) - Cat. No.:
Fo1-6E (Print)
Fo1-6E-PDF (Online)
- Message from the Minister of Energy and Natural Resources
- Canada’s forests: Sustainably managed, backed by trusted data and transparent reporting
- National, provincial, and territorial forest-related statistical data
- How much forest does Canada have?
- How are Canada’s forests harvested sustainably?
- Indicator: forest area harvested
- Indicator: forest regeneration
- Indicator: volume harvested relative to the sustainable wood supply
- How does disturbance shape Canada’s forests?
- New forest mapping for better fire behaviour prediction
- How do forests benefit Canadians?
- Indicator: forest sector employment
- Indicator: forest sector average earnings
- Indicator: forest communities
- How does the forest sector contribute to the economy?
- Indicator: forest sector gross domestic product
- Indicator: production of forest products
- Indicator: exports of forest products
- How is the forest sector changing?
- Indicator: forest sector financial performance
- Indicator: forest sector secondary manufacturing
- Indicator: forest sector fossil carbon emissions
- Key facts and figures
Message from the Minister of Energy and Natural Resources
Canada’s forests are more than a natural resource — from coast to coast to coast, they are a cornerstone of local and regional economies, a crucial part of our identity and an ally in building a more sustainable nation.
Canada continues to be a global leader in forest stewardship, guided by science and Indigenous knowledge. We are proud to support Indigenous leadership and participation in forest governance, recognizing that reconciliation and sustainability go hand in hand.
In the face of ongoing trade disputes, particularly around softwood lumber, our government remains steadfast in defending Canada’s forest sector and protecting the livelihoods of the thousands of Canadians who depend on it as we work to retool our industry to focus on more reliable markets — including our own.
Natural Resources Canada (NRCan) is making investments in forest sector transformation to unlock new opportunities for advanced wood construction, clean technologies and value-added products. Through initiatives like Canada’s Global Forest Leadership Program, the Investments in Forest Industry Transformation program, the Indigenous Forestry Initiative and the Green Construction through Wood program, we are helping Canadian companies adapt, compete, find new international markets and create and sustain jobs at home. Other initiatives like Build Canada Homes, the Buy Canadian Policy and investments in industry resilience and transformation are supporting Canadian lumber and related products that ensure we can act as our own best customer, building Canadian projects with Canadian wood.
As wildfires become more frequent and devastating, NRCan is also investing in specialized firefighting equipment; training wildland firefighters; strengthening community-based prevention and mitigation efforts; including Indigenous wildfire stewardship; and supporting the first government-owned satellite mission dedicated to monitoring wildfires. As the 2025 G7 President, Canada also led the creation of the Kananaskis Wildfire Charter to drive international coordination on wildfires. Together, with investments in research and innovation, these actions will protect forests and communities in Canada and around the world.
Our approach is about not only supporting the forest sector and communities facing wildfire risk in the short term but also about building a sector as resilient and enduring as our forests themselves. A sector that supports Indigenous leadership, strong rural economies and Canadians for decades to come, as it has for decades past. As we look ahead, our forests and forest sector will play a central role in our push for diversified trade markets, our affordable housing ambitions and the fight against climate change. Achieving these outcomes depends on timely, credible forest information to understand trends, assess risks and track progress across Canada’s forests and forest sector — work to which NRCan is wholly committed.
Our forest sector will play an instrumental role in building a sustainable, sovereign Canada as we work to become an energy and natural resources superpower. Together with provinces, territories, Indigenous partners and industry — we will protect and grow this vital sector for generations to come.
The Honourable Tim Hodgson
Minister of Energy and Natural Resources
Canada’s forests: Sustainably managed, backed by trusted data and transparent reporting
Canada’s forests provide vital environmental, cultural, and economic benefits. Through sustainable forest management (SFM) laws and regulations, Canada aims to preserve these benefits for future generations.
For more than 35 years, The State of Canada’s Forests: Annual Report has been a reliable source of data on the health of our forests and the forest sector. It features science-based sustainability indicators that:
- track forest conditions and trends
- inform policy and management improvements
- support environmental and trade discussions
These indicators are built on data from trusted sources like Statistics Canada,1 the National Forestry Database,2 and the National Forest Inventory.3 Leading experts analyze this data to provide clear, evidence-based insights.
Aligned with global standards
Canada is a founding member of the Montréal Process, a global initiative using shared indicators to measure SFM across 90% of the world’s temperate and boreal forests. The indicators presented in this report and those available on the Forest Statistical Data website are inspired by and seek to align with this evolving and internationally relevant framework.
Supporting global sustainability goals
Canada’s forest reporting also contributes to the United Nations’ 2030 Agenda, including:
- Sustainable Development Goal 15:
Life on Land - Global forest goals:
- Reverse forest cover loss
- Improve forest benefits and livelihoods
- Protect forests and use sustainable forest products
- Mobilize resources for forest sustainability
This year’s report presents a more data-focused structure and format, with emphasis on indicators and key data. The design has also been updated with a web-first approach to improve digital accessibility and enhance the user experience. This new format enables us to release content throughout the year, offering more timely updates on topics of interest. To stay informed, sign up to receive notifications as new content becomes available.
Forest statistical data
Current statistics on various forestry-related topics including forest inventory, natural disturbances, sustainable forest management, carbon inventory as well as economic and trade data for Canada, both nationally and by province and territory.
How much forest does Canada have?
Canada is home to 369 million hectares (ha) of forest.4 This forest is more than 90% publicly owned, makes up 24% of the world’s boreal forest and 9% of the world's total forest, and results in a per-capita forest area of more than 9 ha per person.5 Canadians depend on and value these forests for many different uses including recreation, conservation, Indigenous cultural and livelihood practices, and economic livelihoods. Canada’s National Deforestation Monitoring System reports that less than 0.5% of Canada’s forest has been deforested over the last 35 years.6
Text version
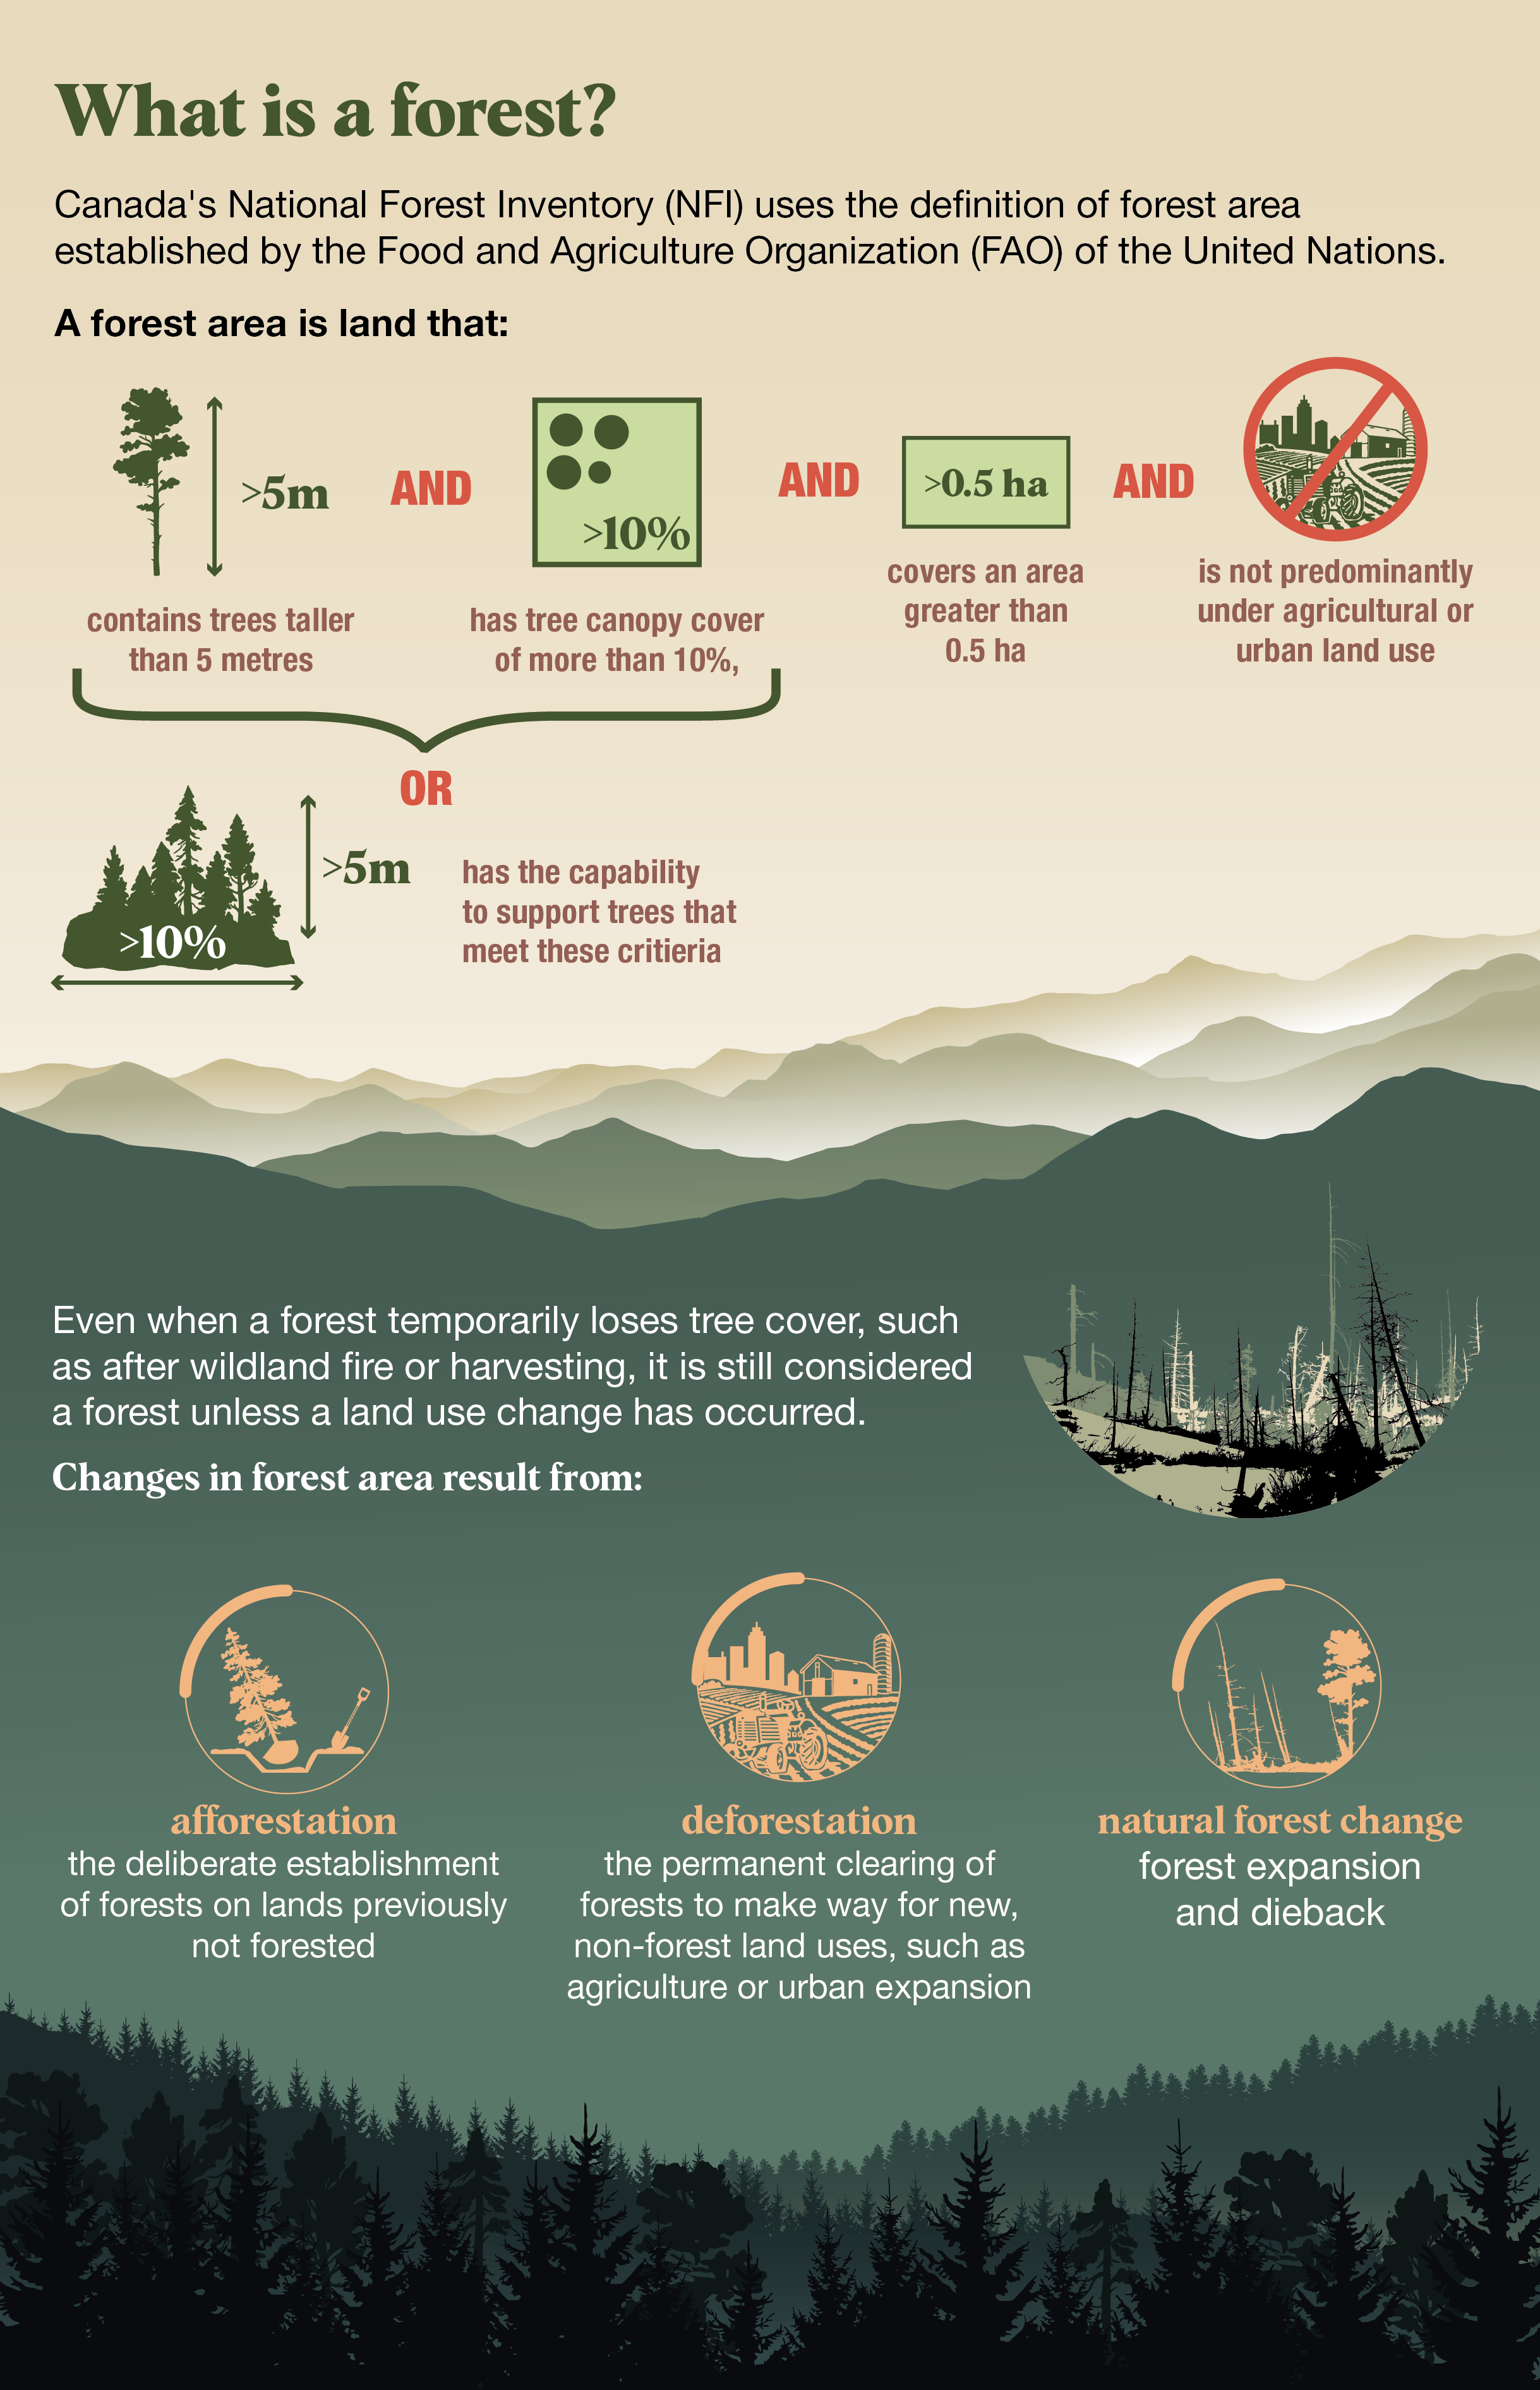
Infographic titled “What is a forest?” It explains Canada’s National Forest Inventory definition of a forest:
- Land with trees taller than 5 meters, canopy cover over 10%, area larger than 0.5 hectares, and not mainly used for agriculture or urban purposes.
- Land that can support trees meeting these criteria also counts as forest.
- Forests remain classified even if tree cover is temporarily lost, unless land use changes.
Bottom section shows three causes of forest area change:
- Afforestation – creating forests on previously non-forested land.
- Deforestation – clearing forests for agriculture or urban expansion.
- Natural forest change – forest expansion or dieback.
Background includes stylized forest and mountain imagery.
How do we monitor the change in our forests?
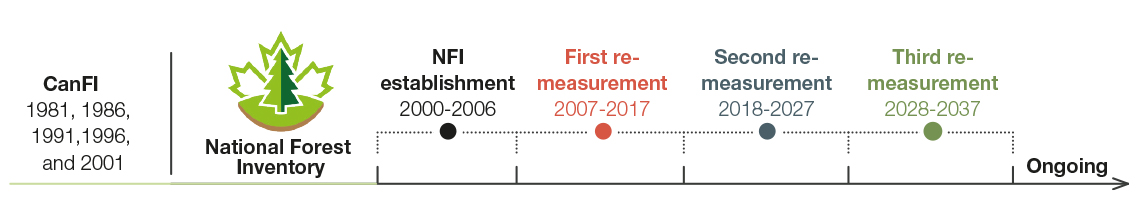
The Canadian Forest Service (CFS) works with provincial and territorial partners to maintain Canada’s forest monitoring and reporting capabilities via the NFI, National Forest Information System, National Forestry Database, and National Forest Carbon Monitoring, Accounting, and Reporting System. Remote sensing also plays a crucial role by enabling increasingly more detailed forest monitoring over large areas. Canada’s NFI is 25 years old and is currently in its second remeasurement period.8
Canada’s National Forest Inventory measurement periods9
Text version
Canada’s National Forest Inventory measurement periods
CanFI (1981, 1986, 1991, 1996 and 2001)
NFI establishment (2000-2006)
First re-measurement (2007-2017)
Second re-measurement (2018-2027)
Third re-measurement (2028-2037)
Ongoing
Canada’s NFI was created to ensure our forest monitoring uses a statistically robust sampling approach by using a national plot network with consistent methodology.8 This replaces older monitoring methods such as the Canadian Forest Inventory, which relied on data submissions from various sources and did not include large areas of northern forests.
What value does forest-monitoring data provide?
CFS, provincial and territorial partners, government, academia, and the private industry all use NFI data for various purposes. The data can help with environmental stewardship, wildlife studies, and policy decisions.
Forest ecosystem diversity: A key indicator of forest health
Forest ecosystem diversity is a key indicator of forest health. One of the ways Canada monitors forest biodiversity is by assessing forest ecosystem type and age over time, as a measure of habitat availability. The graph shows Canada's average annual change by forest type and age class from 2006 through 2017.9 In total, there has been a slight decrease in mixedwood forest area that has been offset by larger increases in broadleaf (hardwood) and conifer (softwood) forest areas. The highest bars show how the most widespread forests in Canada—conifer forests in the age class of 81 to 120 years—have grown older during the monitoring period. The increase in old conifer forests area (≥ 201 y) mostly reflects an improvement in the quality of monitoring data. The higher-resolution data accessible to experts now, especially across northern Canada, make it easier to estimate stand age and identify the oldest stands on the landscape.
Average annual change by forest type and age class in Canada, 2006–201710

Graph summary
Average annual change in forest area broken down by forest type and age class in Canada, from 2006 to 2017.
| Age class | 0–40 | 41–80 | 81–120 | 121–160 | 161–200 | 201+ | Total |
|---|---|---|---|---|---|---|---|
| Broadleaf forest | 197.61 | -166.50 | 268.41 | 25.77 | -0.05 | 2.50 | 324.97 |
| Mixedwood forest | -45.85 | -276.60 | -247.95 | 149.54 | 1.48 | 11.22 | -420.12 |
| Coniferous forest | 410.30 | 315.12 | -3091.1 | 2916.38 | 38.03 | 1476.37 | 689.09 |
Sources and information
- Standards, data sources and methods. Statistics Canada; updated 2025 Jul 28. https://www.statcan.gc.ca/en/concepts/index
- Collaborators. National Forestry Database; updated 2025 Oct 30. http://nfdp.ccfm.org/en/collaborators.php
- Collaborators. National Forest Inventory; accessed 2025 Aug 8. https://nfi.nfis.org/en/collaborators
- National Forest Inventory. Area (1000 ha) of forest and non-forest land in Canada; Standard reports—T1, version 3.0. Natural Resources Canada; updated 2023 Nov.
- Quick facts. Canada’s National Forest Inventory; accessed 2025 Jul 31. https://nfi.nfis.org/en/quickfacts (See Note a)
- Dyk A, Leckie D, Tinis S, Ortlepp S. Canada’s national deforestation monitoring system: system description. Natural Resources Canada, Canadian Forest Service, Pacific Forestry Centre; 2015. Information Report BC-X-439. https://ostrnrcan-dostrncan.canada.ca/entities/publication/88faa5dd-47c7-40a7-907d-c719ff166dfb (See Note b)
- Forest resources assessment 2025: terms and definitions. Food and Agriculture Organization of the United Nations; 2023 [accessed 2025 Jul 31]. https://www.fao.org/3/cc4691en/cc4691en.pdf (See Note c)
- Canada’s National Forest Inventory business process, version 8.0. National Forest Inventory; 2021 [accessed 2025 Jul 31]. https://nfi.nfis.org/resources/general/NFI-Business-Process-Version-8.0.pdf (See Note d)
- History: forest inventory in Canada. National Forest Inventory; accessed 2025 Jul 31. https://nfi.nfis.org/en/history (See Note e)
- National Forest Inventory. Area (1000 ha) of forest land by forest type and age class in Canada; Standard reports—T1, version 3.0. Natural Resources Canada; updated 2023 Nov.
Notes
- This page provides “quick fact” information, which is monitored or estimated by the NFI.
- National deforestation estimates are calculated on a periodic basis using the method described in this source. Annual deforestation data provided by Canada’s National Deforestation Monitoring System, special tabulation, to NFI on April 30, 2025.
- This document provides definitions of forest, afforestation, and other key terms. Note that Canada uses this definition of forest for most purposes, although certain specific situations may justify adaptations. National greenhouse gas inventory and forest carbon accounting uses a slightly different definition of forest and deforestation.
- Description of the procedure and means by which NFI data are collected, validated, stored, used, and disseminated.
- This page provides a brief history on the programs that preceded the NFI, explains why the NFI was created, as well as Canada’s NFI periods.
Indicator: forest area
Many Canadians are aware of recent wildland fires, forest pest outbreaks, and discussions around harvest levels. How do these affect forest area? Although these 3 examples may affect tree cover and other forest conditions, they only affect forest area when the forest cover losses are not followed by reforestation or natural regeneration. Forest area loss occurs due to permanent events like deforestation or natural forest regeneration failure.
Canada has 369 million hectares (ha) of forest area1 with many unique forest types. Intuitively, many Canadians may see fires, timber harvesting, or development near their communities and assume forest area is decreasing. However, much of Canada’s forest is remote and multiple sources of monitoring, like the National Forest Inventory (NFI)1 and satellite-based remote sensing,2 show that forest and treed areas have increased slightly since 2000.
Compared with total forest area, the area affected by afforestation and deforestation in Canada is small. Canada’s forests have seen less than 0.5% deforestation since 1990.3 The deforestation that occurs is mainly from agriculture; mining, oil, gas; and urban development. There is less recorded afforestation than deforestation in Canada.
- Canada uses the definition of forest area that was established by the Food and Agricultural Organization of the United Nations to foster consistency across countries when reporting this important forest attribute.4
- Although forest area in Canada is relatively stable, forest tree cover is more dynamic due to forest fires, insect infestations, harvest activities, and regrowth, which cause tree cover to fluctuate over large areas.
Canada’s estimated forest area, 1990–20241
Graph summary
Canada’s estimated forest area trends from 1990 to 2024.
| Year | Forest area (million hectares) |
|---|---|
| 1990 | 360,762 |
| 1991 | 360,707 |
| 1992 | 360,657 |
| 1993 | 360,580 |
| 1994 | 360,540 |
| 1995 | 360,505 |
| 1996 | 360,468 |
| 1997 | 360,431 |
| 1998 | 360,390 |
| 1999 | 360,344 |
| 2000 | 360,305 |
| 2001 | 360,818 |
| 2002 | 361,330 |
| 2003 | 361,843 |
| 2004 | 362,355 |
| 2005 | 362,868 |
| 2006 | 363,381 |
| 2007 | 363,893 |
| 2008 | 364,406 |
| 2009 | 364,918 |
| 2010 | 365,431 |
| 2011 | 365,944 |
| 2012 | 366,456 |
| 2013 | 366,969 |
| 2014 | 367,482 |
| 2015 | 367,994 |
| 2016 | 368,507 |
| 2017 | 369,019 |
| 2018 | 368,968 |
| 2019 | 368,918 |
| 2020 | 368,869 |
| 2021 | 368,818 |
| 2022 | 368,768 |
| 2023 | 368,720 |
| 2024 | 368,672 |
What is causing an upward trend in forest area?
According to NFI, the forest area increased by 512,000 ha/y (0.14%/y) between the baseline measurement (2000–2006) and the first remeasurement (2007–2017).1 The Canadian Forest Service has conducted initial research into why forest area increase is occurring. Although data collection and research are ongoing, it appears that the change can be attributed to the following factors:
- Natural expansion: e.g., when a forest expands into a previously unforested area, often due to a change in growing conditions
- Administrative land-use: e.g., land-use changing from agricultural to forest
- Afforestation: e.g., humans planting trees in previously unforested areas
- Deforestation: e.g., humans converting forested area to non-forest land-use
- Technology advances: e.g., higher resolution satellite data able to better distinguish between marginal forest vegetation (small or scattered trees) and non-forest vegetation such as shrubs
- Multiple or unattributed causes: a combination of various factors or cause still to be determined
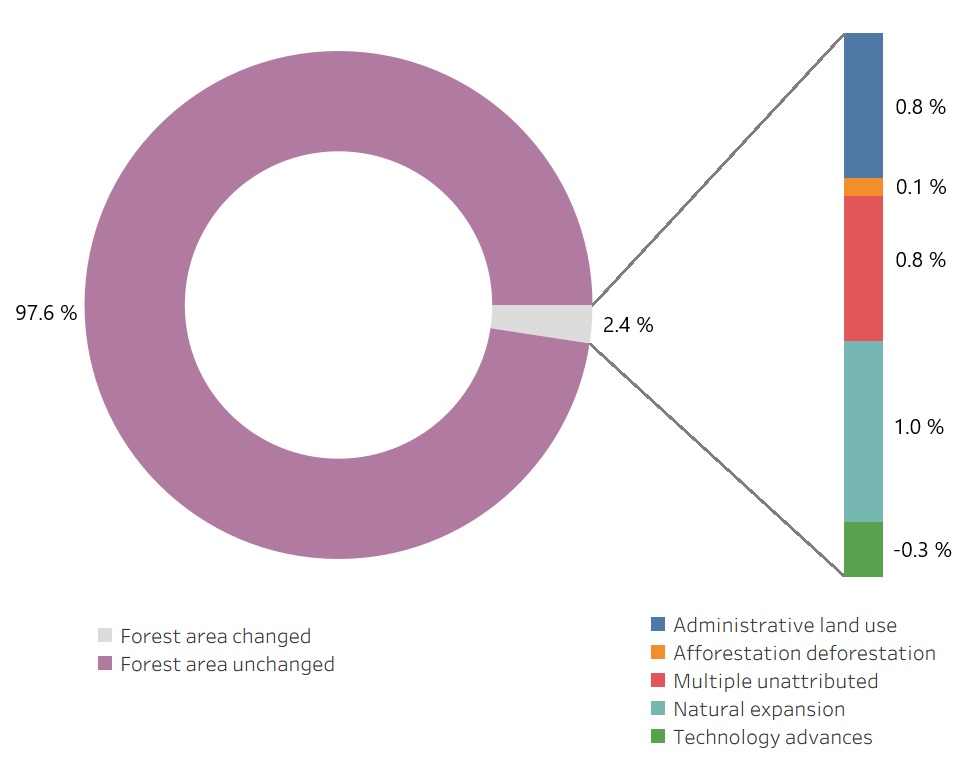
The following figure displays the increase in forest area compared with Canada’s total forest area that has occurred between baseline and the first remeasurement. The pie chart represents Canada’s total forest area, the grey sliver on the pie chart represents the forest area increase, and the bar chart represents the causes of forest area change broken down by the categories discussed above.
Current sources of forest area change in Canada (2006—2017)5
Graph summary
Proportion of forest area changed vs. unchanged, with breakdown of sources of forest area change in Canada from 2006 to 2017.
| Forest area | 97.6% |
|---|---|
| Natural expansion | 1.0% |
| Multiple / unattributed | 0.8% |
| Administrative land-use | 0.8% |
| Afforestation / deforestation | 0.1% |
| Technology advances | -0.3% |
Why is this indicator important?
- Understanding changes in total forest area in Canada is an important part of monitoring sustainable forest management. Healthy and functioning forest area provides habitat for biodiversity and many important ecosystem goods and services.
- The international community continues to put great emphasis on understanding global forest area changes. Although Canada’s forest area has been relatively stable in recent history, it remains important to monitor the effects of human activities and climate change.
What is the outlook?
- Climate change may cause a reduction in forest areas that are becoming too dry to support trees while also causing forests to expand into areas that previously did not support trees.
- Forest area is expected to remain generally stable. Rates of human-induced change are likely to remain low (for more information, see Indicator: deforestation and afforestation).
Sources and information
- National Forest Inventory. Table 4.0. Area (1000 ha) of forest and non-forest land in Canada; Standard reports—T1, version 3.0. Natural Resources Canada; updated 2023 Nov. (See Note a)
- Hermosilla T, Wulder MA et al. Expansion of treed area over Canada’s forested ecosystems: spatial and temporal trends. Forestry. 2025; cpaf015. https://doi.org/10.1093/forestry/cpaf015
- Dyk A, Leckie D, Tinis S, Ortlepp S. Canada’s national deforestation monitoring system: system description. Natural Resources Canada, Canadian Forest Service, Pacific Forestry Centre; 2015. Information Report BC-X-439. http://cfs.nrcan.gc.ca/publications?id=36042 (See Note b)
- Forest resources assessment 2025: terms and definitions. Food and Agriculture Organization of the United Nations; 2023 [accessed 2025 Jul 31]. https://www.fao.org/3/cc4691en/cc4691en.pdf (See Note c)
- Preliminary attribution of forest area, volume, and primary forest estimates through the National Forest Inventory baseline (2000–2006) and first remeasurement (2007–2017); version 1.0. National Forest Inventory; 2025. July 2025 PDF
- Gillis MD. Estimating change from successive static forest inventories. The Forestry Chronicle. 1988;64(4):352–354. https://doi.org/10.5558/tfc64352-4 (See Note d)
Notes
- Remeasurement (2017) estimate of Canada’s forest area. This is the source used to derive a forest area value of 369 million hectares and the average annual change in forest area from 2000 to 2017.
- National deforestation estimates are calculated on a periodic basis using the method described in this source. Annual deforestation data provided by Canada’s National Deforestation Monitoring System, special tabulation, to the NFI on April 30, 2025.
- This document provides definitions of forest, afforestation, and other key terms. Note that Canada uses this definition of forest for most purposes, although certain specific situations may justify adaptations. National greenhouse gas inventory and forest carbon accounting uses a slightly different definition of forest and deforestation.
- This paper describes the practice of using multiple measurements of a static forest inventory (specific points in time) to measure the change in forest attributes over time. It discusses how the observed change can be “real” or “artificial,” and that caution must be taken to understand what is causing the change before reporting on it.
Additional information
Forest area trend reporting method
We can more accurately estimate forest area in Canada because NFI has gathered enough data over time to estimate forest changes (for more details, see How much forest does Canada have?). Previously the NFI only provided a forest area estimate for 2006. Trend reporting was done by adding known afforestation and removing deforestation from this value for each year in the time series. The afforestation and deforestation values were from programs that were not specifically designed for NFI use.
Nowadays NFI calculates forest area using a hybrid method. It includes a 2017 report and has average annual change values for the 2000–2017 period. For more information, see the Gillis (1988)6 paper. For reporting, we use NFI report values for 2006 and 2017 and the annual change estimate is used to calculate values for the 2000–2017 period. The change estimate values are not meant to predict forest area values outside the measurement period, so from 1990 through 1999 and 2018 onwards, known afforestation and deforestation are added and removed from the 2000 and 2017 values, respectively.
- Equation 1:
F2020 = F2017 − (D2017 + D2018 + D2019) + (A2017 + A2018 + A2019)
- Equation 2:
F1990 = F2000 + (D1999 + D1998 + D1997 + D1996 + D1995 + D1994 + D1993 + D1992 + D1991 + D1990) −
(A1999 + A1998 + A1997 + A1996 + A1995 + A1994 + A1993 + A1992 + A1991 + A1990)
F indicates forest area; D, deforestation; A, afforestation.
NFI can state with statistical confidence that Canada’s forest area has increased from 2000 through 2017. From 2018 onwards, the deforestation and afforestation approach shows minor decreases in forest area with 369 million ha reported for 2023. Once the second remeasurement period is complete in 2027, NFI will have a third forest area point value and will be able to calculate statistical change estimates for the 2018–2027 period.
Indicator: deforestation and afforestation
Canada’s annual deforestation rate has slightly decreased over the last 30 years.1 In 2023, 49,250 hectares (ha) of forest land were converted to non-forest land compared with 64,000 ha in 1990.
- Canada has 9% of the world’s forest3,4 but is responsible for only 0.37% of global deforestation that has occurred since 1990.
- The main drivers of deforestation5 in Canada continue to be agricultural expansion, oil and gas developments, and mining.
- The development of hydroelectric reservoirs causes noticeable spikes in annual deforestation due to the flooding of forests, as seen in 1993 and 2006.
- Deforestation in the forestry category arises from new permanent forestry roads and other persistent clearings such as landings.
- The annual area of afforestation is significantly smaller than the annual area of deforestation, which itself is significantly smaller than the total area of Canada’s forests.
Estimated area of annual deforestation by industrial sector in Canada, 1990–20231-2

Graph summary
Comparison of the annual estimated area of deforestation in Canada from 1990 to 2023, by industrial sectors of:
- Agriculture
- Forestry
- Mining, oil and gas
- Built-up
- Hydroelectric
| Year | Agriculture | Forestry | Mining, oil & gas | Built-up | Hydroelectric |
|---|---|---|---|---|---|
| 1990 | 42,107 | 3,682 | 7,282 | 7,472 | 3,598 |
| 1991 | 38,142 | 3,600 | 7,254 | 7,298 | 6,402 |
| 1992 | 34,177 | 3,517 | 7,855 | 7,199 | 5,400 |
| 1993 | 30,217 | 3,435 | 7,952 | 7,126 | 37,323 |
| 1994 | 26,252 | 3,352 | 8,054 | 7,057 | 2,374 |
| 1995 | 22,289 | 3,270 | 8,163 | 7,028 | 1,493 |
| 1996 | 21,941 | 3,334 | 8,806 | 7,518 | 1,695 |
| 1997 | 21,597 | 3,398 | 9,146 | 7,513 | 2,014 |
| 1998 | 21,249 | 3,463 | 10,584 | 7,743 | 4,597 |
| 1999 | 20,893 | 3,527 | 11,175 | 8,354 | 6,646 |
| 2000 | 20,544 | 3,591 | 10,961 | 8,804 | 883 |
| 2001 | 20,196 | 3,655 | 10,740 | 9,104 | 882 |
| 2002 | 19,849 | 3,720 | 13,390 | 8,639 | 9,746 |
| 2003 | 19,502 | 3,784 | 13,577 | 8,951 | 3,061 |
| 2004 | 19,154 | 3,848 | 14,060 | 9,396 | 4,073 |
| 2005 | 17,982 | 3,452 | 14,758 | 8,946 | 4,035 |
| 2006 | 16,842 | 3,058 | 17,394 | 9,022 | 29,479 |
| 2007 | 15,703 | 2,666 | 17,482 | 8,657 | 3,719 |
| 2008 | 14,563 | 2,272 | 16,528 | 8,271 | 6,810 |
| 2009 | 13,422 | 1,879 | 14,037 | 8,313 | 5,072 |
| 2010 | 12,284 | 1,485 | 14,397 | 8,029 | 5,112 |
| 2011 | 14,319 | 1,540 | 15,919 | 8,231 | 2,937 |
| 2012 | 16,353 | 1,415 | 14,851 | 8,431 | 3,700 |
| 2013 | 18,390 | 1,289 | 15,444 | 9,105 | 10,776 |
| 2014 | 20,426 | 1,162 | 14,897 | 9,490 | 12,292 |
| 2015 | 22,460 | 1,032 | 15,175 | 10,025 | 8,566 |
| 2016 | 22,460 | 1,032 | 15,356 | 9,990 | 8,465 |
| 2017 | 22,460 | 1,032 | 15,184 | 9,762 | 4,175 |
| 2018 | 22,460 | 1,032 | 15,140 | 9,599 | 1,732 |
| 2019 | 22,460 | 1,032 | 14,861 | 9,579 | 2,855 |
| 2020 | 22,460 | 1,032 | 14,848 | 9,554 | 2,661 |
| 2021 | 22,460 | 1,032 | 14,760 | 9,538 | 2,733 |
| 2022 | 22,460 | 1,032 | 14,757 | 9,538 | 1,462 |
| 2023 | 22,460 | 1,032 | 14,757 | 9,538 | 1,462 |
Why is this indicator important?
- Forest loss affects biodiversity, soil, air and water quality, and the availability of wildlife habitat. Forests also store more carbon than other terrestrial ecosystems and can be managed to mitigate climate change (e.g., by increasing the area of forest through afforestation or by avoiding deforestation).
What is the outlook?
- The deforestation rate in Canada is expected to remain steady at its current levels.
- Ongoing and planned initiatives for planting trees will increase the afforested land area in coming years and increase tree cover in urban and rural agricultural lands. Tree planting contributes to ecosystem services such as restoring habitat and carbon sequestration.
- The federal government’s 2 Billion Trees Program7, launched in 2021, is being wound down under Budget 2025. While the original goal of planting two billion trees by 2031 has been cancelled, existing agreements covering nearly one billion trees will be honoured through 2031.
Sources and information
- National Inventory Report 1990–2023: Greenhouse gas sources and sinks in Canada. Environment and Climate Change Canada; 2025 [accessed 2025 May 6]. https://publications.gc.ca/collections/collection_2025/eccc/En81-4-2023-1-eng.pdf (See Note a)
- Dyk A, Leckie D, Tinis S, Ortlepp S. Canada’s national deforestation monitoring system: system description. Natural Resources Canada, Canadian Forest Service, Pacific Forestry Centre; 2015. Information Report BC-X-439. http://cfs.nrcan.gc.ca/publications?id=36042 (See Note b)
- Global Forest Resources Assessments. Food and Agriculture Organization of the United Nations; accessed 2025 Sept 15. https://www.fao.org/forest-resources-assessment/past-assessments/fra-2015/en
- National Forest Inventory. Table 4.0. Area (1000 ha) of forest and non-forest land in Canada; Standard reports—T1, version 3.0. Natural Resources Canada; updated 2023 Nov.
- Point estimate for 2017: https://nfi.nfis.org/resources/general/summaries/t1/en/CA/html/ca_t4_for_area_en.html
- United Nations Framework Convention on Climate Change. Report on the conference of the parties on its seventh session, held at Marrakesh from October 29 to November 10, 2001; Addendum, part 2: Action taken by the conference of the parties. FCCC/CP/2001/13/Add.1. Bonn, Germany. https://unfccc.int/resource/docs/cop7/13a01.pdf (See Notes c–j)
- Canada’s deforestation monitoring story map. Canadian Forest Service; accessed 2025 May 6. https://ca.nfis.org/ndms/ndms_overview_eng.html
- 2 Billion Trees Program. Government of Canada; accessed 2025 May 6. https://natural-resources.canada.ca/forest-forestry/2-billion-trees-program
Notes
- Data and analysis in this report on greenhouse gas sources caused by deforestation were from Natural Resources Canada’s Canadian Forest Service’s National Forest Carbon Monitoring, Accounting, and Reporting System (NFCMARS), which uses data from Canada’s National Deforestation Monitoring System (NDMS).
- National deforestation estimates are calculated on a periodic basis using the method described in this source. Figure data provided by Canada’s NDMS, special tabulation, to the National Forest Inventory on April 25, 2024.
- Both the NDMS and the NFCMARS define forestas a minimum land area of 1 hectare (ha) with tree crown cover of more than 25%, and with trees having the potential to reach a minimum height of 5 metres at maturity in situ. This definition harmonizes with the definitions found in the Marrakesh Accords of the United Nations Framework Convention on Climate Change but is slightly different from the Food and Agriculture Organization of the United Nations’ definition used elsewhere in this report.
- Deforestation is the conversion of forest to non-forest land uses. Consistent with international definitions, deforestation does not include harvest followed by forest regrowth.
- Data have been updated with new mapping of hydroelectric reservoirs.
- Deforestation by the forestry sector includes the creation of new permanent forestry access roads and landings.
- Deforestation by the hydroelectric sector includes new hydroline right-of-ways and reservoir flooding.
- Deforestation by the built-up sector includes industrial, institutional, or commercial developments, as well as municipal urban development, recreation (ski hills and golf courses), and transportation.
- Deforestation by the mining, oil, and gas sector includes mine development for minerals and peat, as well as oil and gas developments.
- Afforestation is the conversion of non-forest land to forest through the planting or seeding of trees.
Indicator : wood volume
Across the wide expanse of Canadian forests, there are an estimated 49 billion cubic metres of wood volume.1 Canadian provinces and territories and the Canadian Forest Service contribute data on wood volume to the National Forest Inventory (NFI), allowing regional and national summaries and insights into this important forest attribute:
- Species differ significantly across Canada. For example, in the boreal forest, the most extensive forest region in Canada, spruce and poplar make up 79% of the total tree volume.2
- The age class distribution of volume—the distribution of the tree volume across different age classes—also varies widely across Canada. One reason for this is that certain forest regions, like the boreal forest, are more prone to disturbance events (e.g., fire and pests) than others such as coastal forests regions. This leads to variation in average age of wood volume across regions.3
Distribution of wood volume by age class for dominant coniferous and broadleaf species of the boreal forest in Canada, 20172

Graph summary
Distribution of live standing timber volume by age class for the dominant coniferous and broadleaf species of the boreal forest in Canada in 2017.
| Age class | Proportion of poplar wood volume(%) | Proportion of spruce wood volume(%) |
|---|---|---|
| 0–20 | 2.95 | 0.37 |
| 21 –40 | 6.86 | 3.04 |
| 41–60 | 12.38 | 6.88 |
| 61–80 | 29.94 | 12.74 |
| 81–100 | 26.99 | 14.98 |
| 101–120 | 12.31 | 30.24 |
| 121 –140 | 6.04 | 21.03 |
| 141 –160 | 1.99 | 6.74 |
| 161 –180 | 0.32 | 1.81 |
| 181 –200 | 0.11 | 0.40 |
| 201+ | 0.11 | 1.77 |
Why is this indicator important?
Having a thorough understanding of how wood volume is distributed throughout the forest land base contributes to sound policy and decision-making. Canadian planners and policy analysts depend on understanding wood volume for:
- Sustainable forest management: Provinces and territories set the Allowable Annual Cut (AAC) for their jurisdictions. The AAC states how much volume can be harvested in each area and what types of species, age, and tree health status that volume must come from.
- Forest carbon management: The amount of carbon a forest can store depends on many factors, including its wood volume. Generally, young forests with less volume store less carbon than older forests with more volume (see Indicator: greenhouse gas fluxes).
How are forest volume estimates improving?
Prior to 2024, State of Canada’s Forests: Annual Reports used the best available data on wood volume at a single time point and adjusted past and future years with auxiliary data. Continued investments and NFI enhancement now allows Canada to report wood volume trends based on statistically robust repeat pan-Canadian forest measurements from 2000–2017 (soon to be 2000–2028; see Additional information).
What is the outlook?
- Wildland fires and other natural disturbances will continue to affect wood volume across Canadian forests. These events will increase dead tree volume, cause volume loss in some areas, shift the age-class distribution as older stands are replaced by younger stands post-disturbance, and alter tree species composition.
- Climate change will continue to alter how and where forest wood volume is distributed throughout Canada. Some areas may see an increase or decrease in volume due to the shift in climatic conditions.
- Wood volume can influence where Canadians live and work. Decreases in fibre supply due to wildland fires or pests may reduce forest sector–related jobs and population in some communities; emerging markets (e.g., bioenergy or mass timber construction) may increase them in others.
| Year | Wood volume |
|---|---|
| 1990 | 47,784 |
| 1995 | 47,735 |
| 2000 | 47,292 |
| 2005 | 48,404 |
| 2010 | 49,516 |
| 2015 | 50,629 |
| 2016 | 50,851 |
| 2017 | 51,074 |
| 2018 | 50,774 |
| 2019 | 50,666 |
| 2020 | 50,736 |
| 2021 | 50,390 |
| 2022 | 50,409 |
| 2023 | 48,996 |
Sources and information
- National Forest Inventory. Table 15.0: Total tree volume (million m3) on forest land by forest type and age class in Canada; Standard reports—T1, version 3.0. Natural Resources Canada; accessed 2025 Jul 31. (See Note a)
- National Forest Inventory. Table 16.2: Total tree volume (million m3) by species group, age class, and boreal zone in Canada; Standard reports—T1, version 3.0. Natural Resources Canada; accessed 2025 Jul 31. (See Note b)
- National Forest Inventory. Table 16.1: Total tree volume (million m3) by species group, age class and terrestrial ecozone in Canada; Standard reports—T1, version 3.0. Natural Resources Canada; accessed 2025 Jul 31.
- Kurz, W., et al. CBM-CFS3: a model of carbon dynamics in forestry and land-use change implementing IPCC standards. 2009. https://www.sciencedirect.com/science/article/pii/S0304380008005012
- Gillis MD. Estimating change from successive static forest inventories. The Forestry Chronicle. 1988;64(4):352–354. https://doi.org/10.5558/tfc64352-4
Notes
- This source was used to derive the 49 billion cubic metres of wood in Canada’s forest ecosystems. The wood volume value in the standard report is 50.1 billion cubic metres at year 2017; for years outside of the 2000–2017 period, where a statistically robust National Forest Inventory (NFI) change estimate can not be used, a proxy value is used to adjust wood volume (for more detail, see Additional information).
- This source was used to derive the poplar and spruce volume summary in the opening paragraph, bullets, and figure.
- This source describes the practice of using multiple measurements of a static forest inventory (specific time points) to measure forest attribute change through time. It discusses how the change observed while doing so can be “real” or “artificial,” and that caution must be taken to understand what is causing the change before reporting on it.
Additional information
Now that NFI has gathered enough data over time to estimate forest changes, we can more accurately estimate wood volume trends in Canada. In the past, NFI had a wood volume point estimate for 2006 only. Trend reporting was done by adding and subtracting the National Forest Carbon Monitoring Accounting and Reporting System (NFCMARS) change in above-ground biomass stock estimate between 2006 and the year of interest.
Today, NFI calculates wood volume using a hybrid method. It has a point value for 2017, and it has average annual change values covering the 2000–2017 period (for more information, see Gillis5). The point values are used for 2006 and 2017, and the annual change estimate is used to calculate the values for the 2000–2017 period.
The change values are not meant to predict wood volume values outside the measurement period, so from 1990 through 1999 and 2018 onwards, the NFCMARS above-ground biomass stock estimate is still used to derive trends. From 1990 through 1999 (Equation 1) and from 2018 onwards (Equation 2), the formulas used are:
- Equation 1:
WVYC = WV2000 × (AgBYC / AgB2000) - Equation 2:
WVYC = WV2017 × (AgBYC / AgB2017)
AgB indicates above-ground biomass; WV, wood volume; YC, year of calculation.
NFI can state with statistical confidence that Canada’s wood volume has increased from 2000 through 2017. From 1990 through 1999 and from 2018 onwards, wood volume shows slight decreases using the NFCMARS method. Once the second remeasurement period is complete in 2027, NFI will have a third wood volume point value and will be able to calculate statistical change estimates for the 2018–2027 period.
NFCMARS assumptions:
- Changes in wood volume should be closely related to changes in above-ground forest biomass and above-ground forest biomass carbon.
- Wood volume data is typically used to derive above-ground biomass and carbon data, but the opposite was done here to utilize NFCMARS annual time series data.
- In NFCMARS, the Carbon Budget Model of the Canadian Forest Sector (CBM-CFS3) uses merchantable wood volume growth increment data and converts these to biomass and then carbon. However, all this happens internally in the model, and CBM-CFS3 outputs are all in units of carbon.4
- Note that NFCMARS does not provide data for all of Canada’s forests. It is assumed here that the above-ground biomass carbon stock trend in Canada’s managed forests is a good predictor of wood volume trend for Canada’s entire forest (managed and unmanaged).5
How are Canada’s forests harvested sustainably?
Sustainable forest management (SFM) aims to maintain and enhance the environmental, social, and economic values of forests, to preserve their availability for current and future generations. Canada manages its forests according to the principles of SFM; in 2023, approximately 670,000 hectares of Canadian forests were harvested, which represents roughly 0.2% of forested land.1
Harvesting levels and growing stock
Because there are a wide range of forest types across Canada, harvesting approaches vary according to the composition, structure, and function of a forest stand. To ensure the sustainability of a forest area, harvest levels are determined by the allowable annual cut (AAC). AAC is the amount of timber set by provinces and territories that can be sustainably cut each year, based on the total available volume.2 The AAC is established as part of a long-term strategic plan for SFM.
Forest inventory and monitoring
Techniques (e.g., ground measurements, remote sensing, and modeling) are used to accurately characterize current and future forests. Advances in technology continuously improve accuracy and efficiency in planning. Efforts are underway to digitalize the forest sector, providing real-time harvest and inventory updates to forest planners.3 Continuous updates will allow improvements to wood supply models, resulting in better monitoring and more adapted forest inventories and harvesting strategies.
Forest management planning
Any harvesting on public lands in Canada is legally required to be part of a forest management plan approved by the province or territory.4–7 A forest management plan outlines the current state of the forest area concerned and the objectives to achieve diverse values such as fostering biodiversity, protecting Indigenous ways of living, and strengthening green forest industries, all in accordance with laws, regulations, and policies. Management plans propose strategies to achieve long-term SFM goals, considering climate change and natural disturbances. Forest management plans are very complex and require input from a variety of subject matter experts, led by professional foresters. To ensure key values and objectives are identified, public and stakeholder engagement is included in the process.8 Indigenous participation is also very important to incorporate Traditional Knowledge, values, and practices into planning and operations. Formal agreements in which forest management plans are led by Indigenous Peoples are in place in certain regions in Canada.
Replenishing productive forests
Regeneration is a key requirement following any harvest operation on public lands to maintain a productive forest adhering to the principles of SFM. Regeneration can be either by natural or artificial means depending on the forest type involved. Climate change presents some challenges for regeneration due to the shifting species suitability to their environment. Planting climate-adapted and resilient species are ways of increasing regeneration success. Ongoing research supports tree improvement programs that develop resilient seedlings. These programs are incorporated into adaptive silviculture strategies designed to mitigate the effects of climate change.9
Sources and information
- National Forestry Database. Area harvested by ownership, management and harvesting method; Standard reports—T1, version 3.0. Natural Resources Canada; updated 2023 Nov. http://nfdp.ccfm.org/en/data/harvest.php
- British Columbia Forest Act. RSBC 1996, c 157. https://www.bclaws.gov.bc.ca/civix/document/id/complete/statreg/96157_00_multi
- Kingsbury N, Fauteux S. Highlights of Work 2020–2024. Natural Resources Canada; 2024 [accessed 2025 Aug 1]. https://ostrnrcan-dostrncan.canada.ca/bitstreams/e2d03727-86ff-4c33-82bc-2371a6a51991/download
- Forests Act. RSNS 1989, c 179. https://nslegislature.ca/sites/default/files/legc/statutes/forests.pdf
- Sustainable Forest Development Act. RSQ 2010, c A-18.1. https://www.legisquebec.gouv.qc.ca/en/tdm/cs/A-18.1
- Bill 97, an Act mainly to modernize the forest regime. Assemblée Nationale du Québec. Accessed 2025 Sept 2. https://www.assnat.qc.ca/en/travaux-parlementaires/projets-loi/projet-loi-97-43-1.html
- Environment and Climate Change: Forest Act. Government of Northwest Territories. Accessed 2025 Sept 2. https://www.gov.nt.ca/ecc/en/services/legislative-initiatives/forest-act
- Forest stewardship. Province of British Columbia; updated 2025 Mar 6. https://www2.gov.bc.ca/gov/content/industry/forestry/managing-our-forest-resources
- Thiffault N, Fera J et al. Adaptive silviculture for climate change in the Great Lakes-St. Lawrence Forest Region of Canada: background and design of a long-term experiment. The Forestry Chronicle. 2024;100(2):155–164. https://doi.org/10.5558/tfc2024-016
Indicator: forest area harvested
Although the forest area harvested in private forests has followed the same trend as that in public forests, it still represents a stable 11% of the total area harvested in Canada. However, private land has a lower proportion of clearcutting than public land (70% for private land vs 86% for public land). This is due to a higher proportion of boreal forest on public land than on private land.
Clearcutting removes almost all the commercially valuable trees in a stand. This frees up growing space for the establishment or development of forest regeneration.
The level of industrial activity in Canada’s forests is assessed by tracking the total area harvested annually. This makes it possible to estimate the long-term sustainability of harvesting activities. In 2023, total harvested area was estimated at nearly 670,000 (ha),1 a decrease of less than 1% compared with 2022.
- The biggest decreases in total harvested area occurred in Nova Scotia (−25%; 6,800 ha) and British Columbia (−19%; 20,900 ha), whereas increases were seen in Alberta (16%; 14,400 ha) and New Brunswick (8%; 5,700 ha).
- The overall decrease can be partly explained by the record forest fire season that limited harvesting operations in several provinces during the summer of 2023.
- For British Columbia, the decrease in harvested areas can again be explained this year by the impact of the mountain pine beetle epidemic.
- Mortgage interest rates peaked in 2023, contributing to a decrease in the number of new housing starts in both Canada and the United States, leading to a drop in demand for wood products, and therefore in harvested areas as well.
Forest area harvested on private and Crown land in Canada, 2013–20231

Graph summary
Comparison of forest area harvested on Crown lands compared to private lands from 2013 to 2023.
| Year | Provincial and territorial Crown land | Private land |
|---|---|---|
| 2013 | 701,957 | 73,184 |
| 2014 | 675,913 | 73,693 |
| 2015 | 738,316 | 72,296 |
| 2016 | 718,980 | 74,856 |
| 2017 | 726,398 | 73,123 |
| 2018 | 704,091 | 92,860 |
| 2019 | 677,572 | 92,058 |
| 2020 | 666,091 | 78,750 |
| 2021 | 642,010 | 83,087 |
| 2022 | 601,548 | 73,270 |
| 2023 | 598,289 | 71,522 |
Why is this indicator important?
- Canada’s forest sector is an important part of the economy in rural communities across the country.
- Harvested forest area is an important indicator of the level of economic activity in Canada’s forest sector.
- The slight decrease in harvested area compared with 2022, despite the record fire season of 2023, indicates that economic activity in the sector will be maintained.
What is the outlook?
- Some of the areas affected by the forest fires will be reclaimed to recover the affected wood and ensure that production can resume.
- Subsequently, the impact of the fires will be assessed, and it is possible that the areas available for harvesting will be adjusted downwards to account for higher-than-expected losses and to ensure the sustainability of harvests over time.
- High interest rates could slow the demand for new homes, reducing demand for Canadian wood products widely used in home construction.
Sources and information
- National Forestry Database. Area harvested by ownership, management, and harvesting method. 1990–2022. Natural Resources Canada; updated 2023 Feb 2. http://nfdp.ccfm.org/en/data/harvest.php (See Notes a and b)
Notes
- Data include provincial and territorial Crown and private forest land subject to even-aged management (clearcutting), uneven-aged management (selection cutting), and commercial thinning harvest methods.
- The graph does not display federal lands because their small area cannot be represented at the given scale.
Indicator: forest regeneration
In 2023, 563 million seedlings1 were planted on 400,000 hectares (ha) of provincial and territorial lands2 to regenerate forests in Canada. A further 7,000 ha were regenerated by direct seeding.3
- Both the area planted, and the number of seedlings planted decreased slightly from 2022. Overall, 2023 rates were close to 5% lower than the 10-year average.
- Tree planting rates peaked in 2021 and have since decreased by 11%.
- The record levels in the 2017–2021 period were mostly from efforts to regenerate forests following prolific wildland fire seasons and to use forests as a nature-based solution for combatting climate change.4
- Successful regeneration is required following forest harvesting on public lands
- Forest type and silviculture system determine the regeneration method (natural or artificial)
- Artificial regeneration—planting or seeding—has been applied to 50% to 60% of the harvested area in the past 20 years
- Wildland fire recovery is sometimes aided by artificial regeneration
Area artificially regenerated and number of seedlings planted on provincial and territorial Crown lands in Canada, 2013–20231–3

Graph summary
The number of seedlings planted and the comparison between the area planted, and the area seeded per year from 2013 to 2023.
| Year | Area planted | Area seeded | Number of seedlings planted (millions) |
|---|---|---|---|
| 2013 | 420,167 | 11,638 | 554 |
| 2014 | 412,939 | 17,268 | 550 |
| 2015 | 401,178 | 19,764 | 576 |
| 2016 | 401,895 | 28,889 | 608 |
| 2017 | 432,028 | 17,909 | 616 |
| 2018 | 428,091 | 6,858 | 611 |
| 2019 | 441,097 | 8,802 | 617 |
| 2020 | 429,820 | 9,261 | 616 |
| 2021 | 451,296 | 8,625 | 633 |
| 2022 | 409,190 | 9,767 | 579 |
| 2023 | 400,032 | 7,058 | 563 |
Why is this indicator important?
- Regeneration activities allow harvested areas, and those that experienced natural disturbances like fire and pests, regrow as forests and continue to produce timber and maintain ecosystem services, such as storing carbon, regulating water quality, and providing habitat.
- The method used for regenerating forests can influence their composition. Artificial regeneration is mostly used for coniferous trees (softwood).
What is the outlook?
- Regeneration rates are most strongly related to recent harvest levels. These levels are influenced by market conditions but are within the bounds of sustainable forest management. Both harvest levels and the production of forest products have been trending downwards.
- British Columbia accounts for nearly 50% of the artificial regeneration activity in Canada. However, due to the mountain pine beetle epidemic, harvest rates have been decreasing, which will likely reduce tree planting in the province.5
- The historic extent of burned area by wildland fires in 20236 may prompt accelerated reforestation efforts in these areas leading to increased tree planting in the short-term.
Sources and information
- National Forestry Database. Number of seedlings planted by ownership and species group. Natural Resources Canada; updated 2023 Feb 2. http://nfdp.ccfm.org/en/data/regeneration.php (See Note a)
- National Forestry Database. Area planted by ownership and species group. Natural Resources Canada; updated 2023 Feb 2. http://nfdp.ccfm.org/en/data/regeneration.php (See Note a)
- National Forestry Database. Area of direct seeding by ownership and application method. Natural Resources Canada; updated 2023 Feb 2. http://nfdp.ccfm.org/en/data/regeneration.php (See Note a)
- A billion trees planted will benefit B.C. for generations. Government of British Columbia; accessed 2025 May 14. https://news.gov.bc.ca/releases/2021FLNRO0091-002141
- Trends in timber harvest in B.C. Government of British Columbia; updated 2018 May. http://www.env.gov.bc.ca/soe/indicators/land/timber-harvest.html
- National Forestry Database. Forest area burned and number of forest fires. Natural Resources Canada; updated 2023 Feb 2. http://nfdp.ccfm.org/en/data/fires.php
Note
- Data are for forests on provincial and territorial Crown lands across Canada. Federally and privately owned lands are excluded.
Additional information
Natural regeneration is often the most efficient approach for regenerating harvested areas. One scenario occurs when there is abundant existing understorey regeneration and a plentiful seed supply (e.g., lowland black spruce and tolerant hardwoods, respectively). Another scenario occurs when tree species that can resprout from established root systems are present and desired (e.g., trembling aspen). The area of forest naturally regenerated is not reported by jurisdiction (provinces and territories), so it is estimated as the difference between total area harvested and the area artificially regenerated.
Artificial regeneration is suitable for sites where there is insufficient desired natural regeneration and where the objective is to achieve species composition targets required for sustainable forest management objectives.
Indicator: volume harvested relative to the sustainable wood supply
In 2023, Canada harvested 114.9 million cubic metres of industrial roundwood,1 which was well below the estimated sustainable wood supply level of 209.5 million cubic metres (m3).2
- The harvested industrial roundwood volume decreased by 13 million m3 from 2022 levels.1 At the same time, the estimated wood supply deemed to be sustainable decreased by 5.4 million m3.2
- The gap between the volume of industrial roundwood harvested and the sustainable wood supply is widening. In 2023, the harvested proportion of wood supply was 11.6% lower than the average over the last decade (2013–2022).1,2
- Canada continues to harvest at levels that are below the level deemed to be sustainable.
- The overall decrease in supply and concurrent reduction in harvest were mostly attributable to British Columbia,1,2 which was heavily affected by forest fires.
Sustainable wood supply refers to the volume of timber that can be harvested annually from federal, provincial, territorial, and private lands while meeting long-term environmental, economic, and social objectives as set out in legislations that regulate timber harvesting. In this indicator, wood supply refers to industrial roundwood supplies only.
Annual harvest versus supply deemed sustainable for harvest in Canada, 1990–20231–2

Graph summary
Comparison between the volumes of annual harvest and supply per year for hardwood, softwood and total from 1990 to 2023.
| Year | Total wood supply | Total harvest | Softwood supply | Softwood harvest | Hardwood supply | Hardwood harvest |
|---|---|---|---|---|---|---|
| 1990 | 254.3 | 156.4 | 183.1 | 141.2 | 63.6 | 15.2 |
| 1991 | 252.7 | 154.2 | 183.2 | 138.5 | 62.0 | 15.7 |
| 1992 | 248.0 | 163.7 | 179.7 | 146.8 | 60.6 | 16.9 |
| 1993 | 244.5 | 169.6 | 177.2 | 150.5 | 59.7 | 19.1 |
| 1994 | 244.8 | 177.4 | 176.6 | 154.2 | 60.5 | 23.2 |
| 1995 | 240.8 | 183.2 | 173.6 | 157.4 | 59.5 | 25.7 |
| 1996 | 241.3 | 177.9 | 173.4 | 151.3 | 60.3 | 26.6 |
| 1997 | 243.7 | 183.6 | 174.7 | 153.8 | 61.4 | 29.8 |
| 1998 | 239.2 | 172.0 | 172.7 | 140.9 | 61.8 | 31.1 |
| 1999 | 243.0 | 196.7 | 176.3 | 162.8 | 61.6 | 33.9 |
| 2000 | 236.7 | 199.5 | 174.3 | 163.3 | 60.5 | 36.2 |
| 2001 | 237.4 | 184.4 | 176.2 | 149.9 | 60.7 | 34.5 |
| 2002 | 238.6 | 195.4 | 177.4 | 159.6 | 61.2 | 35.7 |
| 2003 | 241.1 | 181.4 | 178.8 | 143.8 | 62.0 | 37.6 |
| 2004 | 248.1 | 208.1 | 185.8 | 168.5 | 62.0 | 39.6 |
| 2005 | 246.4 | 201.3 | 183.3 | 165.2 | 62.7 | 36.1 |
| 2006 | 249.3 | 182.5 | 186.5 | 148.7 | 62.5 | 33.7 |
| 2007 | 253.6 | 162.1 | 191.0 | 134.6 | 62.6 | 27.3 |
| 2008 | 252.5 | 138.3 | 190.9 | 114.2 | 61.3 | 23.9 |
| 2009 | 242.0 | 115.8 | 181.8 | 94.3 | 59.9 | 21.4 |
| 2010 | 237.7 | 141.0 | 179.0 | 117.4 | 58.6 | 23.5 |
| 2011 | 232.7 | 147.0 | 174.7 | 121.0 | 57.8 | 25.9 |
| 2012 | 230.6 | 149.3 | 173.4 | 124.6 | 57.1 | 24.7 |
| 2013 | 228.0 | 151.1 | 171.6 | 126.0 | 56.5 | 25.1 |
| 2014 | 230.6 | 150.1 | 171.8 | 124.9 | 58.8 | 25.1 |
| 2015 | 222.6 | 155.6 | 164.6 | 128.2 | 56.7 | 27.3 |
| 2016 | 219.1 | 155.2 | 161.7 | 126.4 | 57.4 | 28.8 |
| 2017 | 218.9 | 152.6 | 161.7 | 126.5 | 57.0 | 26.1 |
| 2018 | 217.1 | 154.5 | 159.5 | 127.8 | 57.5 | 26.7 |
| 2019 | 215.7 | 139.2 | 158.3 | 113.1 | 57.1 | 26.1 |
| 2020 | 216.0 | 138.2 | 157.9 | 112.5 | 56.9 | 25.7 |
| 2021 | 216.5 | 137.0 | 158.7 | 111.6 | 57.8 | 25.4 |
| 2022 | 215.4 | 127.9 | 156.4 | 105.1 | 59.0 | 22.8 |
| 2023 | 210.0 | 114.9 | 151.0 | 90.8 | 59.0 | 24.1 |
Why is this indicator important?
- Forest managers track the volume of industrial roundwood harvested each year to ensure it falls within long-term sustainable levels, as set out in provincial legislation and policies that regulate the harvest on provincial lands.
- Harvests from provincial Crown lands are regulated by the allowable annual cut (AAC) that each province sets. The AAC accounts for the existing forest inventory and forecasted forest dynamics including growth and mortality.
What is the outlook?
- Harvest levels are expected to remain below the sustainable wood supply.
- Although tempered by market volatility, demand for Canadian wood products will remain strong, driven by the high quality of Canadian pulp and the demand for housing.
- The sustainable wood supply will continue to decrease over the next several years because AACs in many jurisdictions are reduced in response to the impact of insect outbreaks (e.g., mountain pine beetle, spruce budworm), hurricanes and severe wildfires, and measures to protect woodland caribou habitat and old-growth forests.
Sources and information
- National Forestry Database. Net merchantable volume of roundwood harvested by ownership, category and species group. Natural Resources Canada; updated 2023 Feb 2. http://nfdp.ccfm.org/en/data/harvest.php (See Notes a and b)
- National Forestry Database. Wood supply estimates by ownership and species group. Natural Resources Canada; updated 2023 Feb 2. http://nfdp.ccfm.org/en/data/woodsupply.php (See Notes c and d)
Notes
- Harvests include total industrial roundwood and exclude fuelwood and firewood.
- The discrepancy between the harvested volumes of “total industrial roundwood” and the sum of the “total industrial softwoods” and “total industrial hardwoods” is due to a very small amount of harvest categorized as “unspecified.” Typically, this harvest occurs in mixedwood forests where neither softwood nor hardwood categories strictly apply, and it accounts for less than 1% of the harvested volume of total industrial roundwood. More information on these data can be found at the National Forestry Database.
- Wood supply includes allowable annual cuts for provincial and territorial Crown lands and potential harvests for federal and private lands.
- The discrepancy between the “total industrial roundwood” supply volumes and the sum of the “total industrial softwoods” and “total industrial hardwoods” supply volumes is due to a very small amount of harvest categorized as “unspecified.” This supply represents some of the federal wood supply that has not been differentiated between “softwood” and “hardwood.”
How does disturbance shape Canada’s forests?
Natural disturbances such as insect outbreaks, storms, and wildfires play key roles in shaping and renewing Canada’s forests. However, climate change is making these disturbances stronger and, in some instances, more frequent, posing new challenges for our forests. Canada is taking action through a variety of programs to help its forests adapt.
This map shows climate change impacts and challenges in different regions across Canada.1 These impacts include:
- reduced ice cover
- increased pests
- permafrost degradation
- changing animal distribution
- reduced reliability of ice roads
- incidents of drought
- increased temperatures
- increased extreme wind events
- lower Great Lakes water levels
- sea-level rise
- increased coastal erosion
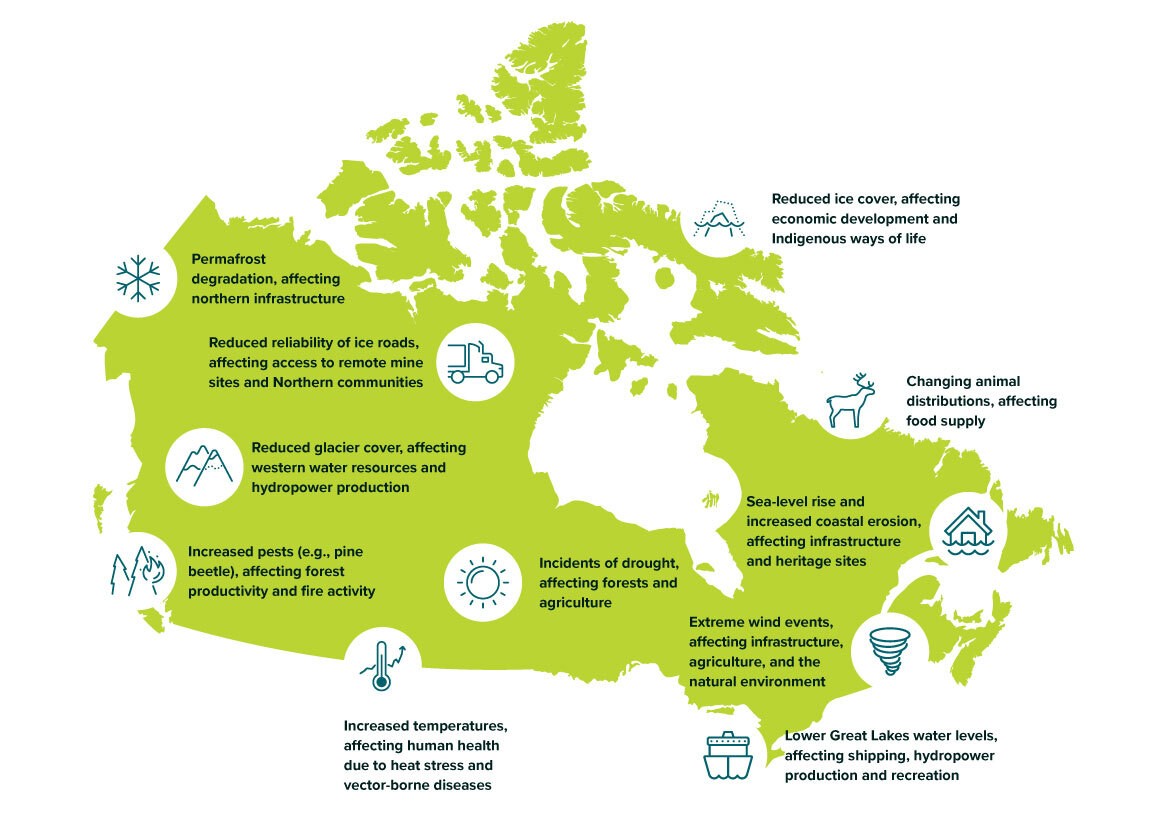
Text version
A map of Canada with 10 different climate change impacts across the country. These impacts include reduced glacier cover, increased pests, permafrost degradation, reduced ice cover, changing animal distribution, reduced reliability of ice roads, incidents of drought, increased temperatures, increased extreme wind events, lower Great Lakes water levels, and sea-level rise and increased coastal erosion.
How Canada helps its forests adapt to disturbances
Each type of disturbance affects forests differently. For example, insect outbreaks can kill large numbers of trees, storms can break branches or uproot trees, and wildland fires clear out dead or unhealthy trees. Each of these natural disturbances help create space for regeneration. Strong examples of these effects include widespread damage to pine stands in the western provinces from mountain pine beetle outbreaks over recent decades, ice storm damage in Ontario and Québec in 2025, and wildfires in British Columbia driven in part by extreme heat events or high winds. Through the National Adaptation Strategy, Canada is conducting research on forest disturbance and its relation to climate change to increase forest health and resilience.1
Protecting forests from invasive insects and diseases
Native pests can clear space for new trees, but excessive tree loss can harm forests and local economies. Exotic pests from other regions can cause unpredictable or extreme damage.2 Canada works to safeguard its forests by managing native insects and pathogens and preventing the entry of invasive species.
Examples of recent collaborations and research include the following:
- Sooty bark disease: This disease is due to the presence of a native fungus (Cryptostroma corticale) that attacks maple trees.3 Periods of heat and drought, like the 2021 Pacific heat dome and the 2022 drought in British Columbia, helped this disease spread.4 Canadian Forest Service (CFS) researchers have developed molecular tests to detect sooty bark disease quickly in nature.
- Emerald ash borer: This invasive beetle, which has been killing ash trees across eastern North America was detected in Vancouver, British Columbia, in 2023. CFS and the Canadian Food Inspection Agency have worked together to map this introduction and limit its spread.
- Spongy moth: This invasive insect established in eastern North America is regularly introduced to western Canada due to accidental transport on vehicles and cargo. CFS researchers are developing molecular tools to monitor introductions and confirm the effectiveness of eradication efforts by the British Columbia government.
Building stronger defenses against wildfires
Canada's national wildfire strategy brings people together with a shared plan to prevent wildfires and reduce damage.
Here are some important ways Canada tackles wildfires:
- Watching fires from space: WildFireSat, an operational satellite mission from Natural Resources Canada, the Canadian Space Agency, and Environment and Climate Change Canada, will use innovative technology to track wildfires across the country and provide near-real-time data to decision-makers.5
- Using First Nations Traditional Ecological Knowledge: for thousands of years, First Nations have used controlled burns to manage forests. These small fires prevent larger wildfires, help forests grow back stronger, and keep cultural connections to the land.6,7
- Protecting communities: The Wildfire Resilient Futures Initiative supports wildfire prevention and mitigation actions such as clearing dead wood, creating firebreaks, and using small, controlled burns near towns.8
- Commitment to the Kananaskis Wildfire Charter9: Endorsed by the G7 during Canada’s Presidency in 2025, the charter aims to build global capacity to prevent, respond, and recover from wildfires. It identifies priority actions before, during, and after fire that countries can take on their own or in collaboration with others. Priority actions include strengthening global capacity to prepare for and respond to wildfires by advancing tools and technologies for early warning systems, data sharing, mitigating human-health impacts, enhancing interoperability in response, and exploring improved access to firefighting equipment around the world.
Forest disturbances affect carbon balance
- Trees take in carbon dioxide from the atmosphere and store it as living biomass in leaves, branches, stem wood, and roots.
- Forests also release carbon back to the atmosphere. This happens when trees respire or when decomposition of leaf litter, soil, and woody debris releases carbon from the forest. Disturbances, such as wildland fires, can also lead to the release of carbon directly to the atmosphere. Other disturbances, such as insect attacks and harvesting, generate more debris for decomposition.10
- When trees are harvested, some of the carbon is also stored in long-lived wood products where it can remain for many years.
Canada tracks this carbon balance with the following:
- The National Forest Carbon Monitoring, Accounting, and Reporting System, which gathers data on wildland fires, insects, and logging11
- The Carbon Budget Model, which estimates how disturbances affect forest carbon12
These tools help reveal how disturbances impact the balance between stored and released carbon.
By working together to tackle disturbance challenges now, Canadians can contribute to keeping forests strong, supporting wildlife, and slowing climate change for generations to come.
Sources and information
- Canada’s national adaptation strategy. Government of Canada; 2023 [updated 2023 Aug 1]. https://www.canada.ca/en/services/environment/weather/climatechange/climate-plan/national-adaptation-strategy/full-strategy.html
- Responding to invasive and alien forest pests. Natural Resources Canada; updated 2025 Jan 10. https://natural-resources.canada.ca/forest-forestry/insects-disturbances/responding-invasive-alien-forest-pests
- Sooty bark disease (Cryptostroma corticale). iNaturalist; accessed 2025 May 22. https://www.inaturalist.org/taxa/781808-Cryptostroma-corticale
- VanCamp M. Mystery in the maples: uncovering the spread of sooty bark disease in British Columbia. Natural Resources Canada; 2025 [updated 2025 Mar 20]. https://natural-resources.canada.ca/stories/simply-science/mystery-maples-uncovering-spread-sooty-bark-disease-british-columbia
- WildFireSat. Government of Canada; updated 2025 May 3. https://www.asc-csa.gc.ca/eng/satellites/wildfiresat/
- Traditional ecological knowledge: the cornerstone of Indigenous climate adaptation in Canada. Indigenous Climate Hub; 2024. https://indigenousclimatehub.ca/2024/04/traditional-ecological-knowledge-the-cornerstone-of-indigenous-climate-adaptation-in-canada/
- Fire protection in First Nations communities. Government of Canada; updated 2025 Jul 3. https://sac-isc.gc.ca/eng/1317842518699/1535120096924 (See Note a)
- Wildfire Resilient Futures Initiative. Natural Resources Canada; updated 2025 Jul 29. https://natural-resources.canada.ca/forest-forestry/wildland-fires/wildfire-resilient-futures-initiative
- Kananaskis Wildfire Charter [statement]. G7 2025 Kananaskis; 2025 Jun 17. https://g7.canada.ca/en/news-and-media/news/kananaskis-wildfire-charter/
- Is Canada’s forest a carbon sink or source? Natural Resources Canada; 2024. Updated 2025 Mar. https://publications.gc.ca/collections/collection_2007/nrcan-rncan/Fo93-1-2-2007E.pdf (See Note b)
- Canada's forest carbon reporting system. Natural Resources Canada; updated 2025 Mar 7. https://natural-resources.canada.ca/climate-change/forest-carbon/canada-s-forest-carbon-reporting-system
- Carbon Budget Model. Natural Resources Canada; updated 2025 Jul 11. https://natural-resources.canada.ca/climate-change/climate-change-impacts-forests/carbon-budget-model (See Note b)
- Global Forest Resources Assessment 2025 Canada – Report. Food and Agriculture Organization of the United Nations. Updated 2025 October 21. https://openknowledge.fao.org/items/1e3395bb-3955-472a-a3c6-668253125266
- Damage control: reducing Canada’s economic losses from climate change. Canadian Climate Institute; 2022 [accessed 2025 May 15]. https://climateinstitute.ca/reports/damage-control (See Note c)
Notes
- Indigenous Services Canada budgets $16.5 million each year, and an additional $47.7 million (2019–2024) plus $39.2 million (2022–2027) in targeted programs, to expand FireSmart and other wildland fire management activities led by First Nations. These initiatives combine traditional fire knowledge with modern equipment and training to lower wildfire risk and build community resilience.7 In addition, the Fighting and Managing Wildfires in a Changing Climate program, which began in 2022, provides $364.1 million in cost-shared funding over 5 years to provinces, territories, and Indigenous organizations to purchase firefighting equipment and train new wildland firefighters to better respond to wildland fires across Canada.
- Canada’s 225 million hectares (ha) of managed forests (within the 369 million ha national total)13 are tracked with the Carbon Budget Model of the Canadian Forest Sector.12 The model indicates that the managed forests have been a net carbon source in recent decades, releasing more carbon dioxide than they absorb because of disturbances such as larger wildland fires, insect outbreaks, and emissions from harvested wood.10
- Climate-impact modelling by the Canadian Climate Institute predicts annual climate-related losses of $25 billion in 2025. Without additional adaptation efforts, they estimate annual damages in the range of $78 billion (low-emissions path) to $101 billion (high-emissions path) per year by 2050.14
Indicator: forest insects
Insects and other organisms produce chemicals called semiochemicals, which act as scent cues to help them navigate and communicate in forests. These semiochemicals are often very specific in their chemical structure. These can be produced by prey, host plants, or by mates. Understanding semiochemicals is important to figuring out how a pest moves in an environment and can help in monitoring populations using semiochemical-based traps.
In 2023, 11.6 million hectares (ha) of Canada’s forests were affected by insects,1 an 11.4% decrease from 2022.
- The significant spongy moth outbreak in Ontario continues to decrease, with defoliation decreasing a further 95% in 2023 compared to 2022.
- In 2023, eastern spruce budworm defoliation remained high in Québec and Ontario. Notable reductions were observed in Newfoundland and Labrador and the Northwest Territories.
- Overall, tree mortality caused by spruce beetle continues to decrease, falling by a 33% in British Columbia from 2022 to 2023.
- Defoliation by jack pine budworm from 2022 to 2023 decreased by more than 50% in Ontario, remained stable in Manitoba, and increased nearly fivefold in Saskatchewan. Nationally, overall levels in 2023 were similar to those observed in 2022.
- Damage by other insect species increased in Ontario and British Columbia; however, large reduction in the Northwest Territories resulted in overall nationwide reductions of 23% from 2022 through 2023.
Forest area (in hectares) containing defoliated or beetle-killed trees for key insects in Canada, 2013–20231

Graph summary
Comparison of the area disturbed for five forest insect species (spongy moth, eastern spruce budworm, jack pine budworm, mountain pine beetle, and spruce beetle) and all others by jurisdiction for each year from 2013 to 2023.
| Jurisdiction | Year | Spruce beetle | Mountain pine beetle | Jack pine budworm | Eastern spruce budworm | Spongy moth | Other species |
|---|---|---|---|---|---|---|---|
| Alberta | 2013 | 0 | N/A | 0 | 37,076 | 0 | 69,461 |
| Alberta | 2014 | 0 | N/A | 0 | 44,387 | 0 | 21,852 |
| Alberta | 2015 | 1,405 | 1,121,477 | 0 | 51,750 | 0 | 0 |
| Alberta | 2016 | 10,465 | 198,963 | 0 | 19,265 | 0 | 7,442 |
| Alberta | 2017 | 3,138 | 213,170 | 0 | 17,337 | 0 | 156,243 |
| Alberta | 2018 | 2,145 | 205,015 | 1,217 | 30,446 | 0 | 208,482 |
| Alberta | 2019 | 1,762 | 178,909 | 0 | 47,213 | 0 | 153,032 |
| Alberta | 2020 | 2,853 | 77,637 | N/A | 65,719 | N/A | 418,151 |
| Alberta | 2021 | 2,095 | 23,051 | N/A | 100,443 | N/A | 221,799 |
| Alberta | 2022 | 182 | 8,981 | 0 | 68,069 | 0 | 366,393 |
| Alberta | 2023 | 0 | 1,934 | 0 | 73,183 | 0 | 404,306 |
| British Columbia | 2013 | 18,693 | 2,973,935 | 0 | 0 | 0 | 3,922,437 |
| British Columbia | 2014 | 288,892 | 2,208,687 | 0 | 0 | 0 | 6,718,222 |
| British Columbia | 2015 | 194,050 | 326,477 | 0 | 0 | 0 | 3,390,885 |
| British Columbia | 2016 | 281,497 | 177,706 | 0 | 250 | 0 | 4,663,996 |
| British Columbia | 2017 | 501,873 | 119,089 | 0 | 756 | 0 | 4,419,043 |
| British Columbia | 2018 | 340,405 | 113,781 | 0 | 0 | 0 | 4,434,557 |
| British Columbia | 2019 | 515,447 | 178,140 | 0 | 3,885 | 0 | 4,675,810 |
| British Columbia | 2020 | 525,271 | 111,963 | 0 | 7,267 | 0 | 4,085,422 |
| British Columbia | 2021 | 470,668 | 73,238 | 0 | 36,449 | 0 | 4,050,000 |
| British Columbia | 2022 | 143,569 | 50,820 | 0 | 0 | 0 | 2,440,000 |
| British Columbia | 2023 | 95,633 | 42,845 | 0 | 3,221 | 0 | 2,320,000 |
| Manitoba | 2013 | 0 | 0 | 311 | 1,163 | 0 | 95,429 |
| Manitoba | 2014 | 0 | 0 | 4,346 | 0 | 0 | 1,358 |
| Manitoba | 2015 | 0 | 0 | 3,285 | 0 | 0 | 69,611 |
| Manitoba | 2016 | N/A | N/A | 199,799 | 12,597 | N/A | 15,853 |
| Manitoba | 2017 | N/A | N/A | 638,181 | 388 | N/A | 25,906 |
| Manitoba | 2018 | N/A | N/A | 552,118 | N/A | N/A | 37,109 |
| Manitoba | 2019 | N/A | N/A | 1,025,850 | 34,305 | N/A | N/A |
| Manitoba | 2020 | 0 | 0 | 2,580,000 | 104,433 | 0 | 0 |
| Manitoba | 2021 | 0 | 0 | 2,030,000 | 156,055 | 0 | 0 |
| Manitoba | 2022 | 0 | 0 | 673,851 | 19,422 | 0 | 0 |
| Manitoba | 2023 | 0 | 0 | 673,851 | 19,422 | 0 | 0 |
| New Brunswick | 2013 | 0 | 0 | 0 | 0 | 0 | 700 |
| New Brunswick | 2014 | 0 | 0 | 0 | 0 | 0 | 0 |
| New Brunswick | 2015 | 0 | 0 | 0 | 0 | 0 | 0 |
| New Brunswick | 2016 | 0 | 0 | 0 | 0 | 0 | 0 |
| New Brunswick | 2017 | 0 | 0 | 0 | 875 | 0 | 0 |
| New Brunswick | 2018 | 0 | 0 | 0 | 440 | 0 | 0 |
| New Brunswick | 2019 | N/A | N/A | N/A | 0 | N/A | N/A |
| New Brunswick | 2020 | 0 | 0 | 0 | 0 | 0 | 0 |
| New Brunswick | 2021 | N/A | N/A | N/A | N/A | N/A | N/A |
| New Brunswick | 2022 | 100 | N/A | N/A | 1,200 | N/A | N/A |
| New Brunswick | 2023 | 0 | N/A | N/A | 100 | N/A | N/A |
| Newfoundland and Labrador | 2013 | 7,848 | N/A | N/A | 55,045 | N/A | 499 |
| Newfoundland and Labrador | 2014 | 46,839 | 0 | 0 | 50,767 | 0 | 0 |
| Newfoundland and Labrador | 2015 | 46,839 | 0 | 0 | 36,352 | 0 | 0 |
| Newfoundland and Labrador | 2016 | 0 | 0 | 0 | 34,520 | 0 | 0 |
| Newfoundland and Labrador | 2017 | 0 | 0 | 0 | 430 | 0 | 0 |
| Newfoundland and Labrador | 2018 | 0 | 0 | 0 | 0 | 0 | 307 |
| Newfoundland and Labrador | 2019 | 0 | 0 | 0 | 0 | 0 | 0 |
| Newfoundland and Labrador | 2020 | 0 | 0 | 0 | 3,319 | 0 | 0 |
| Newfoundland and Labrador | 2021 | 0 | 0 | 0 | 65,701 | 0 | 0 |
| Newfoundland and Labrador | 2022 | N/A | N/A | N/A | 167,209 | N/A | N/A |
| Newfoundland and Labrador | 2023 | N/A | N/A | N/A | 73,356 | N/A | N/A |
| Northwest Territories | 2013 | N/A | N/A | N/A | 53,539 | N/A | 75,567 |
| Northwest Territories | 2014 | N/A | N/A | N/A | 76,400 | N/A | 270,839 |
| Northwest Territories | 2015 | N/A | N/A | N/A | 174,263 | N/A | 236,673 |
| Northwest Territories | 2016 | N/A | N/A | N/A | 122,473 | N/A | 261,411 |
| Northwest Territories | 2017 | N/A | N/A | N/A | 245,859 | N/A | 239,837 |
| Northwest Territories | 2018 | N/A | N/A | N/A | 391,615 | N/A | 357,534 |
| Northwest Territories | 2019 | N/A | N/A | N/A | 215,753 | N/A | 593,867 |
| Northwest Territories | 2020 | 0 | 0 | 0 | 107,760 | 0 | 292,930 |
| Northwest Territories | 2021 | 0 | 0 | 0 | 1,030,000 | 0 | 0 |
| Northwest Territories | 2022 | 0 | 0 | 0 | 1,310,000 | 0 | 1,460,000 |
| Northwest Territories | 2023 | N/A | N/A | N/A | 529,000 | N/A | 476,000 |
| Nova Scotia | 2013 | N/A | N/A | N/A | N/A | N/A | N/A |
| Nova Scotia | 2014 | 533 | N/A | N/A | N/A | N/A | N/A |
| Nova Scotia | 2015 | N/A | N/A | N/A | N/A | N/A | N/A |
| Nova Scotia | 2016 | N/A | N/A | N/A | N/A | N/A | N/A |
| Nova Scotia | 2017 | 0 | N/A | N/A | N/A | N/A | 0 |
| Nova Scotia | 2018 | 0 | N/A | N/A | N/A | N/A | 0 |
| Nova Scotia | 2019 | 0 | N/A | N/A | N/A | N/A | 0 |
| Nova Scotia | 2020 | 0 | 0 | 0 | 0 | 0 | 0 |
| Nova Scotia | 2021 | 0 | 0 | 0 | 0 | 0 | 18,727 |
| Nova Scotia | 2022 | 0 | 0 | 0 | 0 | 0 | 167,559 |
| Nova Scotia | 2023 | 0 | 0 | 0 | 0 | 0 | 167,559 |
| Ontario | 2013 | 0 | 0 | 91,865 | 348 | 8,451 | 97,763 |
| Ontario | 2014 | 0 | 0 | 22,010 | 30,317 | 23,335 | 64,814 |
| Ontario | 2015 | 0 | 0 | 21,349 | 149,310 | 2,529 | 3,326 |
| Ontario | 2016 | 0 | 0 | 5,086 | 119,462 | 0 | 50,749 |
| Ontario | 2017 | 0 | 0 | 100,510 | 147,546 | 21,712 | 65,648 |
| Ontario | 2018 | 0 | 0 | 625,955 | 136,410 | 14,930 | 39,232 |
| Ontario | 2019 | 0 | 0 | 1,029,916 | 343,426 | 47,431 | 713 |
| Ontario | 2020 | 0 | 0 | 1,060,000 | 447,730 | 583,158 | 1,093 |
| Ontario | 2021 | 0 | 0 | 345,389 | 1,330,000 | 1,780,000 | 15,474 |
| Ontario | 2022 | 0 | 0 | 133,472 | 2,040,000 | 57,078 | 14,809 |
| Ontario | 2023 | 0 | 0 | 61,431 | 1,990,000 | 2,542 | 26,895 |
| Prince Edward Island | 2013 | 60 | N/A | N/A | N/A | 1 | 30 |
| Prince Edward Island | 2014 | 50 | N/A | N/A | N/A | N/A | 25 |
| Prince Edward Island | 2015 | 50 | N/A | N/A | N/A | N/A | 25 |
| Prince Edward Island | 2016 | 10 | N/A | N/A | N/A | N/A | 15 |
| Prince Edward Island | 2017 | 10 | N/A | N/A | N/A | 2 | 15 |
| Prince Edward Island | 2018 | 5 | N/A | N/A | N/A | 2 | 10 |
| Prince Edward Island | 2019 | 5 | N/A | N/A | N/A | 2 | 12 |
| Prince Edward Island | 2020 | 0 | 0 | 0 | 0 | 0 | 0 |
| Prince Edward Island | 2021 | 0 | 0 | 0 | 0 | 0 | 10 |
| Prince Edward Island | 2022 | 0 | 0 | 0 | 0 | 0 | 220 |
| Prince Edward Island | 2023 | N/A | N/A | N/A | 1 | N/A | N/A |
| Quebec | 2013 | N/A | N/A | 0 | 2,621,520 | 0 | 674 |
| Quebec | 2014 | N/A | N/A | 0 | 3,381,829 | 0 | 0 |
| Quebec | 2015 | N/A | N/A | 0 | 4,824,947 | 0 | 0 |
| Quebec | 2016 | N/A | 0 | 0 | 4,664,658 | 0 | 0 |
| Quebec | 2017 | N/A | 0 | 0 | 5,105,885 | 0 | 0 |
| Quebec | 2018 | N/A | 0 | 0 | 5,433,302 | 0 | 0 |
| Quebec | 2019 | N/A | N/A | N/A | 4,891,885 | N/A | N/A |
| Quebec | 2020 | 0 | 0 | 0 | 6,250,000 | 0 | 0 |
| Quebec | 2021 | 0 | 0 | 0 | 2,460,000 | 0 | 0 |
| Quebec | 2022 | 0 | 0 | 0 | 3,210,000 | 0 | 0 |
| Quebec | 2023 | 0 | 0 | 0 | 3,210,000 | 0 | 0 |
| Saskatchewan | 2013 | N/A | N/A | N/A | 9,307 | N/A | 99,837 |
| Saskatchewan | 2014 | 0 | 0 | 0 | 0 | 0 | 159 |
| Saskatchewan | 2015 | 0 | N/A | 0 | 0 | 0 | 1,205 |
| Saskatchewan | 2016 | 0 | N/A | 1,965 | 0 | 0 | 374 |
| Saskatchewan | 2017 | 0 | N/A | 10,189 | 0 | 0 | 994 |
| Saskatchewan | 2018 | 0 | N/A | 6,141 | 0 | 0 | 171 |
| Saskatchewan | 2019 | 0 | N/A | 12,624 | 0 | 0 | 5,693 |
| Saskatchewan | 2020 | 0 | 0 | 25,327 | 0 | 0 | 4,158 |
| Saskatchewan | 2021 | 0 | 0 | 32,449 | 0 | 0 | 31,082 |
| Saskatchewan | 2022 | 0 | 0 | 11,748 | 244 | 0 | 4,342 |
| Saskatchewan | 2023 | 0 | 0 | 53,874 | 2,610 | 0 | 11,002 |
| Yukon | 2013 | 0 | 0 | 0 | 0 | 0 | 0 |
| Yukon | 2014 | 82 | N/A | N/A | N/A | N/A | N/A |
| Yukon | 2015 | N/A | N/A | N/A | N/A | N/A | 6,759 |
| Yukon | 2016 | N/A | N/A | N/A | N/A | N/A | 179,160 |
| Yukon | 2017 | N/A | N/A | N/A | 369 | N/A | 106,359 |
| Yukon | 2018 | 1,196 | 0 | 0 | 0 | 0 | 5,319 |
| Yukon | 2019 | 1,196 | 0 | 0 | 0 | 0 | 5,319 |
| Yukon | 2020 | 0 | 0 | 0 | 788 | 0 | 0 |
| Yukon | 2021 | 2,276 | 0 | 0 | 0 | 0 | 0 |
| Yukon | 2022 | 556 | 0 | 0 | 0 | 0 | 0 |
| Yukon | 2023 | 972 | 0 | 0 | 0 | 0 | 0 |
Why is this indicator important?
- Insects fulfill many ecological roles within Canada’s forest, from being pollinators that are essential for flowering plants to being important ecological and economic pests. Many insects are highly specialized within the forest environment and are vulnerable to habitat change and loss.
- Some insects (including stem borers, defoliators, and leaf miners) may cause ecologically and economically significant levels of damage at both local and landscape levels. Although some native insect species may have periodic or cyclical population outbreaks that are natural features in a forest ecosystem, severe outbreaks or those that are long-lasting or affect new areas may result in timber loss, increased fire risk, and biodiversity losses. These effects can expand beyond local, provincial, or territorial regions to become important issues that extend beyond jurisdictional boundaries and require coordination across multiple levels of government. Strategies like forest health–monitoring, detection, delineation, and the application of appropriate management are important in mitigating these potentially serious risks.
- Invasive species are often not significant pests in their native ranges; however, when they arrive in a new range that is free of predators and where our native tree species have limited resistance to attack, these invasives can cause significant ecological and economic damage. Invasive species continue to be a serious threat to Canada’s forests, with organisms such as the hemlock woolly adelgid that is causing significant damage to hemlock forests in Nova Scotia and Ontario. Other invasive species, such as the emerald ash borer, threaten to kill a significant amount of trees that the affected species may no longer contribute meaningfully to the functioning of the Canadian forest ecosystem. Early detection, monitoring, and interception programs are critical in preventing invasive species from being introduced or established in Canada. Regulatory controls that restrict the movement of infested products or transport of invasive organisms can reduce the spread of invasive species, although these may have regional, national, and international effects on trade, market access, raw material supplies, and the movement of goods.
What is the outlook?
- Spongy moth populations decreased substantially compared with 2021, with predicted effects of pathogens (including a virus and fungus as well as local parasite populations), likely contributing to population decreases. This is in line with predicted 10-year populations cycles.
- With the implementation of early treatment strategies, damage from eastern spruce budworm will likely continue to decrease in Newfoundland and Labrador. Damage in Québec remains high, and evaluations of populations throughout the Gaspésie region will continue. In Ontario, the outbreak is expected to continue in the northeast, with the potential for populations to start increasing in the northwestern region of the province.
- Spruce beetle populations and their associated tree mortality will most likely continue to remain low.
- Mountain pine beetle populations in Alberta continue to decrease, with management programs combined with cold winters helping to reduce overall populations and eliminate scattered infestations on the leading edge of eastern expansion.
- Although the nationwide damaged area caused by other insect species was lower in 2023 than in 2022, it was still significant, comprising 33% of all insect damage recorded in 2023. As an important component of this group, invasive species require specialized and targeted response plans. With range expansions due to climate change and increased transborder shipping of commercial goods, the continued monitoring and management of invasive species at local, provincial, and national levels remain important to the preservation of Canada’s forests.
Sources and information
- National Forestry Database. Area of moderate to severe defoliation (including beetle-killed trees) by insects. Natural Resources Canada; updated 2023 Feb 2. http://nfdp.ccfm.org/en/data/insects.php (See Notes a–c)
- Entomological Society of Canada adopts spongy moth as new common name for Lymantria dispar. Entomological Society of Canada. 2022 March 2 [accessed 2025 Sept 2]. https://esc-sec.ca/2022/03/02/new-common-name-for-lymantria-dispar/ (See Note d)
Notes
- Forest area affected by defoliators (e.g., budworms, spongy moth) includes only areas with tree mortality or moderate to severe defoliation. Defoliation does not always result in mortality. Several factors, including defoliation severity, duration and frequency, or presence of other stressors (e.g., drought) can affect the level of mortality.
- Forest area affected by bark beetles (e.g., mountain pine beetle, spruce beetle) is derived from aerial surveys that map dead or dying trees affected by beetle attack.
- Summing the areas affected by more than 1 insect species to create a grand total can result in an overestimate if more than 1 insect species occurs in the same stand in the same year. For example, in a mixedwood forest, spruce budworm may defoliate balsam fir in the same stand that forest tent caterpillar is defoliating the aspen trees.
- The name “spongy moth” was adopted by the Entomological Society of Canada and the Entomological Society of America in March 2022 as their new common name for Lymantria dispar. The species was referred to as gypsy moth and LDD moth in reports before 2022.2
Additional information
Guignard Q, Goodwin J et al. Factors influencing the capture of Japanese beetles: wind speed and direction, trap deployment protocol, lure type, and trap efficiency. Ann Entomol Soc Am. 2025;118(4):259–265. https://doi.org/10.1093/aesa/saaf013
Langor DW, Abraham S, Hicks B, Hammond HJ. Adalia decempunctata (Coleoptera: Coccinellidae), a Palaearctic species now established in North America. Can Entomol. 2023;155:e35. https://doi.org/10.4039/tce.2023.23
McCaig ML, Kidd KA et al. Response of stream habitat and microbiomes to spruce budworm defoliation: new considerations for outbreak management. Ecol Appl. 2024;34(7):e3020. https://doi.org/10.1002/eap.3020
Turgeon JJ, Gasman B et al. Canada’s response to invasion by Asian longhorned beetle (Coleoptera: Cerambycidae) in Ontario. Can Entomol. 2022;154(s1):e1. https://doi.org/10.4039/tce.2021.60
Indicator: forest diseases
New detections of forest diseases highlight the growing risks facing Canadian forests. Early detection and rapid response efforts helped contain threats including Dutch elm disease, oak wilt, and the pathogen Phytophthora ramorum.
One Health is a global concept recognizing the interconnectedness of human, animal, plant, and environmental health. Healthy forests help regulate air and water quality, support biodiversity, and reduce the risk of disease emergence, making forest health monitoring vital to broader ecosystem and public health.
- Dutch elm disease, present in Canada for decades, was found in Edmonton for the first time in 2024, resulting in a rapid incursion response by city arborists who removed all affected trees.
- Phytophthora pathogens remain a concern, with P. ramorum intercepted in a Québec ornamental tree nursery and root rot outbreaks affecting fir seedlings in Québec Christmas tree plantations.
- Sooty bark disease was confirmed for the first time in 2024 on bigleaf maple in British Columbia.
- Oak wilt was not detected in Canada in 2024, despite more than 100 public reports investigated by the Canadian Food Inspection Agency following the detection and removal of infected trees at 2 sites in Ontario in 2023.
Why is this indicator important?
- Invasive forest diseases can reduce the ability of forests to provide essential ecosystem services like carbon storage, clean water, and habitat for biodiversity.
- Forest diseases can also reduce timber supply, decrease wood quality, increase management costs, create safety hazards, diminish urban forest health, as well as threaten the economic viability of forest-based industries and communities across Canada.
What is the outlook?
- Climate change is expected to intensify the severity and spread of both endemic and invasive pathogens; for example, Swiss needle cast will likely become more severe in coastal Douglas-fir forests.
- Continued investment in early detection, DNA-based diagnostics, surveillance, and intervention strategies is needed to contain threats, such as further incursion of oak wilt into Canada from the south.
- Collaborative responses between all levels of government will remain essential to mitigate risks and protect forests from emerging disease impacts.
Additional information
- Burgess TI, Oliva J et al. Anthropogenic disturbances and the emergence of native diseases: a threat to forest health. Curr Forestry Rep. 2022;8:111–123. https://doi.org/10.1007/s40725-022-00163-0
- Capron A, Herath P, et al. SODplex, a series of hierarchical multiplexed real-time PCR assays for the detection and lineage identification of Phytophthora ramorum, the causal agent of sudden oak death and sudden larch death. PhytoFront. 2023;3(1):173–185. https://doi.org/10.1094/PHYTOFR-09-22-0095-FI
- Charron G, Gauthier MK et al. A qPCR assay for the detection of Phytophthora abietivora, an emerging pathogen on fir species cultivated as Christmas trees. PloS ONE. 2025;20(4):e0320680. https://doi.org/10.1371/journal.pone.0320680
- Feau N, Tanney JB, Walker JKM. Sooty bark disease. Natural Resources Canada; updated 2025 May 13. https://tidcf.nrcan.gc.ca/en/diseases-caused-by-pathogens/factsheet/1000147
- Hamelin RC, Roe AD. Genomic biosurveillance of forest invasive alien enemies: a story written in code. Evol Appl. 2019;13(1):95–115. https://doi.org/10.1111/eva.12853
- Herpin-Saunier NY, Sambaraju KR et al. Genetic lineage distribution modeling to predict epidemics of a conifer disease. Front For Glob Change. 2022;4:756678. https://doi.org/10.3389/ffgc.2021.756678
- Oak wilt. Canadian Food Inspection Agency; updated 2024 Jan 11. https://inspection.canada.ca/plant-health/invasive-species/plant-diseases/oak-wilt/eng/1325624048625/1325624535106
- Okhowat A, Carlsten C et al. Sooty bark disease in BC: a cause of a rare form of hypersensitivity pneumonitis. BCMJ. 2025;67(1):33–34. https://bcmj.org/bc-centre-disease-control/sooty-bark-disease-bc-cause-rare-form-hypersensitivity-pneumonitis
- Scholthof KBG. The greening of one health: plants, pathogens, and the environment. Annu Rev Phytopathol. 2024;62:401–421. https://doi.org/10.1146/annurev-phyto-121423-042102
- Seidl R, Klonner G et al. Invasive alien pests threaten the carbon stored in Europe’s forests. Nat Commun. 2018;9:1626. https://doi.org/10.1038/s41467-018-04096-w
- Tanney JB, Feau N et al. Cryptostroma corticale (Ellis & Everh.) P. H. Greg. & S. Waller causing sooty bark disease in British Columbia, Canada. Can J Plant Pathol. 2024;46(6):596–610. https://doi.org/10.1080/07060661.2024.2369324
- Van der Heyden H, Duceppe MO et al. Oomycete communities are influenced by land use and disease status in Christmas tree production in Southern Québec, Canada. Environ DNA. 2024;6(2):e529. https://doi.org/10.1002/edn3.529
Indicator: wildland fire
Canadian fire management agencies reported a total of 5.3 million hectares (ha) burned in 2024.1 This is an area the size of Nova Scotia and almost double the 25-year average of 2.9 million ha.2
There were 5,844 fires in Canada in 2024, below the 25-year average of 6,554 fires per year.3 Although annual burned area has increased in recent years,4 the number of fires has been gradually decreasing. This includes both lightning and human-caused fires5, but particularly human-caused. Although more Canadians are living, travelling, and recreating in forested areas, there may be greater awareness of wildland fire risk, due in part to the alarming number of evacuations, homes lost, and smoky summer days in recent years.
More than 700 firefighters from Australia, New Zealand, Mexico, South Africa, Costa Rica, and the United States came to Canada to help manage the fires in 2024.6 The Canadian Armed Forces also assisted with evacuations and fire suppression in Newfoundland and Labrador, Alberta, and Manitoba.7
Overwinter (zombie) fires
The 2024 fire season got an early start, with more than 100 fires from 2023 surviving the winter in British Columbia, Alberta, and the Northwest Territories.8
Overwinter fires, sometimes called "zombie fires," smoulder in deep organic soils, like peatlands, and re-emerge in the spring after the snow melts. These fires are difficult to detect and monitor but, in the winter, may reveal themselves as smoke rising from beneath the snow. Others are not detected until they flare up in the spring, when conditions become conducive to burning.9
In northeastern British Columbia, low snowpack and a warm, dry spring helped many fires from the previous year resurface.10 This area had been abnormally dry for the previous 2 years and was classified as experiencing severe to extreme drought throughout the summer of 2024.11
Evacuations
More than 50,000 people were evacuated from their homes during the 2024 fire season.12 The following table details a few of the large evacuation events:
| Date of ignition | Location | Evacuees (No.) | Evacuation days (No.) | Comments |
|---|---|---|---|---|
| May 10 | Fort Nelson, BC | 4,300 | 17 | 4 homes were destroyed |
| May 14 | Fort McMurray, AB | 6,600 | 4 | The city was severely affected by fire 8 years prior |
| July 12 | Labrador City, NL | 9,600 | 8 | The fire was controlled and smouldering 27 km west of the town, then wind spread the fire 21 km in 1 day: largest evacuation in Newfoundland and Labrador history |
| July 20 | John D'Or Prairie and Fox Lake, AB | 5,600 | 17 | Fox Lake had been evacuated for 74 days the previous year |
| July 22 | Jasper, AB | 25,000 | 25 | 2000 residents had their homes destroyed |
| August 10 | Sandy Bay, SK | 1,300 | 31 | The nearby Flanagan fire burned for 3 mo and came within 3 km of the community |
| August 14 | Bunibonibee, MB | 2,200 | 18 | With the fire burning 10 km away, residents of this fly-in community were evacuated by the Royal Canadian Air Force on Hercules transport aircraft over 4 days |
| August 27 | Southend, SK | 1,100 | 15 | The evacuation was interrupted when fire reached the only road out of town |
Jasper
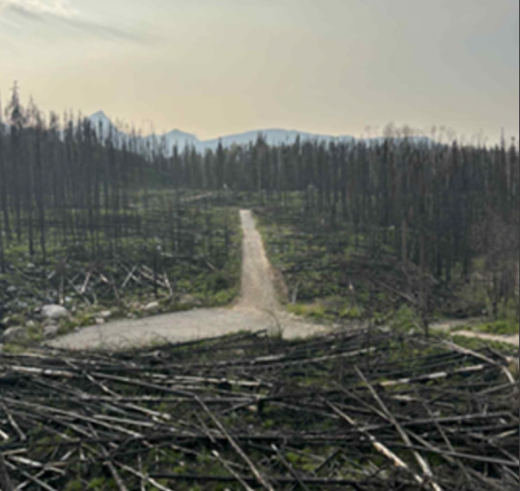
Forest fire damage in Jasper, Canada. September 2025. Photo credit: Karina Butler
On July 22, 2024, lightning ignited 3 fires 22 kilometres south of the town of Jasper. The area had seen 2 weeks of hot, dry weather. Propelled by strong winds, the fires spread rapidly, merged into 1 fire, and headed north. That night, evacuation orders were issued for all of Jasper National Park, affecting approximately 5,000 residents and 20,000 visitors and seasonal workers.13 Park staff evacuated the campgrounds and backcountry trails. Meanwhile, fire management personnel fought hard to protect the Jasper townsite.14
On July 24, winds increased to an estimated 100 km/h—strong enough to uproot trees. At 6:00 p.m., the fire spread to the Jasper townsite. In a few hours, one-third of the town’s buildings were destroyed, along with more than 100 cabins and other structures in the surrounding area. One firefighter was killed, 2,000 people were displaced, and insured damages exceeded $1.2 billion. It was the second-costliest fire disaster in Canadian history.15
Hundreds of firefighters from across Canada worked for weeks to bring the fire under control. On August 17, 2024, the fire was declared "held." At 32,000 ha, it was the largest fire recorded in Jasper National Park since 1889.16,17
Wildland area burned and number of fires in Canada, 2000–20242–3

Graph summary
The area burned and the number of wildland fires per year in Canada from 2000 to 2024.
| Year | Area burned (hectares) | Number of fires |
|---|---|---|
| 2000 | 636,645 | 5,403 |
| 2001 | 653,525 | 7,778 |
| 2002 | 2,763,605 | 7,878 |
| 2003 | 2,168,503 | 8,271 |
| 2004 | 3,183,198 | 6,490 |
| 2005 | 1,686,944 | 7,455 |
| 2006 | 2,100,736 | 9,755 |
| 2007 | 1,785,467 | 6,919 |
| 2008 | 1,664,926 | 6,239 |
| 2009 | 762,736 | 7,146 |
| 2010 | 3,179,209 | 7,319 |
| 2011 | 2,397,847 | 4,679 |
| 2012 | 1,811,745 | 7,919 |
| 2013 | 4,268,500 | 6,256 |
| 2014 | 4,545,658 | 5,020 |
| 2015 | 3,908,377 | 7,034 |
| 2016 | 1,319,604 | 5,267 |
| 2017 | 3,589,432 | 5,658 |
| 2018 | 2,326,357 | 7,111 |
| 2019 | 1,786,214 | 4,062 |
| 2020 | 218,263 | 4,014 |
| 2021 | 4,078,894 | 6,710 |
| 2022 | 1,576,207 | 5,658 |
| 2023 | 17,606,547 | 6,837 |
| 2024 | 5,374,344 | 5,844 |
Why is this indicator important?
- Wildland fires can damage or destroy homes and businesses, trigger evacuations, and disrupt people's lives and livelihoods. However, forest fires are a natural part of forest ecosystems; they play an important and beneficial role in ecological succession, nutrient cycling, and in maintaining forest health and diversity.
- Smoke from wildland fires can travel far, reducing air quality and visibility over large areas, affecting human health and safety.18 Exposure to wildland fire smoke has been shown to have serious and costly health consequences.
- More than $1 billion is spent annually on fire management.19
- Research suggests that the extent of losses and the number of evacuations that Indigenous communities experience could drastically increase in the coming decades, with consequences that include structural and cultural losses, land alterations, and social disruptions.
- Many First Nations reserves are in fire-prone forests and are particularly vulnerable to emergencies due to their remoteness, limited access, and limited ability to evacuate by road. Indigenous Peoples are also 30% more likely to be displaced and affected by the unforeseen outcomes of wildland fires.
What is the outlook?
The impacts of wildland fire, including property damage, evacuations, poor air quality, and fire management costs, have increased in recent years. Factors contributing to this increase include the following:
- more homes, businesses, and infrastructure in the wildland-urban interface
- more people living and working in forested areas, and visiting forested areas for recreation
- a buildup of flammable forest fuel from insect-caused mortality and decades of successful fire suppression
- increased prevalence of climatic conditions in areas of prolonged drought and high temperatures, which are conducive to fire ignition and spread
New forest mapping for better fire behaviour prediction
Wildland fires happen in Canada’s forests every year. Government agencies are developing state-of-the-art maps with cutting-edge science and technology and fire behaviour prediction tools to mitigate the impact of wildland fires and help Canadians live and work safely in fire-prone forest landscapes. The Canadian Forest Service is producing new forest fuel maps in collaboration with provincial and territorial partners. These maps help fire agencies produce better fire behaviour predictions, especially in northern forests where old maps were often unreliable.
Living with fire
Most forests in Canada are naturally prone to periodic burning. In fact, many forest ecosystems are shaped by fire and are healthiest when burned periodically. This reality is no comfort for Canadians who live in or near the forest. However, fire can be beneficial for the forest under the right conditions, but when a fire ignites during hot and dry weather conditions, it can get out of control in an instant. Once that happens, it tests the resilience of any communities in its path.
Predicting fire behaviour
Several factors govern fire behaviour. The Canadian Forest Fire Danger Rating System (CFFDRS)20 uses information on fuels, weather, topography, and time since ignition to predict how a fire will spread. This information can help answer key questions such as:
- How much fuel is there, and how dry is it?
- What wind direction will increase the fire severity, and which way will it spread?
- Will topography slow the fire down or allow it to accelerate?
- What insights from experimental burns and past fires can we integrate into computer simulations?
Our ability to predict fire behaviour is often limited by the quality of the fuel maps and weather data that we feed into the simulations. In some parts of Canada, the fuel maps have been the weakest piece of the puzzle.
Mapping forest fuel on the landscape
In managed forests, provincial and territorial governments and forest companies maintain detailed forest inventories using high-precision 3D digital aerial imagery and airborne light detection and ranging (LiDAR) technologies. These inventories are used, among other things, to produce maps categorizing the forest into fuel types. The CFFDRS recognizes the fuel types defined by the Canadian Forest Fire Behaviour Prediction (FBP) System.21,22 Each fuel type burns in characteristic ways. For example, a spruce stand may increase fire intensity and spread, whereas an aspen stand may reduce it. Fuel type maps are fed into fire-behaviour simulations that forecast:
- how a fire is likely to spread
- how it may travel across the landscape on subsequent days after ignition
- where the fire will burn hottest, and
- where less flammable vegetation will slow it down.
These forecasts can enable fire responders to apply the appropriate fire control tactics and are vital for planning community evacuations.
However, the quality of forecasts for northern forests have been limited by the quality of available fuel maps. The detailed maps created using forest inventory data for managed forests could not be produced the same way for unmanaged forests in the north. Although scientists had access to satellite imagery covering all forests, the data needed to convert the satellite data into forest fuel classes have been missing.
A new effort to produce better maps
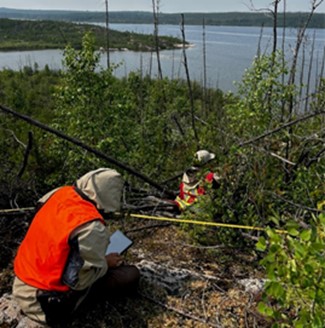
A Northern Forestry Centre field crew surveying a plot in northern Saskatchewan. A field crew member is inputting data through the NorthForM Survey123 application while the other field crew member is collecting tree information.
Photo credit: M.P. Ouellet-Pariseau
Recognizing this problem, the Government of Canada embarked on a 5-year effort to collect those missing data. Using a newly developed forest fuel sampling protocol,23 crews collected data at a series of strategically selected sites. Meanwhile, aircraft equipped with airborne laser scanning instruments were sent on special missions over the northern forests, including directly over the surveyed sites d by crews on the ground. As of August 2024, more than 600 sites have been measured and more than 40,000 kilometres of airborne LiDAR missions were flown, with more to come. These new data are used to build links between forest fuel measurements and what satellites see from above. These links are used to make better fuel type maps covering all Canada’s forests.
Data collection at this scale across northern Canada is an adventurous undertaking. The Canadian Forest Service of Natural Resources Canada teamed up with provincial and territorial government partners to get it done. Crews set out across difficult terrain to reach designated sites. Provincial agencies and universities are also beginning to measure forest fuels in this same way, meaning the data will be useful to more people. In addition, relationship-building between Indigenous Peoples and government teams creates possibilities for co-creation of future efforts.
Drier summers, more fuel, hotter fires
Fire has long been a powerful land stewardship tool in the hands of Indigenous Peoples. Settler societies outlawed cultural burning and, as fire suppression became increasingly successful due to advances in techniques, technology, and machinery, fuels began to accumulate on the landscape. This—combined with hotter, drier summers—set the stage for the intense fires that we are now experiencing too often.
Better maps, better science, better tools
High-quality fuel maps can help us deal with this problem. By running thousands of simulated fires through realistic virtual forest landscapes, we can identify the best fuel treatments for reducing fire hazard. For example, a community could be vulnerable to fire due to topography, prevailing wind direction, and features of nearby forest stand (e.g., a dense forest of mature spruce at the edge of town). That community’s fire risk can be reduced by pruning and spacing those spruce or by replacing them with a less flammable forest of aspen or birch.
Now that new maps have been produced by scientists and made available online,24 they must be kept current by updating annual changes, such as areas where fuel characteristics on the land had been altered by fire, insect outbreaks, or timber harvesting. Most provinces and territories have their own maps, but the federal maps are now available for areas that used to be poorly mapped, especially across the northern boreal forests. The federal maps are also useful for fires that threaten to cross from one province or territory to another and to support national assessment of wildland fire risk.
Looking to the future
Scientists are always seeking to improve the current state of fire behaviour models and are already looking to the future. Margins of error will only get smaller as climate change continues to make summers hotter and drier. Scientists are actively developing the next generation of the CFFDRS, aiming to characterize fuels with far richer detail than the current FBP system allows.25 This new system will forecast fire behaviour in a wider array of fuel conditions and structures, offering improved adaptability to modern forestry practices.
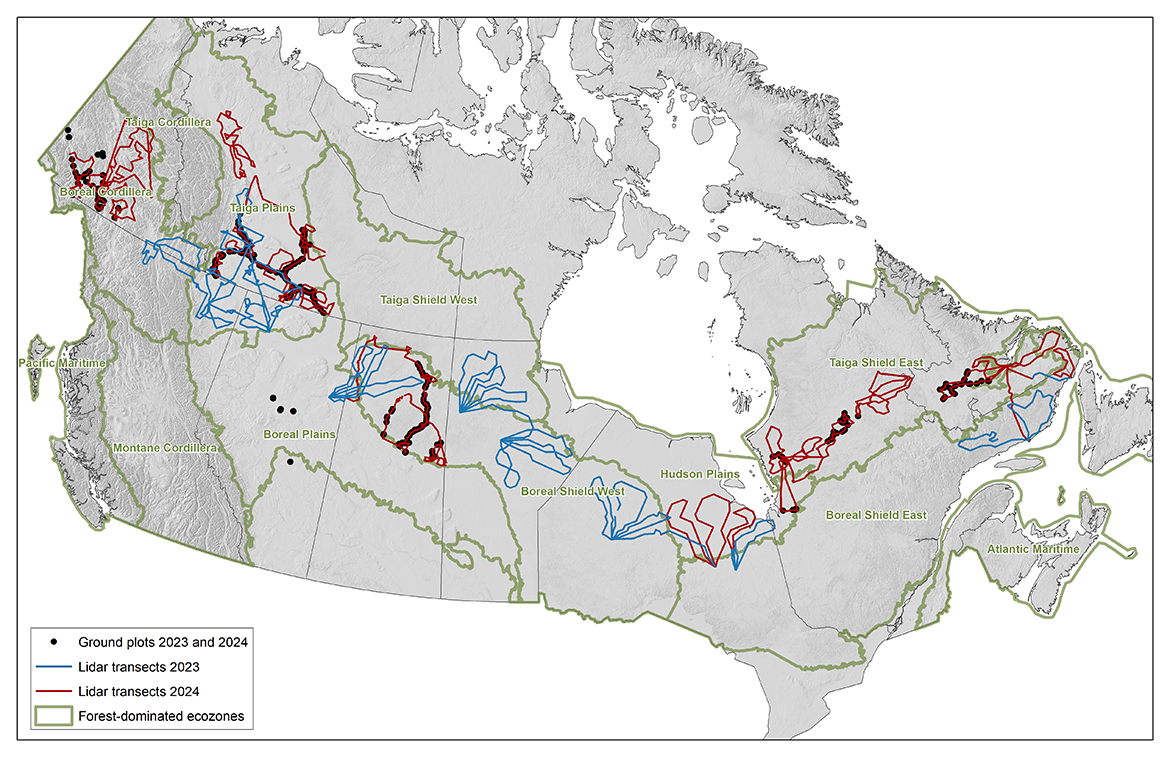
Ground plot and airborne light detection and ranging (LiDAR) sample locations collected in 2023 and 2024. Approximately 650 ground plots were placed within 43,000 km of LiDAR flight paths. Additional ground plot and LiDAR data will be collected in 2025.
Sources and information
- National Fire Situation Report for September 25, 2024. Canadian Interagency Forest Fire Centre; updated 2024 Sep 25. https://ciffc.net/situation/2024-09-25
- National Forestry Database. Forest area burned and number of forest fires. Natural Resources Canada; updated 2023 Feb 2. http://nfdp.ccfm.org/en/data/fires.php
- Canadian Wildland Fire Information System (CWFIS) database: metadata: National Fire Database: Agency provided fire locations (point data). Natural Resources Canada; accessed 2025 May 20. https://cwfis.cfs.nrcan.gc.ca/datamart/metadata/nfdbpnt
- CWFIS Datamart: metadata: National burned area composite. Natural Resources Canada; accessed 2025 May 14. https://cwfis.cfs.nrcan.gc.ca/datamart/metadata/nbac
- Burrows WR, Kochtubajda B, Fricska G. Cloud-to-ground lightning trends in Canada and regions of the United States north of 40°N 1999–2023. Atmos-Ocean. 2025;63(2):125–146. https://doi.org/10.1080/07055900.2025.2500648
- Government Operations Centre. Cyclical Events National Common Operating Picture – 06 Aug 2024.
- Operation LENTUS. National Defense; updated 2025 Jul 14. https://www.canada.ca/en/department-national-defence/services/operations/military-operations/current-operations/operation-lentus.html
- Shingler B. It’s the middle of winter, and more than 100 wildfires are still smouldering. Canadian Broadcasting Corporation (CBC) News; updated 2024 Feb 12. https://www.cbc.ca/news/climate/wildfires-zombie-fires-canada-bc-alberta-1.7119851
- Overwintering fires. BC Wildfire Service; accessed 2025 May 20. https://blog.gov.bc.ca/bcwildfire/overwintering-fires/
- Mubarik MN. NWT plans for early start to wildfire season, as holdover fires smoulder underground. CBC News; accessed 2025 May 12. https://www.cbc.ca/news/canada/north/overwintering-fires-burning-1.7122998
- North American drought monitor maps. National Centers for Environmental Information; accessed 2025 April 9. https://www.ncei.noaa.gov/access/monitoring/nadm/maps
- Evacuations list. CWFIS Portal (internal site); accessed 2025 May 20.
- Boynton S. Jasper wildfire: here’s how flames engulfed a town. Global News; updated 2024 Jul 25. https://globalnews.ca/news/10643218/jasper-wildfire-timeline/
- Timeline of the Jasper wildfire. Parks Canada; accessed 2025 May 14. https://parks.canada.ca/pn-np/ab/jasper/visit/feu-alert-fire/feudeforet-jasper-wildfire/chronologie-timeline
- Clarkin A. Jasper wildfire damage now estimated at $1.23B. CBC News; updated 2025 Jan 29. https://www.cbc.ca/news/canada/edmonton/jasper-wildfire-insurance-estimate-increases-1.7445217
- Frew N. The monster of Jasper. CBC News; accessed 2025 Aug 1. https://www.cbc.ca/newsinteractives/features/the-monster-of-jasper
- Tande GF. Fire history and vegetation pattern of coniferous forests in Jasper National Park, Alberta. Can J Bot. 1979;57:1912–1931. https://doi.org/10.1139/b79-241
- Matz CJ, Egyed M, et al. Health impacts analysis of PM2.5 from wildfire smoke in Canada (2013–2015, 2017–2018). Sci Total Environ. 2020;725:138506. https://doi.org/10.1016/j.scitotenv.2020.138506
- Fighting and managing wildfires in a changing climate. Natural Resources Canada; accessed 2025 Sept 9. https://natural-resources.canada.ca/forest-forestry/wildland-fires/fighting-managing-wildfires-changing-climate-program
- Canadian Forest Fire Danger Rating System (CFFDRS). Canadian Wildland Fire Information System; accessed 2025 May 8. https://cwfis.cfs.nrcan.gc.ca/background/summary/fdr
- Development and structure of the Canadian Forest Fire Behaviour Prediction System. Forestry Canada; 1992. Information Report ST-X-3. https://ostrnrcan-dostrncan.canada.ca/entities/publication/27d3ea09-fd84-4653-a22e-598cc597400c
- Wotton BM, Alexander ME, Taylor SW. Updates and revisions to the 1992 Canadian Forest Fire Behaviour Prediction System. Natural Resources Canada; 2009. Information Report GLC-X-10. https://ostrnrcan-dostrncan.canada.ca/entities/publication/49d9ed32-04e4-41f4-9c0e-b9a9133b41e4
- Boucher et al. Field guide: sampling fuels in the context of the next-generation Canadian Forest Fire Danger Rating System, version 1.1. Natural Resources Canada; 2024. https://nfi.nfis.org/resources/others/Field_Guide_of_NG_Protocol_2024_v1.1_en.pdf
- The Canadian Forest Fire Danger Rating System Fire Behaviour Prediction Fuel Types 2024, 30 metres spatial resolution map. Government of Canada; accessed 2025 May 8. https://search.open.canada.ca/openmap/4e66dd2f-5cd0-42fd-b82c-a430044b31de
- An overview of the next generation of the Canadian Forest Fire Danger Rating System. Natural Resources Canada; 2021 Jan 1 [updated 2025 Jun 17]. Information Report GLC-X-26. https://osdp-psdo.canada.ca/dp/en/search/metadata/NRCAN-CFS-1-40474
Emissions occur when carbon stocks move from a forest carbon pool into the atmosphere. Emissions can come from both the managed forest and the harvested wood products pools.
Removals occur when carbon moves from the atmosphere into a forest carbon pool, such as when carbon moves from the atmosphere to tree biomass through photosynthesis.2
Carbon transfers occur when carbon stocks are moved between forest carbon pools, for example, from the managed forest to the harvested wood products pool.2
GHG flux is the net balance of emissions, removals, and carbon transfers. Positive GHG flux values indicate carbon losses, whereas negative GHG flux values indicate carbon gains.2
Indicator: forest greenhouse gas fluxes
In 2023, total net greenhouse gas (GHG) flux—the sum of all emissions, removals, and carbon transfers reported in carbon dioxide equivalent (CO2e)—from Canada’s managed forests and forest products was about 1,138 million tonnes.1 This total net GHG flux value is calculated by adding net GHG fluxes caused by human activities to net GHG flux attributed to natural disturbances and subsequent regeneration in Canada’s managed forests.
In 2023, human activities in Canada’s managed forests, including the use and disposal of forest products, accounted for a net GHG flux of about 20.2 million tonnes, whereas natural disturbances and subsequent natural regeneration accounted for a net GHG flux of about 1,118 million tonnes.1
- The burned area by wildland fires in 2023 was the largest in recorded Canadian history resulting in unprecedented emissions: In 2023, 7.9 million hectares (ha) in the managed forests were burned in wildland fires releasing 1,070 million tonnes of CO2e.1 This is more burned area than the sum of the 4 highest years of wildland fires prior. The previous record for wildland fire emissions from the managed forests was 292 million tonnes, which occurred in 2021.1
- Recent high emissions from wildland fires in the managed forests are no longer offset by forest regrowth from previous wildland fires, resulting in net emissions into the atmosphere.
In the 5 years prior to 2023, the GHG flux from human activities in Canada’s managed forests ranged from 20 to 38 million tonnes, whereas the GHG flux from natural disturbances and subsequent regeneration in Canada’s managed forests ranged from 3 to 294 million tonnes.1
Canada takes an approach that distinguishes net GHG fluxes in the managed forests into 2 components:
- Those under the influence of human activities
- Those associated with natural disturbances beyond human control1
Human activities in the managed forests include forest inventory and resource assessment, harvesting, thinning, burning, site preparation, regeneration, stand tending, fertilization, weeding, fire suppression and prevention, and pest management. These decisions have an effect on the total carbon stored on the landscape regardless of the stand origin. These decisions and subsequent actions, including when and where to harvest, are part of sustainable forest management.
To improve transparency, Canada's 2025 National GHG Inventory Report includes a new section on emissions associated with harvesting activities, both within the forest and additional sectors (see Chapter 2, Table 2–11).1 The new table presents information on forest harvesting that is normally reported across multiple sectors.
Net greenhouse gas (GHG) flux in Canada's managed forests: all areas, 1990–20231

The total net emissions and removals from Canada’s managed forests, considering both human activities and natural disturbances, were about 1,139 million tonnes of CO2e in 2022, making the forests net source in 2023.
Graph summary
The net greenhouse gas (GHG) flux and the area disturbed per year in Canada’s managed forests for all area types from 1990 to 2023.
| Year | Area disturbed by insects | Area of forestry activities | Area of firewood harvest | Area burned | Net greenhouse gas flux (megatonnes of CO2 equivalent per year) |
|---|---|---|---|---|---|
| 1990 | 4.2 | 1.0 | 0.2 | 0.2 | -81.5 |
| 1991 | 1.7 | 0.9 | 0.2 | 0.6 | -41.3 |
| 1992 | 1.1 | 1.1 | 0.3 | 0.1 | -82.8 |
| 1993 | 1.1 | 1.0 | 0.3 | 0.6 | -31.2 |
| 1994 | 2.0 | 1.0 | 0.3 | 0.5 | -23.7 |
| 1995 | 1.8 | 1.1 | 0.3 | 2.0 | 154.7 |
| 1996 | 1.7 | 1.1 | 0.3 | 0.6 | -12.1 |
| 1997 | 1.9 | 1.2 | 0.4 | 0.1 | -54.9 |
| 1998 | 2.5 | 1.1 | 0.3 | 1.5 | 147.6 |
| 1999 | 3.6 | 1.2 | 0.3 | 0.6 | 21.4 |
| 2000 | 3.5 | 1.2 | 0.2 | 0.1 | -34.7 |
| 2001 | 7.6 | 1.2 | 0.3 | 0.2 | -21.9 |
| 2002 | 9.8 | 1.3 | 0.4 | 1.1 | 106.1 |
| 2003 | 12.8 | 1.2 | 0.4 | 0.7 | 75.1 |
| 2004 | 7.2 | 1.4 | 0.3 | 0.9 | 172.7 |
| 2005 | 9.7 | 1.4 | 0.3 | 0.6 | 93.6 |
| 2006 | 12.1 | 1.2 | 0.3 | 0.7 | 110.1 |
| 2007 | 10.4 | 1.1 | 0.4 | 0.7 | 103.5 |
| 2008 | 8.3 | 0.9 | 0.5 | 0.4 | 53.3 |
| 2009 | 5.5 | 0.8 | 0.5 | 0.4 | 71.7 |
| 2010 | 5.5 | 1.0 | 0.5 | 0.9 | 144.6 |
| 2011 | 4.8 | 1.1 | 0.4 | 1.1 | 169.8 |
| 2012 | 4.3 | 1.1 | 0.4 | 0.9 | 138.6 |
| 2013 | 5.1 | 1.1 | 0.5 | 0.5 | 74.3 |
| 2014 | 7.3 | 1.1 | 0.5 | 1.3 | 197.7 |
| 2015 | 8.0 | 1.1 | 0.5 | 2.2 | 294.2 |
| 2016 | 8.2 | 1.1 | 0.5 | 0.7 | 133.0 |
| 2017 | 8.2 | 1.1 | 0.4 | 1.5 | 254.8 |
| 2018 | 8.5 | 1.1 | 0.5 | 1.4 | 287.8 |
| 2019 | 9.4 | 1.1 | 0.4 | 1.1 | 188.5 |
| 2020 | 12.6 | 1.1 | 0.4 | 0.1 | 34.5 |
| 2021 | 10.9 | 1.0 | 0.4 | 2.3 | 318.3 |
| 2022 | 9.7 | 0.9 | 0.4 | 0.7 | 107.2 |
| 2023 | 9.4 | 1.0 | 0.4 | 7.9 | 1.138.5 |
Net greenhouse gas (GHG) flux in Canada's managed forests: areas subject to human activities, 1990–20231

Human activities in Canada’s managed forests, such as harvesting, slash pile burning, prescribed burning, regeneration, and firewood collection, as well as the use and disposal of harvested wood products, were a net source of about 20 million tonnes of CO2e in 2023.
Graph summary
The net greenhouse gas (GHG) flux and the area disturbed per year in Canada’s managed forests for areas subject to human activities from 1990 to 2023.
| Year | Area of forestry activities | Area disturbed by low mortality insects | Area of firewood harvest | Net greenhouse gas flux (megatonnes of CO2 equivalent per year) |
|---|---|---|---|---|
| 1990 | 1.0 | 2.5 | 0.2 | 40.2 |
| 1991 | 0.9 | 1.3 | 0.2 | 42.3 |
| 1992 | 1.1 | 1.0 | 0.3 | 50.9 |
| 1993 | 1.0 | 1.0 | 0.3 | 55.2 |
| 1994 | 1.0 | 1.7 | 0.3 | 56.9 |
| 1995 | 1.1 | 1.5 | 0.3 | 67.6 |
| 1996 | 1.1 | 1.5 | 0.3 | 56.7 |
| 1997 | 1.2 | 1.7 | 0.4 | 57.5 |
| 1998 | 1.1 | 2.1 | 0.3 | 45.1 |
| 1999 | 1.2 | 2.2 | 0.3 | 57.1 |
| 2000 | 1.2 | 1.1 | 0.2 | 66.0 |
| 2001 | 1.2 | 4.3 | 0.3 | 43.0 |
| 2002 | 1.3 | 5.7 | 0.4 | 56.5 |
| 2003 | 1.2 | 7.5 | 0.4 | 50.3 |
| 2004 | 1.4 | 4.7 | 0.3 | 78.4 |
| 2005 | 1.4 | 4.5 | 0.3 | 81.4 |
| 2006 | 1.2 | 5.0 | 0.3 | 65.6 |
| 2007 | 1.1 | 3.9 | 0.4 | 57.1 |
| 2008 | 0.9 | 3.2 | 0.5 | 53.0 |
| 2009 | 0.8 | 3.5 | 0.5 | 40.3 |
| 2010 | 1.0 | 4.2 | 0.5 | 55.4 |
| 2011 | 1.1 | 3.6 | 0.4 | 51.2 |
| 2012 | 1.1 | 3.1 | 0.4 | 44.6 |
| 2013 | 1.1 | 3.7 | 0.5 | 47.5 |
| 2014 | 1.1 | 4.7 | 0.5 | 44.0 |
| 2015 | 1.1 | 6.0 | 0.5 | 48.2 |
| 2016 | 1.1 | 6.9 | 0.5 | 38.2 |
| 2017 | 1.1 | 6.6 | 0.4 | 36.5 |
| 2018 | 1.1 | 6.8 | 0.5 | 38.3 |
| 2019 | 1.1 | 8.1 | 0.4 | 24.6 |
| 2020 | 1.1 | 10.7 | 0.4 | 31.8 |
| 2021 | 1.0 | 9.6 | 0.4 | 24.7 |
| 2022 | 0.9 | 8.7 | 0.4 | 19.8 |
| 2023 | 1.0 | 8.4 | 0.4 | 20.2 |
Net greenhouse gas (GHG) flux in Canada's managed forests: areas subject to natural disturbances, 1990–20231

Emissions from natural disturbances display high interannual variability. In 2022, about 87 million tonnes of CO2e were emitted, and in 2023, about 1,118 million tonnes of CO2e were emitted.
Graph summary
The net greenhouse gas (GHG) flux and the area disturbed per year in Canada’s managed forests for areas subject to natural disturbances from 1990 to 2023.
| Year | Area burned | Area disturbed by high mortality insects | Net greenhouse gas flux (megatonnes of CO2 equivalent per year) |
|---|---|---|---|
| 1990 | 0.2 | 1.7 | -121.7 |
| 1991 | 0.6 | 0.5 | -83.6 |
| 1992 | 0.1 | 0.1 | -133.7 |
| 1993 | 0.6 | 0.1 | -86.4 |
| 1994 | 0.5 | 0.2 | -80.6 |
| 1995 | 2.0 | 0.3 | 87.1 |
| 1996 | 0.6 | 0.2 | -68.9 |
| 1997 | 0.1 | 0.3 | -112.4 |
| 1998 | 1.5 | 0.5 | 102.5 |
| 1999 | 0.6 | 1.4 | -35.7 |
| 2000 | 0.1 | 2.5 | -100.7 |
| 2001 | 0.2 | 3.3 | -64.9 |
| 2002 | 1.1 | 4.1 | 49.6 |
| 2003 | 0.7 | 5.4 | 24.8 |
| 2004 | 0.9 | 2.5 | 94.3 |
| 2005 | 0.6 | 5.2 | 12.1 |
| 2006 | 0.7 | 7.1 | 44.5 |
| 2007 | 0.7 | 6.5 | 46.4 |
| 2008 | 0.4 | 5.1 | 0.3 |
| 2009 | 0.4 | 2.0 | 31.4 |
| 2010 | 0.9 | 1.4 | 89.2 |
| 2011 | 1.1 | 1.1 | 118.5 |
| 2012 | 0.9 | 1.3 | 94.1 |
| 2013 | 0.5 | 1.3 | 26.9 |
| 2014 | 1.3 | 2.6 | 153.7 |
| 2015 | 2.2 | 2.1 | 246.0 |
| 2016 | 0.7 | 1.4 | 94.8 |
| 2017 | 1.5 | 1.7 | 218.3 |
| 2018 | 1.4 | 1.6 | 249.4 |
| 2019 | 1.1 | 1.2 | 164.0 |
| 2020 | 0.1 | 1.9 | 2.7 |
| 2021 | 2.3 | 1.3 | 293.6 |
| 2022 | 0.7 | 1.0 | 87.4 |
| 2023 | 7.9 | 0.9 | 1,118.3 |
Why is this indicator important
- Canada’s forests play a key role in the global carbon cycle due to their large area and high carbon stocks. Having a clear understanding of the emissions, removals, and carbon transfers stemming from the forest is important for informing climate change policy.
- Information on carbon fluxes in the managed forests enables prioritization of actions to reduce emissions and increase sequestration. For example, management activities that increase forest resilience to fire and insect outbreaks can help reduce emissions.
What is the outlook?
- The impacts of climate change on Canada’s future forest GHG balance are difficult to predict but will be characterized by annual variation, primarily due to natural disturbances. In Canada’s managed forests, despite showing annual fluctuation, the trend in annual burned area has increased since 1990 and most of the area burned was ignited by lightning strikes.3 Wildland fire emissions in the managed forests have also shown an upward trend that is expected to continue in the future.
- Using Canada’s Carbon Monitoring, Accounting, and Reporting System, wildland fire emissions in the unmanaged forests are currently not reported due to a lack of data and access to remote areas.4 Efforts are underway to better understand Canada’s unmanaged forest emissions and removals. Remote-sensing technologies provide new opportunities to estimate wildland fire emissions in unmanaged forests.4
- Emissions from human activities in Canada’s managed forests have been on a downward trend predominately due to a reduction in wood harvest rates since 2005. In particular, the growing incidence of natural disturbance and wildland fire could lead to decisions to further curtail harvest in the future.
Sources and information
- National Inventory Report 1990–2023: Greenhouse gas sources and sinks in Canada. Environment and Climate Change Canada; 2025 [accessed April 30, 2025]. https://publications.gc.ca/collections/collection_2025/eccc/En81-4-2023-1-eng.pdf (See Note a)
- Is Canada’s forest a carbon sink or source? Natural Resources Canada; 2024. Updated 2025 Mar. https://publications.gc.ca/collections/collection_2007/nrcan-rncan/Fo93-1-2-2007E.pdf
- Canadian National Fire Database. Natural Resources Canada; accessed 2025 Aug 5. https://cwfis.cfs.nrcan.gc.ca/ha/nfdb
- How does Canada report greenhouse gas emissions from wildfire? Science-Policy Notes, 3. Natural Resources Canada; 2024. https://ostrnrcan-dostrncan.canada.ca/entities/publication/5b4263b4-6beb-4908-98fe-1aa3af8a8a7f [accessed 2025 Aug 5].
Notes
- The data presented in this indicator is estimated annually using Natural Resources Canada—Canadian Forest Service’s National Forest Carbon Monitoring, Accounting, and Reporting System. The system integrates information about forest inventories, forest growth, natural disturbances, forest management activities, and land-use change to evaluate carbon stocks, stock changes, and emissions of non–carbon dioxide GHGs (carbon monoxide, methane, and nitrous oxide) in Canada’s managed forests. The system estimates changes in biomass, woody debris, litter, and soil carbon pools. The system also estimates transfers to the forest product subsector and tracks harvested wood products manufactured from wood harvested in Canada since 1900, including carbon storage and emissions resulting from these products regardless of where in the world these emissions occur. The State of Canada’s Forests: Annual Report describes GHG emissions from Canada’s managed forests. This means the GHG emissions estimates differ from values presented in Canada’s National Inventory Report (NIR),1 which addresses international requirements to report on emissions and removals from human activities in the managed forests. Differences in the reported estimates between the 2 reports are driven primarily by 4 differences in reporting methods:
- The State of Canada’s Forests: Annual Report includes natural disturbance emissions in the total GHG emissions estimate.
- The GHG emissions totals presented in the State of Canada’s Forests: Annual Report include carbon monoxide emissions, which is presented as a separate line item in Canada’s NIR.
- Emissions from bioenergy sourced from croplands and urban lands are excluded from the State of Canada’s Forests Annual Report but included in the NIR.
- Methane and nitrous oxide emissions from bioenergy are included in the totals in the State of Canada’s Forests Annual Report but are reported by the energy sector in the NIR.
Canada’s 2025 National GHG Inventory Report includes a revision to its forest carbon reporting approach to improve transparency, which focuses on revising how carbon transfers in and out of the various pools involved in the forest sector (forest land, forest products) are represented in the report. The change in approach stems from recommendations of the 2023 United Nations Framework Convention on Climate Change’s technical review of Canada’s 2023 NIR. This change aims to improve Canada’s consistency with the Intergovernmental Panel on Climate Change (IPCC) guidelines.
The revised reporting approach does not change the net carbon balance of the forest sector. Instead, it changes where carbon transfers and emissions occur among reporting categories for the managed forests and wood products within Canada’s NIR. In particular, carbon transfers to the harvested wood products pool are now reported in the source land category, such as the managed forests. As a result, the GHG flux of the managed forests is reported as the sum of its (1) carbon dioxide removals from the atmosphere, (2) GHG emissions from forest management activities and decomposition, and (3) transfers of carbon to the wood products pool. Accordingly, the GHG flux of harvested wood products is reported as the difference between annual carbon inputs of new products into the pool and outputs of emissions from the burning or disposal of wood products.
Additional information
“Managed land” refers to areas where human interventions and practices have been applied to perform production, ecological or social functions. It includes notably all lands managed for producing wood products or wood-based bioenergy, protecting against natural disturbances or conserving ecological values and providing recreational opportunities. Within those managed lands, “forest” includes all areas of 1 hectare or more having the potential to develop forest cover, with a minimum crown closure of 25% and a minimum tree height of 5 metres at maturity in situ.
Managed forest lands are divided into an anthropogenic partition (lands predominantly influenced by human activities) and a natural disturbance partition (lands predominantly influenced by large-scale natural disturbances). When stand-replacing wildland fires affect stands, the emissions and subsequent removal during post-fire regrowth are reported as part of the “natural disturbance partition.” After regrowing stands reach commercial maturity (45–100 years), the emissions and removal are reported in the “anthropogenic partition.” Stands affected by partial disturbances that cause more than 20% mortality are reported in the natural disturbance partition until the above-ground live tree biomass reaches pre-disturbance levels.
The first figure presented in this indicator includes the entire managed forests, whereas the second figure includes only the anthropogenic partition (areas affected by management and by insect disturbances causing 20% or less tree mortality). The third figure includes only the natural disturbance partition (areas affected by stand-replacing wildland fires or insect disturbances causing greater than 20% tree mortality). The first figure reports the sum of the second and third figures in this indicator.
Harvested wood product emissions are estimated using the “simple decay” approach of the IPCC and include annual end-of-life emissions from all wood harvested in Canada since 1900 and used to produce products or energy anywhere in the world. In contrast, the emissions from other Canadian natural resources (e.g., oil and gas) are reported by the country in which they are consumed. Transfers of wood and paper products to landfills are assumed to instantly oxidize as carbon dioxide.
Carbon transfers out, including emissions, bear a positive sign. Transfers in, including removals, bear a negative sign. These sign conventions align with international reporting standards.
Carbon budget model. Natural Resources Canada; updated 2025 Jul 11. https://natural-resources.canada.ca/climate-change/climate-change-impacts-forests/carbon-budget-model
Inventory and land-use change: forest inventory. Natural Resources Canada; updated 2025 Jun 10. https://natural-resources.canada.ca/climate-change/forest-carbon/inventory-land-use-change
Kurz WA, Hayne S et al. Quantifying the impacts of human activities on reported greenhouse gas emissions and removal in Canada’s managed forest: conceptual framework and implementation. Can J For Res. 2018;48(10):1227–1240. https://doi.org/10.1139/cjfr-2018-0176
Kurz WA, Shaw CH et al. Carbon in Canada’s boreal forest: a synthesis. Environ Rev. 2013;21(4):260–292. https://doi.org/10.1139/er-2013-0041
Lemprière TC, Kurz WA et al. Canadian boreal forests and climate change mitigation. Environ Rev. 2013;21(4):293–321. https://doi.org/10.1139/er-2013-0039
Metsaranta JM, Shaw CH et al. Uncertainty of inventory-based estimates of the carbon dynamics of Canada’s managed forest (1990–2014). Can J For Res. 2017;47(8):1082–1094. https://doi.org/10.1139/cjfr-2017-0088
Ogle SM, Domke G et al. Delineating managed land for reporting national greenhouse gas emissions and removal to the United Nations Framework Convention on Climate Change. Carbon Balance Manag.2018;13(9). https://doi.org/10.1186/s13021-018-0095-3
Stinson G, Kurz, WA et al. An inventory-based analysis of Canada’s managed forest carbon dynamics, 1990 to 2008. Glob Chang Biol. 2011;17(6):2227–2244. https://doi.org/10.1111/j.1365-2486.2010.02369.x
How do forests benefit Canadians?
Forests are central to the identities, health, cultures, environment, and economy of Canada; forests provide jobs, absorb carbon, support biodiversity, and hold social and cultural importance. They also offer opportunities for recreation and for innovation in the growing bioeconomy.
An integral part of Canada’s communities, health, cultures, and identities
More than one-third of people in Canada reside in or near forests, highlighting the significance of forests in the daily lives and well-being of Canadians. Forests—including urban forests (e.g., trees, forests, and green spaces inside cities1)—enhance quality of life by mitigating mental stresses;2 supporting cultural, spiritual, and livelihood connections; and serving as tangible links between past, present, and future generations, traditions, and the land. Forests also provide recreational and ecotourism opportunities for people living in both rural and urban areas.3
Forests are fundamental to the livelihoods, cultures, and economies of many Indigenous Peoples in Canada. As of 2021, nearly 1 million First Nations, Inuit, and Métis people live in or near forests,4–6 and Indigenous and treaty rights are increasingly reflected in forest policy and forest management practices—a critical step for advancing Indigenous governance and self-determination.7 Sustainable forest use that is rooted in Indigenous knowledge systems can support ceremonial and subsistence practices, as well as boost economic prosperity.8
Culturally modified tree
Several Indigenous groups in Canada culturally modify trees. Culturally modified trees (CMTs) are living trees that have been visibly altered as part of cultural traditions. These modifications—such as bark stripping and planks—were made to create clothing, baskets, shelter, and other tools while allowing the trees to recover and be used again over generations. CMTs serve as enduring records of Indigenous land use, stewardship, and connection to the forest and are recognized as important cultural heritage resources.
Protecting Canada’s environment
Forests are far more than a collection of trees—they are complex ecosystems that also include soil, air, water, and all living organisms that depend on forests for survival.9 Forests provide several ecological functions that support climate mitigation and adaptation, such as carbon storage, nutrient cycling, water and air purification, and maintenance of wildlife habitat.10 At a global scale, forests help maintain Earth’s carbon balance by capturing carbon dioxide (CO2) from the atmosphere when they grow and releasing CO2 and other greenhouse gases (GHG) when they decay or burn. Soil in forest ecosystems is also critical for processing water, nutrients, and contaminants, and sustaining the overall health of forests—on which the production of fibre, food, and fuel depends.11
Forest products also offer sustainable solutions to meeting housing needs. For example, mass timber has lower manufacturing GHG emissions than other construction materials, while also providing long-term carbon storage. When combined with other cost-effective design choices, wood products can reduce the embodied carbon of buildings by up to 40%.12
A pillar of Canada’s economy
The forest sector includes forestry and logging, support activities for forestry, wood product manufacturing, and paper manufacturing. The forest sector is an important employer nationwide and contributes to the economic and social welfare of people in Canada. Forest sector employment is especially important in many rural and Indigenous communities, where it is often a key source of income. In 2021, more than 70,000 forest sector workers lived in rural communities, or about 40% of total forest sector workers. The forest sector also directly employs more than 11,000 Indigenous people and has a higher rate of Indigenous workers (6%) than in the labour force overall (4%).13
The forest sector also contributes to Canada’s gross domestic product (GDP). In 2024, nominal GDP was $30.7 billion, which represents a decrease of 1.1% compared with 2023.
Conventional forest products such as lumber, structural panels, pulp, paper, newsprint, tissue, and packaging remain foundational. However, wood also plays an expanding role in supporting domestic housing needs through innovative products like mass timber and prefabricated construction, which can offer economical and climate-friendly building solutions. Beyond these uses, harvest residues can be broken down into its core components—cellulose, hemicellulose, and lignin—to create a wide range of materials14 as well as bioenergy.15 For example, forest biomass-derived heat and electricity systems can help decarbonize industry and communities and offer a pathway to energy security, economic reconciliation, and self-determination for Indigenous communities.16
Sources and information
- Definition of urban forests. Tree Canada; accessed 2025 Sept 2. https://treecanada.ca/urban-forestry-guide/definition-of-urban-forests/
- Shan Y, Chen WY, Liu C. Urban forests as a strategy for transforming towards healthy cities. Urban For Urban Green. 2023;81:127871. https://doi.org/10.1016/j.ufug.2023.127871
- Forests: an integral part of our communities. Canadian Council of Forest Ministers; accessed 2025 Aug 5. https://www.ccfm.org/canadians-and-communities/forests-an-integral-part-of-our-communities/
- National Forest Inventory. Natural Resources Canada; accessed 2025 Aug 5. https://nfi.nfis.org/en/
- Statistics Canada. 2021 census of population. (special extraction, March 24, 2023). (See Notes a–b)
- Biodiversity, conservation, and Indigenous Peoples’ well-being. Natural Resources; updated 2025 Jan 10. https://natural-resources.canada.ca/natural-resources-indigenous-peoples/biodiversity-conservation-indigenous-peoples-well-being (See Notes a–b)
- Fifth report on Indigenous-held forest tenures. National Aboriginal Forestry Association; 2020 [accessed 2025 Aug 5]. https://www.nafaforestry.org/pdf/2020/
- Indigenous Peoples and forests. Canadian Council of Forest Ministers; accessed 2025 Aug 5. https://www.ccfm.org/canadians-and-communities/indigenous-peoples-and-forests/.
- Managing for diversity: how sustainable forest management conserves and protects Canada’s diverse forest values. Natural Resources Canada; updated 2025 Jan 11]. https://natural-resources.canada.ca/forest-forestry/state-canada-forests/managing-diversity-sustainable-forest-management-conserves-protects-canada-s-diverse-forest-values
- Forest ecosystem products and services. Natural Resources Canada; updated 2025 Jan 13. https://natural-resources.canada.ca/forest-forestry/sustainable-forest-management/forest-ecosystem-products-services
- Soil. Natural Resources Canada; updated 2025 Jan 13. https://natural-resources.canada.ca/forest-forestry/sustainable-forest-management/soil
- The mass timber roadmap: an integrated forest-to-buildings value chain. Forest Products Association of Canada; 2024 [accessed 2025 Aug 5]. https://www.fpac.ca/reports/the-mass-timber-roadmap
- Census 2021. EO3598 Table 2. Statistics Canada; updated 2023 Nov 15. https://www12.statcan.gc.ca/census-recensement/2021/dp-pd/prof/index.cfm
- Wood products: everywhere for everyone. National Resources Canada; updated 2025 Jan 13. https://natural-resources.canada.ca/forest-forestry/forest-industry-trade/wood-products-everywhere-everyone
- Forest bioenergy. Natural Resources Canada; 2025 [accessed 2025 Sept 8]. https://natural-resources.canada.ca/forest-forestry/forest-industry-trade/forest-bioenergy
- Clean Energy for Rural and Remote Communities Program. Natural Resources Canada; 2025 [accessed 2025 Sept 8]. https://natural-resources.canada.ca/funding-partnerships/clean-energy-rural-remote-communities-program
Notes
- Calculations were based on Statistics Canada’s 2021 census of population5 and Natural Resources Canada, Canadian Forest Service’s National Forest Inventory’s forested land cover.4
- Spatial (geographic information system) analysis used the 2 sources4,5 to calculate the percentage of forest cover by census subdivision. To be considered forested, a census subdivision needed to contain 25% or more of forested land cover. Populations residing within those forested census subdivisions are considered living in or near forests. Additionally, those sources were used to calculate how many First Nations, Inuit, and Métis people live in or near forests.
Indicator: forest sector employment
The forest sector is highly interconnected and dependent on each other, with sawmills acting as a crucial anchor. Demand for lumber supports upstream forestry and logging jobs, while by-products from lumber production supply downstream industries such as pulp and paper, wood-based panels and bioenergy. As a result, the closure of a sawmill can have ripple effects throughout the supply chain.
In 2024, Canada’s forest sector employed 194,040 people—a decrease of 2.6% from 2023.1 According to the latest census (2021), approximately 19% of forest sector workers are women, 13% are immigrants, 12% are visible minorities, and 6% are Indigenous.2 In 2021, more than 11,000 Indigenous Peoples worked in the forest sector.
- Following the post-pandemic rebound in 2021, employment in the forest sector has decreased over the last 3 years. Although employment in all subsectors decreased, the wood product manufacturing subsector recorded the largest decrease in employment at 3.3%, reflecting weak market conditions throughout the year.
- Employment in support activities for forestry (which is part of in-forest activities and includes forest conservation and reforestation services, timber inventory, and fire-fighting activities) saw the smallest decrease in employment at 0.6%. Despite the decrease, employment in support activities in forestry has been growing over the last decade, reflecting the increased importance of forest maintenance and wildland fire management.
Direct employment in Canada's forest sector, 2014–20241

Graph summary
Comparison of the total number of direct jobs in the Canadian forest sector by subsector for each year from 2014 to 2024.
| Year | In-forest activities | Pulp and paper product manufacturing | Wood product manufacturing |
|---|---|---|---|
| 2014 | 53,005 | 58,150 | 93,575 |
| 2015 | 53,650 | 57,775 | 95,150 |
| 2016 | 55,635 | 54,815 | 100,315 |
| 2017 | 55,180 | 57,940 | 103,490 |
| 2018 | 56,360 | 58,320 | 102,130 |
| 2019 | 55,350 | 55,325 | 100,250 |
| 2020 | 50,330 | 50,255 | 89,660 |
| 2021 | 54,575 | 51,870 | 100,575 |
| 2022 | 53,380 | 52,670 | 100,345 |
| 2023 | 55,255 | 51,165 | 92,775 |
| 2024 | 54,565 | 49,785 | 89,690 |
Why is this indicator important?
- The forest sector is an important employer in Canada and contributes to the economic and social well-being of the country and of its communities.
- Forest sector employment is particularly important for many rural and Indigenous communities, where it is often a key source of jobs and income.
What is the outlook?
- Near-term economic uncertainty related to trade tensions and monetary policy as well as challenges related to the availability of economic timber, particularly in British Columbia, may negatively affect employment in the forest sector.
- The sector’s continued shift toward improved energy efficiency, reduced fibre waste, mitigated environmental impacts, and increased production of higher-value products will create new forest sector opportunities for Canadians.
- New housing initiatives to address affordability challenges could increase demand for wood-based construction material and help strengthen forest sector employment.
- Diversification through secondary and tertiary wood products (advanced bioproducts, mass timber for construction, modular components for housing) can secure existing jobs, create new and direct employment opportunities, and generate higher-value business segments.
Sources and information
- Statistics Canada. Table 36-10-0489-01. Labour statistics consistent with the System of National Accounts (SNA), by job category and industry; 2020–2024 [updated 2025 Aug 5]. https://doi.org/10.25318/3610048901-eng (See Notes a–d)
- Statistics Canada. 2021 census of the population. (special extraction, received March 10, 2023) https://www12.statcan.gc.ca/census-recensement/index-eng.cfm?DGUID=2021A000011124 (See Note e)
- Indian Act, RSC 1985, c I-5, s 5(1). Government of Canada;1985 [updated 2025 Aug 28]. https://laws-lois.justice.gc.ca/eng/acts/i-5/page-1.html#h-331794 (See Note f)
Notes
- Data include North American Industry Classification System 113, 1153, 321, and 322.
- Employment includes jobs held by people employed directly in the following industries: forestry and logging, support activities for forestry, pulp and paper product manufacturing, and wood product manufacturing.
- The Canadian Forest Service prefers to use employment data from Statistics Canada’s SNA because these data are linked to the underlying framework used to compile the Canadian System of National Accounts.
- Data are based on the 2024 spring SNA annual data release. SNA employment estimates are often revised in future releases. Year-over-year comparisons are calculated with the most recent estimates available.
- Values refer to the number of people employed.
- “Indigenous” refers to people who are First Nations, Inuit, and/or Métis including individuals who are registered under the Indian Act3 and/or are members of a First Nation or Indian Band.
Indicator: forest sector average earnings
Average employment earnings refer to the average net annual income per person directly employed in the forest sector, and excludes overtime pay.
In 2024, average employment earnings across the forest sector decreased by 1.2% from 2023 to approximately $55,800 annually1,2 (calculated in 2017 dollars).3 This is 4.5% lower than the highest point in the last 10 years, which was $58,400 in 2021.1,2 Although average earnings are volatile year over year, they have generally trended upward over the past decade, with average earnings 3.2% higher in 2024 than in 2014.1,2
- In 2024, average earnings decreased by 3.2% in wood product manufacturing subsector and 3.5% in forestry and logging compared with 2023.1,2 Weak lumber prices,4 low demand, rising operational costs due to inflation, and reduced availability of economic timber exerted downward pressure on companies’ revenues, prompting cost-cutting measures that have affected salaries.
- In contrast, the pulp and paper product manufacturing subsector experienced an average earnings increase of 2.6% between 2023 and 2024.1,2 Salary increases were attributed to growing global demand for pulp and sustainable packaging products amid ongoing challenges of attracting and retaining skilled workers.5,6 Advancements in mills efficiency and productivity require fewer but higher-skilled workers, with better-paying jobs, who can use more automated technology to support manufacturing processes.5,6
- Overall, average earnings in the forest sector remained slightly higher than those across the broader manufacturing industry. This trend was primarily supported by higher wages in the pulp and paper subsector.1,2
Average earnings in the forest sector compared with all manufacturing sectors in Canada, 2014–20241–3

Note: Average earnings are reported in this is indicator in real dollars (i.e., adjusted for inflation [in 2017 dollars]).
Graph summary
Comparison of average earnings in the forest sector by subsector and for all other manufacturing sectors in Canada for each year from 2014 to 2024.
| Year | Forestry and logging | Pulp and paper product manufacturing | Wood product manufacturing | All manufacturing |
|---|---|---|---|---|
| 2014 | 52,923 | 60,164 | 49,034 | 53,912 |
| 2015 | 55,612 | 65,080 | 50,391 | 55,139 |
| 2016 | 55,438 | 67,565 | 51,133 | 55,027 |
| 2017 | 54,713 | 64,353 | 54,109 | 54,097 |
| 2018 | 55,895 | 61,089 | 49,347 | 52,923 |
| 2019 | 56,285 | 67,684 | 49,983 | 54,107 |
| 2020 | 56,182 | 62,367 | 52,044 | 54,724 |
| 2021 | 56,435 | 66,531 | 52,296 | 54,131 |
| 2022 | 54,964 | 62,744 | 49,062 | 53,636 |
| 2023 | 56,233 | 62,288 | 50,808 | 53,682 |
| 2024 | 54,253 | 63,901 | 49,171 | 54,199 |
Why is this indicator important?
- In the forest sector, trends in the average employment earnings highlight the sector’s importance to the economy and to the social well-being of Canadians compared with other industries.
- Real wage growth (inflation-adjusted wage changes) reflects the change in actual purchasing power of forest sector employees.
What is the outlook?
- In the short-term to medium-term, efforts in Canada and the United States to increase residential construction—an important driver of demand for solid wood products—could support growth in the wood products manufacturing and forestry and logging subsectors. This could subsequently improve employment conditions, including average earnings.7,8
- To remain competitive and address the anticipated wave of retirements in the coming years, the sector may need to offer more attractive compensation to recruit and retain talent.
- In the longer term, increased productivity and continued growth, as well as emphasis on high-value products and the bioeconomy, could support high-skill, well-paid jobs.7,8
Sources and information
- Statistics Canada. Table 14-10-0204-01. Average weekly earnings by industry, annual;2020–2024 [updated 2025 Aug 5]. https://doi.org/10.25318/1410020401-eng (See Notes a–c)
- Statistics Canada. Table 14-10-0202-01. Employment by industry, annual; 2020–2024 [updated 2025 Aug 5]. https://doi.org/10.25318/1410020201-eng (See Notes b and c)
- Statistics Canada. Table 18-10-0005-01. Consumer Price Index, annual average, not seasonally adjusted; 2020–2024 [updated 2025 Aug 5]. https://doi.org/10.25318/1810000501-eng (See Notes b and c)
- Current lumber, pulp and panel prices. Government of Canada; updated 2025 Aug 27. https://natural-resources.canada.ca/domestic-international-markets/current-lumber-pulp-panel-prices
- Annual survey of manufacturing industry, 2023. Statistics Canada; published 2024 Dec 18. https://www150.statcan.gc.ca/n1/daily-quotidien/241218/dq241218c-eng.htm
- Explore the Canadian labour market. Canada Job Bank; updated 2025 Jan 14. https://www.jobbank.gc.ca/trend-analysis/job-market-reports (See Note d)
- ResourceWise’s 2025 forest products industry predictions. ResourceWise; accessed 2025. www.resourcewise.com
- Overview of Canada’s forest industry. Natural Resources Canada; updated 2025 Mar 12. https://natural-resources.canada.ca/our-natural-resources/forests/industry-and-trade/overview-canadas-forest-industry/13311
Notes
- Data exclude overtime.
- Starting in 2023, the average earnings were calculated using the Consumer Price Index rebased to 2017 dollars (previous years were compared with 2012 dollars).
- Prior to 2018, issues of The State of Canada’s Forests Annual Report calculated real average earnings using GDP at market prices as the measure of inflation. More recent issues use the Consumer Price Index (including volatile commodities) because it is a better indicator of the spending power of Canadians.
- Data are from Forestry and Forest Products sector North American Industry Classification System codes 113 (forestry and logging), 321 (wood product manufacturing), 322 (paper manufacturing), and 1153 (support activities for forestry) for each province.
Indicator: forest communities
Forests support the livelihoods of many Canadians and communities across the country—providing a rich source of environmental, economic, and cultural benefits in both rural and urban Canada. The forest sector provides local employment and creates opportunities for economic development, strengthening community self-reliance.
Indigenous Peoples are closely tied to Canada’s forests both geographically and culturally. According to the 2021 Census, nearly 1 million Indigenous Peoples live in or near forests, and more than 11,000 are employed in the forest sector.
- More than one-third of Canadians live in or near forested areas.1,2
- Forested areas are lands primarily covered by trees and related vegetation, including remote, rural, and some peri-urban regions.
- These areas are most prominent in provinces like British Columbia, Québec, and Ontario, which have the highest proportions of forest cover in Canada.
- There are more than 630 First Nations communities in Canada, with the majority living near and within the forests they depend on.3 In approximately 300 communities, the forest sector serves as a key source of employment and income.1
- These forest-reliant communities account for about 2% of the national population, or roughly 620,000 people.
Why is this indicator important?
- Forest-reliant communities in Canada are stewards of forested landscapes. They participate in sustainable forest management (SFM), monitor wildlife, and manage wildland fires. These activities are critical to the delivery of local forest mitigation and adaptation initiatives. Additionally, communities near forests rely heavily on the forest sector for employment and income. Any downturns in the sector affect not only its employees but the entire community’s social and economic well-being.
- Forests hold cultural significance for numerous First Nations, Inuit, and Métis communities, playing integral roles in their health and overall well-being, beyond economic benefits. Furthermore, they provide residents of forest-reliant communities with various environmental services and recreational opportunities.
What is the outlook?
- Climate change remains a critical threat to Canada’s forests, not because wildfires or pest outbreaks are new, but because they are becoming more frequent, intense, and widespread. Although these disturbances are part of natural forest cycles, their increasing scale is challenging the health and resilience of forest ecosystems. Forest-reliant communities will be relied upon for developing and implementing adaptive forest management practices and building resilient forest landscapes.
- A skilled and resilient workforce is essential for helping the forest sector adapt to changing market conditions and Canada’s transition to a low-carbon economy. Recruitment, training, and retention remain ongoing challenges, particularly in forest-reliant communities, where youth often migrate to urban centres and fewer workers are entering the sector due to a lack of diverse job opportunities and negative perceptions. Continuous efforts in recruitment, training, and retention are needed to sustain the sector. Strengthening local training pathways and promoting career opportunities in rural areas are key to sustaining the sector and supporting forest communities in their ability to adapt and thrive.
- Indigenous communities, especially those located in or near forested regions, can support climate adaptation, help address labour shortages, and bring renewed vitality to aging forest communities.
Sources and information
- 2021 census of population (special extraction, 2023 March 24). Statistics Canada; updated 2025 Jun 25. https://www12.statcan.gc.ca/census-recensement/index-eng.cfm (See Notes a–f)
- National Forest Inventory; accessed 2025 Sept 3. https://nfi.nfis.org/en/ (See Note e–f)
- First Nations. Government of Canada; updated 2025 May 22. https://www.rcaanc-cirnac.gc.ca/eng/1100100013791/1535470872302 (See Note f)
- Table 1.3: Number of census subdivisions by the Statistical Area Classification, 2021 Census. Statistics Canada; updated 2022 Nov 22. https://www12-2021.statcan.gc.ca/census-recensement/2021/ref/dict/tab/index-eng.cfm?ID=T1_3
Notes
- The forest community indicator is based on Statistics Canada’s census subdivisions. Statistics Canada defines a census subdivision as “the general term for municipalities (as determined by provincial/territorial legislation) or areas treated as municipal equivalents for statistical purposes (e.g., Indian reserves, Indian settlements, and unorganized territories).” Because there is no standardized definition of community across provinces and territories, using census subdivisions allows for a consistent approach in reporting over time. In 2021, Canada was divided into 5,161 census subdivisions.4
- In 2019, the Canadian Forest Service (CFS) adopted a new method for identifying communities that rely on economic activity from natural resource sectors. The method is based on the sector dependence index (SDI), a well-established approach to assess the relative importance of a given sector to local economies. In addition to considering the share of total income generated from the forest sector, CFS used the SDI to establish whether the forest sector provides a high number of jobs relative to the average Canadian community. The calculations also determine if there are many other sectors that are also an important source of jobs for residents.
- In 2018, The State of Canada’s Forests: Annual Report noted that the forest sector was a major source of income for 105 census subdivisions in Canada. In 2019, following the new method, it reported that 300 Canadian communities rely on the forest sector for a significant share of economic activity.
- Employment data from Statistics Canada’s 2021 census of population refers to the number of people employed, as opposed to the size of the labour force (which also includes unemployed individuals).
- To be considered forested, a census subdivision needs to contain 25% or more of forested land cover. Populations residing within those forested census subdivisions are considered living in or near forests.
- CFS based the calculation of Number of Indigenous Peoples and Canadians that live in or near forests on a spatial (geographic information system) analysis. The 2 sources mentioned in this section (National Forest Inventory and Statistics Canada) were used to calculate the percentage of forest cover by census subdivision.
How does the forest sector contribute to the economy?
The forest sector is an important contributor to Canada’s economy, providing an array of goods and services that benefit the livelihoods of communities and people across Canada. In 2024, the forest sector contributed $30.7 billion to Canada’s nominal gross domestic product (GDP), directly employed 194,040 people, and exported $37.2 billion of forest products.1–7
Forest sector contributions to environmental and clean technology products in Canada7
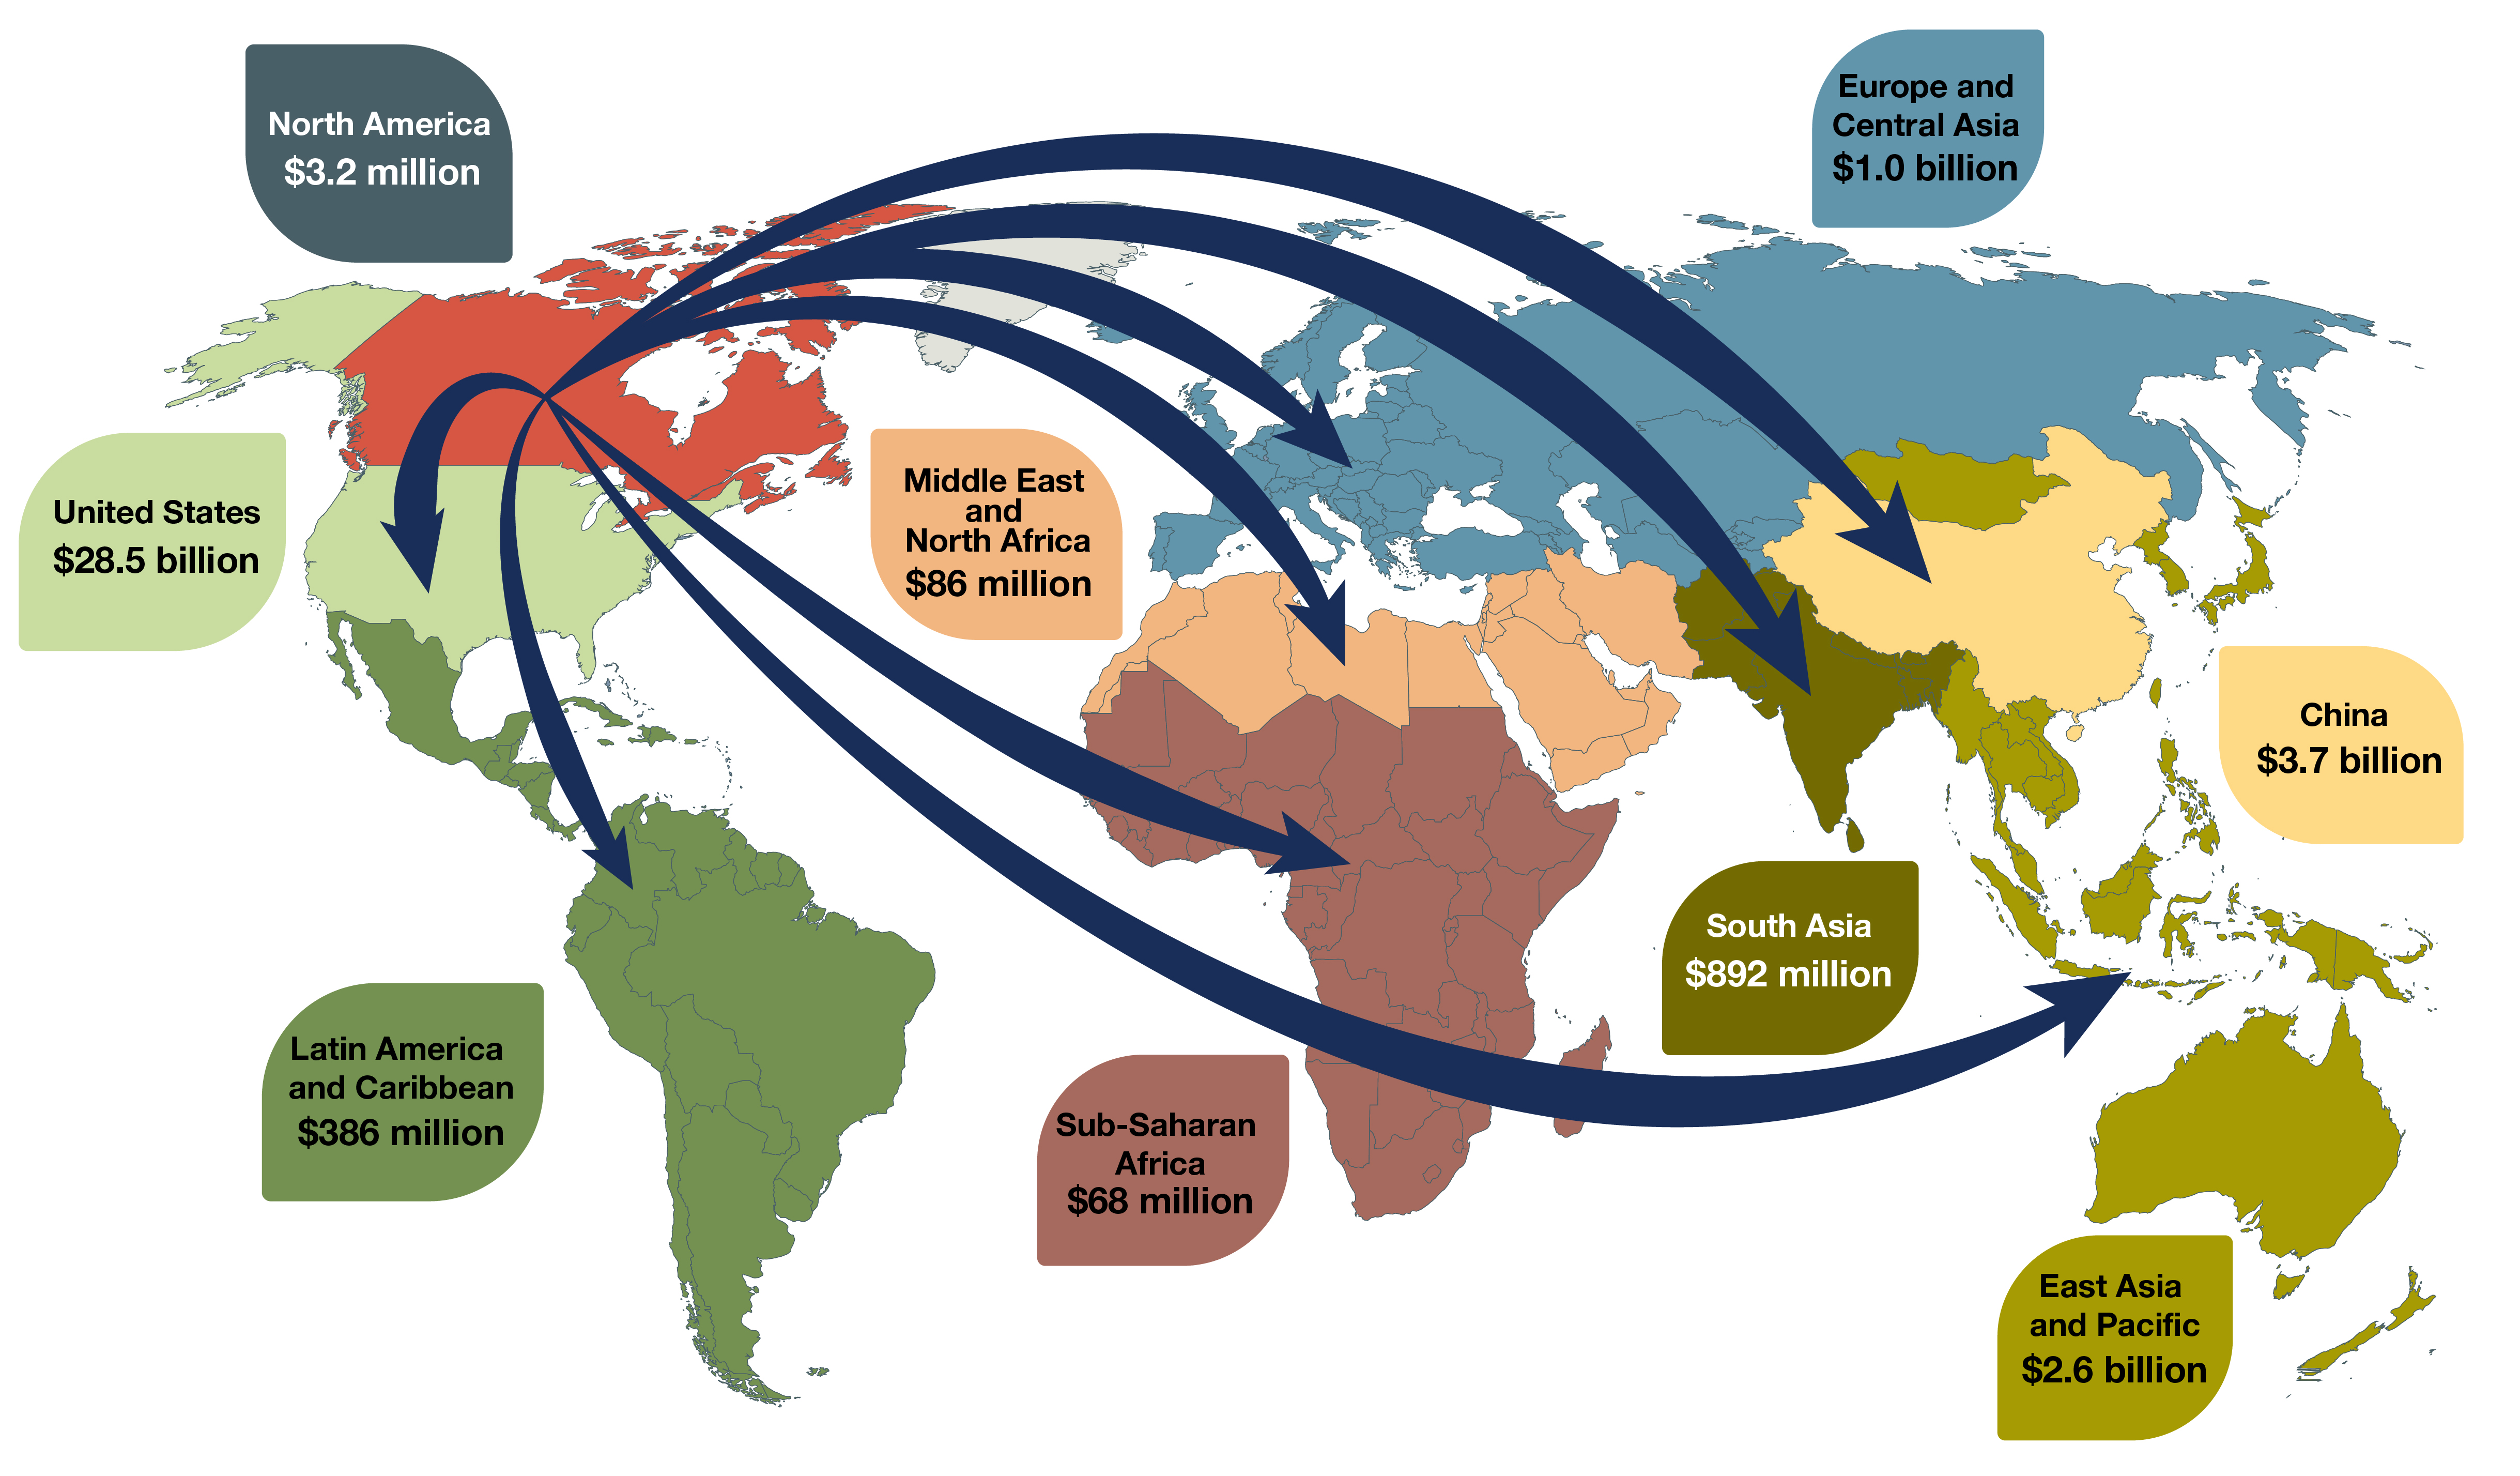
Text version
| Major Region | Forest Product Exports (2024) |
|---|---|
| China | $3.7 billion |
| East Asia and Pacific | $2.6 billion |
| Europe and Central Asia | $1.0 billion |
| Latin America and Caribbean | $386 million |
| Middle East and North Africa | $86 million |
| North America | $3.2 million |
| South Asia | $892 million |
| Sub-Saharan Africa | $68 million |
| United States | $28.5 billion |
| Total | $37.2 billion |
The forest sector, as part of the bioeconomy, is a significant contributor to the environmental and clean technology products sector in Canada. For example, by-products from harvest operations and industrial processing are used to make a range of low-carbon renewable alternatives to everyday consumer products, such as fuels, plastics, and textiles. The share of forest sector jobs that fall within the environmental and clean technology products sector (6.1%) is higher than the share of jobs across the broader economy (1.7%).8–10 The value (and share) of environmental and clean technology products attributable to the forest sector decreased from $1.8 billion (2.3%) in 2022 to $1.4 billion (1.7%) in 2023.9,10 The decrease was largely driven by a reduction in wood product manufacturing, which accounts for nearly half of the forest sector’s contribution. The decrease in wood product manufacturing followed weakened demand in 2023, which was attributable to inflation and increased interest rates. Across all sectors, environmental and clean-technology products are valued at $80.8 billion, or approximately 3.0% of Canada’s nominal GDP.9–11
Forest sector contributions across Canada
Forest sector activity directly supports the livelihoods of 194,040 people across Canada. The largest employment contributions are in Québec (30% of national forest sector jobs), British Columbia (25%), and Ontario (20%), whereas Alberta (10%), Atlantic Canada (10%), the Prairies (5%), and the Territories (0.1%) account for the remaining forest sector jobs. Forest sector contributions are particularly important in many rural, remote, and Indigenous communities, where there is often limited economic diversification, making forest-related work a key source of employment and income. According to the 2021 Census, the forest sector has a higher participation of Indigenous workers (6%) than the overall labour force (4%), and more than 40% of forest sector workers live in rural and remote communities.13 Additionally, the forest sector generates about $3.2 billion in revenue for provincial and territorial governments (2021) through stumpage charges and various other fees.14
Canadian forest products in a global market
Canada is a leading global forest product manufacturer and exporter. The sector is highly export-oriented, accounting for 5% ($37.2 billion) of Canada’s goods exports and contributing to Canada’s trade balance (exports minus imports) with a $22.0 billion trade surplus (exports exceed imports).15 By dollar value, Canada is the global leader in the export of softwood lumber, oriented strandboard, northern bleached softwood kraft pulp, and newsprint. Most of our exports go to the United States (76%), China (10%), and Japan (3%). Canada is actively working to expand into new markets and develop new end-uses for Canadian forest products.
Innovation in Canada’s forest sector
New and innovative forest products continue to gain popularity and are an increasingly important part of Canada’s economy. These next-generation forest products include advanced wood building products and building systems such as cross-laminated timber, biofuels that can substitute for fossil fuels, and biodegradable replacements for single-use plastics. The Government of Canada supports the product development and commercialization process of next-generation forest products through programs like the Forest Innovation Program, Investments in Forest Industry Transformation, and Green Construction Through Wood Program.
Sources and information
- Statistics Canada. Table 18-10-0265-01. Industrial product price index, by major product group, monthly; Feb 2025–June 2025 [updated 2025 Aug 8]. https://doi.org/10.25318/1810026501-eng (See Note a and b)
- Statistics Canada. Table 18-10-0267-01. Industrial product price index, by industry, monthly; Feb 2025–June 2025 [updated 2025 Aug 8]. https://doi.org/10.25318/1810026701-eng (See Note a and b)
- Statistics Canada. Table 18-10-0268-01. Raw materials price index, monthly; Feb 2025–June 2025 [updated 2025 Aug 8]. https://doi.org/10.25318/1810026801-eng (See Note a and b)
- Statistics Canada. Table 36-10-0434-01. Gross domestic product (GDP) at basic prices, by industry, monthly, industry detail (x 1,000,000); Jan 2025–May 2025 [updated 2025 Aug 8]. https://doi.org/10.25318/3610043401-eng (See Note a and b)
- Statistics Canada. Table 36-10-0401-01. Gross domestic product (GDP) at basic prices by industry (x 1,000,000); 2017–2021 [updated 2025 Aug 08]. https://doi.org/10.25318/3610040101-eng (See Notes a and b)
- Statistics Canada. Table 36-10-0489-01. Labour statistics consistent with the System of National Accounts (SNA), by job category and industry; 2020–2024 [updated 2025 Aug 8]. https://doi.org/10.25318/3610048901-eng
- Statistics Canada. Merchandise trade data (special extraction, April 3, 2025). (See Note c and d)
- Statistics Canada. Table 36-10-0480-01. Labour productivity and related measures by business sector industry and by non-commercial activity consistent with the industry accounts; 2020–2024 [updated 2025 Aug 8]. https://doi.org/10.25318/3610048001-eng
- Statistics Canada. Table 36-10-0632-01. Environmental and Clean Technology Products Economic Account, employment; 2019–2023 [updated 2025 Aug 8]. https://doi.org/10.25318/3610063201-eng (See Note e)
- Statistics Canada. Table 36-10-0645-01. Environmental and Clean Technology Products Economic Account, output, gross domestic product, and compensation of employees per industry; 2019–2023 [updated 2025 Aug 8]. https://doi.org/10.25318/3610064501-eng (See Note e)
- Statistics Canada. Table 36-10-0221-01. Gross domestic product, income-based, provincial and territorial, annual (x 1,000,000); 2019–2023 [updated 2025 Aug 8]. https://doi.org/10.25318/3610022101-eng
- Statistics Canada. Merchandise trade data (special extraction, April 3, 2025). (See Note d)
- Statistics Canada. 2021 census of the population(special extraction, received March 10, 2023). https://www12.statcan.gc.ca/census-recensement/2021/dp-pd/index-eng.cfm
- Statement of revenues from the sale of timber from provincial Crown land. National Forestry Database; accessed 2025 May 22. http://nfdp.ccfm.org/en/download.php
- Global Trade Atlas. IHS Connect; accessed May 23, 2025. (See Notes d and f)
Notes
- GDP in 2017 constant prices and estimated industry price deflators indexed to 2017.
- For nominal GDP up to (and including) 2017.
- Each product in the dataset represents the total for a custom grouping of HS codes. The following table provides data from the figure:
*Regions are categorized according to the World Bank. Antarctica is not included (Canada exported $28 of forest products to Antarctica in 2024).Major Region* Forest Product Exports (2024) China $3,673,975,121 East Asia and Pacific $2,644,649,396 Europe and Central Asia $1,023,158,077 Latin America and Caribbean $385,616,666 Middle East and North Africa $85,651,296 North America $3,201,651 South Asia $891,959,323 Sub-Saharan Africa $68,095,135 United States $28,469,777,434 Total $37,246,084,099
- Forest products include only HS codes 44, 47, and 48.
- Estimates are from the Environmental and Clean Technology Products Economic Account (ECTPEA). ECTPEA GDP estimates are in nominal terms. Estimates for 2022 and 2023 are preliminary. Environmental and clean technology products are defined as any process, product or service that reduces environmental impacts through any of the following 3 strategies: (1) environmental protection activities that prevent, reduce or eliminate pollution of any other degradation of the environment; (2) resource management activities that result in the more efficient use of natural resources, thus safeguarding against their depletion; and (3) the use of goods that have been adapted to be significantly less energy or resources intensive than the industry standard.
- Global value comparisons are on a United States dollar basis.
Indicator: forest sector gross domestic product
Gross domestic product (GDP) is a measure of the size of a country’s economy.
Nominal GDP represents the total value of all final goods and services produced annually in a country.
Real GDP adjusts for price changes and provides a more accurate depiction of the change in economic output over time.
In 2024, the forest sector contributed $30.7 billion in nominal gross domestic product (GDP), a decrease of 1.1% year over year from 2023, and contributed 1.1% to Canada’s total nominal GDP.1–5 Real GDP for the forest sector also decreased by 1.7% from the previous year.6
The forest sector underperformed relative to Canada’s total economy, which increased 2.5% (nominal GDP) and 1.6% (real GDP) in 2024.1–6
- Prices for softwood lumber and oriented strand board increased compared with 2023. These elevated prices contributed to the growth in the wood product manufacturing subsector, with increases of 1.8% for real GDP and 4.2% for nominal GDP from 2023, despite the overall decrease in GDP seen across the broader forest sector.1–6
- Slightly higher pulp prices were offset by lower pulp production volumes in 2024. Furthermore, reduced paper and packaging prices coupled with slight increases in production led to a decrease of 5.3% in nominal GDP compared to 2023 for the pulp and paper manufacturing subsector.1–5
- Nominal GDP in the forestry and logging subsector decreased 8.8%, driven mostly by reduced harvesting in British Columbia resulting from weak market conditions, challenges in accessing economic timber, and natural disturbances such as wildfires.1–5
Canadian forest sector's nominal gross domestic product (GDP), 2014–20241–5

Graph summary
Comparison of the Canadian forest sector nominal gross domestic product by subsector for each year from 2014 to 2024.
| Year | Forestry and logging | Wood product manufacturing | Pulp and paper manufacturing |
|---|---|---|---|
| 2014 | 3.73 | 8.72 | 7.93 |
| 2015 | 3.99 | 8.96 | 8.58 |
| 2016 | 4.09 | 9.99 | 8.61 |
| 2017 | 4.52 | 11.12 | 8.84 |
| 2018 | 4.82 | 11.86 | 10.47 |
| 2019 | 4.28 | 9.34 | 9.22 |
| 2020 | 4.04 | 11.88 | 8.11 |
| 2021 | 5.98 | 21.51 | 9.03 |
| 2022 | 6.85 | 21.77 | 10.39 |
| 2023 | 5.30 | 15.79 | 9.98 |
| 2024 | 4.83 | 16.46 | 9.45 |
Canadian forest sector's real gross domestic product (GDP) growth, 2014–20246

Graph summary
Comparison of the growth (in percentage) of the real gross domestic product in Canada for all sectors and for the forest sector from 2014 to 2024.
| Year | Total all sectors | Total forest sector |
|---|---|---|
| 2014 | 2.8 | 4.1 |
| 2015 | 0.9 | 3.1 |
| 2016 | 1.0 | 0.6 |
| 2017 | 3.1 | -2.2 |
| 2018 | 2.8 | -0.7 |
| 2019 | 2.0 | -5.3 |
| 2020 | -4.7 | -6.9 |
| 2021 | 6.0 | 7.6 |
| 2022 | 4.1 | 1.0 |
| 2023 | 1.6 | -6.0 |
| 2024 | 1.6 | -1.7 |
Why is this indicator important?
- Contribution to nominal GDP is one of the key indicators used to compare the size of Canada’s forest sector with its other economic sectors.
What is the outlook?
- Despite ongoing trade challenges and a comparatively higher interest rate environment, long-term prospects for solid wood products are strong, supported by expected strong demand for new homes in Canada and the United States, and both countries’ goals of addressing housing affordability.
- Demand for containerboard and other packaging products is a source of growth for the pulp and paper sector due to the continued shift towards e-commerce and home delivery shopping. Other opportunities exist in tissue and hygiene products and high-value bioproducts.
Sources and information
- Statistics Canada. Table 18-10-0265-01. Industrial product price index, by major product group, monthly; Feb 2025–June 2025 [updated 2025 Aug 8]. https://doi.org/10.25318/1810026501-eng (See Notes a and b)
- Statistics Canada. Table 18-10-0267-01. Industrial product price index, by industry, monthly; Feb 2025–June 2025 [updated 2025 Aug 8]. https://doi.org/10.25318/1810026701-eng (See Notes a and b)
- Statistics Canada. Table 18-10-0268-01. Raw materials price index, monthly; Feb 2025–June 2025 [updated 2025 Aug 8]. https://doi.org/10.25318/1810026801-eng (See Notes a and b)
- Statistics Canada. Table 36-10-0434-04. Gross domestic product (GDP) at basic prices, by industry, monthly (x 1,000,000); Jan 2025–May 2025 [updated 2025 Aug 8]. https://doi.org/10.25318/3610043401-eng (See Notes a and b)
- Statistics Canada. Table 36-10-0401-01. Gross domestic product (GDP) at basic prices by industry (x 1,000,000); 2017–2021 [updated 2025 Aug 8]. https://doi.org/10.25318/3610040101-eng (See Notes a and b)
- Statistics Canada. Table 36-10-0434-04. Gross domestic product (GDP) at basic prices, by industry, monthly (x 1,000,000); Jan 2025–May 2025 [updated 2025 Aug 8]. https://doi.org/10.25318/3610043401-eng (See Notes c–e)
Notes
- For nominal GDP up to (and including) 2017.
- GDP in 2017 constant prices and estimated industry price deflators indexed to 2017.
- Real GDP in 2017 constant prices.
- Nominal and real GDP differ in that real values are adjusted for inflation whereas nominal values are not. Therefore, real GDP is used to account for differences between periods (e.g., comparing previous 2 years’ GDP).
- Data from Statistics Canada’s Natural Resources Satellite Account (NRSA) are a key source of information on the economic contribution of the forest sector in Canada. The NRSA, the result of collaboration between Natural Resources Canada and Statistics Canada, can capture economic activity in forest industry segments that have traditionally been difficult to measure, such as wood furniture manufacturing. According to data from the NRSA, the forest sector directly accounted for $31.5 billion to Canada’s nominal GDP (1.1% of total GDP) in 2024.
Indicator: production of forest products
Canada is one of the world’s leading producers of newsprint, northern bleached softwood kraft pulp, and softwood lumber.
Production of forest products in Canada was stable in 2024, a notable shift from the downward trends seen across most forest product groups in recent years. Significant growth in 2024 compared to 2023 was seen in glue-laminated timber (11%) and laminated veneer lumber (12%).1
- Softwood lumber production was relatively steady, decreasing 1% in 2024 from 2023. This follows year-over-year decreases of 5% in 2023 and 10% in 2022. The downward trend in lumber production since 2018 is linked to reduced availability of low-cost fibre in key producing regions (e.g., British Columbia) after the mountain pine beetle epidemic and the increased incidence and severity of wildland fires.2,3
- Year-over-year structural panel production increased 3%, rebounding from a 5% decrease in 2023. This growth was led by an increase in year-over-year oriented strand board production (4%), supported by higher prices across 2024.1
- Year-over-year wood pulp production continued its long-term downward trend in 2024, although at a more modest rate compared with recent years: in 2024, −2%; in 2023, −8%; in 2022, −5%. Although demand for wood pulp exports grew in 2024, production was limited due to the reduced availability of sawmill residues (used to produce pulp) following sawmill curtailments and closures.4
- Graphic paper production remained stable in 2024 (a 1% increase year-over-year), following a sharp 15% decrease in 2023.4
Canadian production of graphic paper and wood pulp, 2014–20244

Graph summary
Comparison between the Canadian production of the total graphic paper and wood pulp for each year from 2014 to 2024.
| Year | Total graphic paper | Wood pulp |
|---|---|---|
| 2014 | 7.27 | 16.96 |
| 2015 | 6.54 | 16.55 |
| 2016 | 6.34 | 16.51 |
| 2017 | 6.03 | 16.30 |
| 2018 | 6.05 | 16.18 |
| 2019 | 5.29 | 15.42 |
| 2020 | 4.22 | 14.30 |
| 2021 | 4.32 | 14.26 |
| 2022 | 4.44 | 13.58 |
| 2023 | 3.77 | 12.56 |
| 2024 | 3.81 | 12.30 |
Canadian production of softwood lumber and structural wood panels, 2014–20241–3

Graph summary
Comparison between the production of softwood lumber and structural wood panels for each year from 2014 to 2024.
| Year | Softwood lumber | Structural wood panels |
|---|---|---|
| 2014 | 7.69 | 1.50 |
| 2015 | 7.97 | 1.72 |
| 2016 | 8.73 | 1.60 |
| 2017 | 8.92 | 1.49 |
| 2018 | 9.17 | 1.25 |
| 2019 | 8.45 | 1.03 |
| 2020 | 8.30 | 1.00 |
| 2021 | 8.94 | 0.88 |
| 2022 | 8.87 | 0.87 |
| 2023 | 8.42 | 0.90 |
| 2024 | 8.64 | 0.86 |
Why is this indicator important?
- Canada is one of the world’s top manufacturers and exporters of forest products, and its production levels serve as an early indicator of economic and market shifts affecting the forest sector.
What is the outlook?
- A limited supply of economic timber driven by rising log costs and reduced economic fibre availability, is expected to continue in 2025, dampening production of solid wood products and pulp. Sawmilling downtime also affects pulp and paper production by reducing the supply of wood chips, which are a key input.
- Over the medium term, efforts to expand housing supply in Canada are expected to support domestic construction activity and solid wood product demand (lumber and structural panels).
Sources and information
- Quarterly production reports. APA: The Engineered Wood Association; accessed 2025 Sept 3. https://shop.apawood.org/product/quarterly-production-report-subscription/ (See Note a)
- Statistics Canada. Table 16-10-0045-01. Lumber, production, shipments and stocks, monthly (x 1,000); Aug 2018–Dec 2018 [updated 2025 Aug 8]. https://doi.org/10.25318/1610004501-eng (See Notes b–d)
- Statistics Canada. Table 16-10-0017-01. Lumber production, shipments, and stocks by species, monthly (x 1,000); Jan 2025–May 2025 [updated 2025 Aug 8]. https://doi.org/10.25318/1610001701-eng (See Notes b, c, and e)
- Production data of total graphic paper and wood pulp. Personal communication. Pulp and Paper Products Council; 2025 Apr 16. (See Notes f and g)
Notes
- For production data of structural panels (plywood and oriented strand board).
- Statistics Canada sources are for production data of lumber, which include total softwood production for Canada.
- In January 2019, Statistics Canada noted that they made changes to the sampling and estimation methods for the monthly Sawmills survey, which is the source of the softwood lumber production data for this indicator. As a result of these changes, Statistics Canada replaced Table 16-10-0017-01 with Table 16-10-0045-01 as of January 2019. For more information, see https://www150.statcan.gc.ca/n1/daily-quotidien/200302/dq200302a-eng.htm
- Lumber production data for years 2010 to 2013 (inclusive).
- Lumber production data for years 2014 to 2023 (inclusive).
- For production data of total graphic paper and wood pulp.
- Because of changes in sampling and estimation methods in the Sawmills survey, readers should exercise caution in directly comparing data from different sources.
Indicator: exports of forest products
In 2024, Canada remained the world’s leading exporter of softwood lumber, northern bleached softwood kraft pulp, oriented strand board, and newsprint.2
In 2024, the year-over-year value of Canada’s total forest product exports increased by $1 billion (3%) to $37.2 billion, driven largely by higher forest product prices. This followed a period of market adjustment after years of price volatility and supply chain disruptions.1
- Values of structural wood panel exports had the strongest growth in 2024, with export values increasing by $0.4 billion (12%), somewhat recovering from a sharp decrease (33%) the previous year. The growth was supported by steady demand in construction and renovation markets. Wood pulp export values also increased by $0.4 billion (5%), whereas the value of softwood lumber exports increased slightly by $0.3 billion (3%).1
- The value of printing and writing paper exports increased slightly by $16 million (0.7%). However, the volume exported decreased sharply (24%) reflecting continued shifts to digital alternatives.1
- Export volumes showed different patterns across other products, with wood pulp and newsprint volumes both increasing by 4%. In contrast, softwood lumber export volumes decreased slightly by 0.3% as supply remained constrained by production curtailments and mill closures.1
Exports of Canadian forest products, 2014–20241

Note: Exports are reported in nominal dollars (not inflation-adjusted)
Graph summary
Comparison of the export value among various Canadian forest products, for each year from 2014 to 2024.
| Year | Softwood lumber | Newsprint | Printing and writing paper | Structural wood panels | Wood pulp | Other forest products |
|---|---|---|---|---|---|---|
| 2014 | 8.3 | 2.6 | 2.5 | 1.4 | 7.5 | 8.6 |
| 2015 | 8.5 | 2.3 | 2.6 | 1.6 | 8.0 | 9.8 |
| 2016 | 10.0 | 2.2 | 2.2 | 2.2 | 7.6 | 10.3 |
| 2017 | 10.4 | 2.0 | 2.1 | 2.5 | 8.3 | 10.7 |
| 2018 | 10.2 | 2.3 | 2.4 | 2.7 | 9.7 | 11.1 |
| 2019 | 8.0 | 1.9 | 2.4 | 2.0 | 8.0 | 10.9 |
| 2020 | 10.0 | 1.3 | 2.0 | 2.9 | 6.7 | 10.4 |
| 2021 | 16.4 | 1.4 | 2.0 | 5.5 | 7.7 | 12.1 |
| 2022 | 13.7 | 1.8 | 2.6 | 4.7 | 8.9 | 13.8 |
| 2023 | 8.5 | 1.7 | 2.3 | 3.2 | 7.5 | 13.1 |
| 2024 | 8.8 | 1.5 | 2.3 | 3.6 | 7.9 | 13.3 |
Why is this indicator important?
- Exports of forest products are a major driver of Canada’s forest sector and rural economies. As one of the world’s largest forest product exporters, Canada remains an important supplier to global markets.
- With an abundant and sustainably managed wood supply, the Canadian forest sector meets the needs of consumers worldwide. By exporting forest products, the sector supports climate change mitigation goals while making a substantial contribution to Canada’s economy and balance of trade.
What is the outlook?
- The near-term outlook for forest product exports is uncertain due to trade challenges with the United States (US). US import duties imposed on Canadian softwood lumber and the US Section 232 national security investigation of imports of forest products3 could result in further trade measures imposed against Canadian forest products.
- Looking beyond the current trade challenges, the longer-term outlook for solid wood product exports, including lumber and panels (both structural and non-structural) remains strong. Efforts to expand housing supply as well as increased home repair and remodeling activity in North America should further support growth in solid wood product exports.
- Underlying demographic trends are expected to drive higher demand for home construction, repair, and remodeling in both Canada and the US, which would support growth in forest products.
- Export values for certain pulp and paper products are expected to decrease as demand for items such as newsprint and printing and writing paper will continue their long-term, downward trend.
Sources and information
- Statistics Canada. Merchandise trade data (special extraction, April 4, 2025). (See Note a)
- Global Trade Atlas (special extraction May 5, 2025). IHS Connect. (See Notes b–d)
- Addressing the threat to national security from imports of timber and lumber. The White House; 2025 Mar 1 [accessed 2025 Aug 8]. https://www.whitehouse.gov/presidential-actions/2025/03/addressing-the-threat-to-national-security-from-imports-of-timber-lumber/
Notes
- Each product in this dataset represents the total for a custom grouping of HS codes.
- Forest Products include only HS codes 44, 47 and 48.
- Softwood Lumber includes only HS codes 440710, 440711, 440712, 440713, 440714, and 440719.
- Global value comparisons are on a United States dollar basis.
How is the forest sector changing?
Although Canada’s forest sector continues in the face of ongoing challenges, its core components show stability, according to the latest data presented in this section.
Secondary manufacturing
In 2024, the manufacturing of various value-added product lines for the Canadian economy remained relatively stable. This stability is central to the future of the sector, which depends on its ability to innovate and adapt to changing customer preferences and technologies, and to maintain a healthy operating base within the primary forest product industry. For example, a large proportion of harvested logs are processed at sawmills, providing raw materials (e.g., residues) for both conventional and emerging manufacturing operations.
Circular and advanced bioeconomy
There are opportunities in the advanced forest bioeconomy, which provides innovative wood-based building materials such as mass timber and prefabricated modules for Canada’s residential sector. Furthermore, circular bioeconomy activities that use wood residuals to create bioproducts ensure that all parts of harvested trees are used to generate benefits.
Circular construction activities can reuse or recycle materials. For example, composite panels can be made from construction and demolition waste. Another option for end-of-life materials is bioenergy, increasing Canada’s energy security while avoiding landfilling wood-based materials.
Energy and climate
Although the forest sector provides benefits to Canadians, its energy efficiency and climate emissions are monitored. Canada’s forest sector continues to use less total energy over time, owing to facility upgrades, and the use of bioenergy from wood residuals. However, the decline in the manufacturing of certain forest products has also contributed to the overall reduction of energy needs in the sector.
By using residuals for heat and power, forest sector facilities are creating value from biomass and helping reduce their emission of greenhouse gases from fossil fuel. As the sector advances with new products and more value-added manufacturing, there are further opportunities to provide benefits for the economy, society, and environment.
Indicator: forest sector financial performance
Financial performance in the forest sector bounced back in 2024 after a sharp decrease in 2023. In 2024, operating profit levels increased more than 30% from 2023; compared with 2019 (the lowest level of the last decade), it was an increase of 210%. However, the 2024 operating profit levels remained less than half of the 2021 record high that was reached during the pandemic boom,1,2 when lumber prices were at their peak.3 The forest sector is a capital-intensive industry – requiring substantial investments – and generated a return on capital employed of 3% in 2024, slightly above 2023 levels but the second lowest over the last decade.1,2
Both operating profits and the return on capital employed indicate the economic competitiveness of the forest sector. Operating profit measures the difference between operating revenues and operation expenses. Return on capital employed measures the efficiency of capital in generating profits for the sector.
- Reduced availability of economic timber, rising production costs, weak market demand, and low lumber prices3 led to production cuts and sawmill closures in 2024.4 This reduced supply helped to increase prices later in the year, improving profit margins for producers who maintained output.
- In the pulp and paper sector, weak global demand early in the year was mitigated by unplanned global supply disruptions mid-year, including sawmill shutdowns and logistical bottlenecks in China. These disruptions reduced global supply, lifted pulp prices,5 and increased Canadian export volumes, which boosted overall profitability.
- North American markets continued to grapple with inflation and high interest rates, dampening demand and investments. In response, companies prioritized cost control measures, such as selective curtailments at higher-cost facilities and conservative investments targeting improved efficiency and reduced operating costs. They also continued to pursue projects in low-cost regions, such as the southern United States (US) where favorable logistics and access to abundant timber support more competitive operations.6–8
Financial performance by Canada's forest sector, 2014–20242

Note: Operating profits are reported in nominal dollars (not inflation-adjusted)
Graph summary
The operating profits and return on capital employed in the forest sector for each year from 2014 to 2024.
| Year | Operating profits (million dollars) | Return on capital employed (%) |
|---|---|---|
| 2014 | 2,811 | 5.4 |
| 2015 | 3,508 | 5.7 |
| 2016 | 5,121 | 8.6 |
| 2017 | 6,816 | 9.8 |
| 2018 | 7,698 | 11.5 |
| 2019 | 2,743 | 4.4 |
| 2020 | 7,834 | 4.7 |
| 2021 | 18,129 | 9.1 |
| 2022 | 15,237 | 6.4 |
| 2023 | 6,389 | 2.6 |
| 2024 | 8,494 | 3.1 |
Why is this indicator important?
- Strong financial performance is critical for the forest sector’s ability to attract investment and remain economically competitive, generating economic benefits for Canadians.
- Operating profits and return on capital employed are key indicators of this performance.
What is the outlook?
- US and Canadian construction activity is a major demand driver for solid wood products, while protectionist trade measures create uncertain market conditions that could negatively affect financial results in Canada’s forest sector.
- Over the medium term, Canada and the US aim to address housing affordability by increasing housing supply, which should benefit the sector.8,9
- The pulp and paper segment is expected to continue to face pressure from decreasing traditional paper sales, partially offset by growth in the packaging sector.10 Sector-wide innovation and a shift toward higher-value products can support future financial resilience.
Sources and information
- Statistics Canada. Table 33-10-0007-01. Archived - Quarterly balance sheet and income statement, by industry, inactive (x 1,000,000) (special extraction, March 10, 2020). (See Note a)
- Statistics Canada. Table 33-10-0225-01. Quarterly balance sheet, income statement and selected financial ratios, by non-financial industries, non-seasonally adjusted (x 1,000,000); Q1 2024–Q1 2025 [updated 2025 Aug 8]. https://doi.org/10.25318/3310022501-eng (See Note b)
- Current lumber, pulp, and panel prices. Natural Resources Canada; updated 2025 Aug 6. https://natural-resources.canada.ca/domestic-international-markets/current-lumber-pulp-panel-prices
- Forest Economic Advisors; accessed 2025 May 1. https://getfea.com/publication/sawmill-profiles/sawmill-profiles
- Market pulp monthly reports. TTO BMA. https://ttobma.com/market-pulp-monthly
- Forest products annual market review 2023–2024.FAO and UNECE; 2024 [accessed 2025 Aug 8]. https://openknowledge.fao.org/handle/20.500.14283/cd2274en
- Jannke P. 2025 Lumber markets outlooks. Canadian Forest Industries; 2025 Feb 18 [accessed 2025 Aug 8]. www.woodbusiness.ca/2025-lumber-markets-outlook/
- Government of Canada. Housing, Infrastructure and Communities Canada. Solving the Housing Crisis: Canada’s Housing Plan; accessed 2025 Aug 8. http://housing-infrastructure.canada.ca/housing-logement/housing-plan-logement-eng.html
- US White House. January 20, 2025. Delivering Emergency Price Relief for American Families and Defeating the Cost-of-Living Crisis. www.whitehouse.gov/presidential-actions/2025/01/delivering-emergency-price-relief-for-american-families-and-defeating-the-cost-of-living-crisis/
- Cavanagh P. Market sentiment showing signs of recovery: global pulp outlook: 2025 preview. Fastmarkets; 2025 March 14 [accessed 2025 Aug 8]. www.fastmarkets.com/insights/market-signs-recovery-global-pulp-outlook-2025/
Notes
- For data before and including 2019, as Statistics Canada discontinued the use and update of this source (from 2000 onward, Table 33-10-0225-01 serves as the replacement).
- For data including and beyond 2020.
Indicator: forest sector secondary manufacturing
The secondary forest product manufacturing subsector in Canada generated $6.95 billion in real gross domestic product (GDP) in 2024,1 remaining relatively steady over the past few years.
- The secondary wood manufacturing subsector contributed $3.94 billion in real GDP,1 a 1.8% increase over the 2023 level. With the net exports falling by 12%,2 the increase is primarily attributed to stronger domestic consumption.
- The real GDP for the secondary paper manufacturing subsector was $3.01 billion,1 a 0.6% decrease from the 2023 level. Although domestic consumption increased by 4% the increase was offset by an increase in competing imports, leading to a modest decline in increases.2,3
Forest sector secondary manufacturing is the further processing of primary products of lumber and raw paper into more finished products such as cabinets, paper bags, etc.
The industry real GDP is an inflation-adjusted value. It is obtained by calculating the difference in value ($) between the industry’s output and the inputs it purchases from other industries (e.g., energy or materials).
Real gross domestic product (GDP) from primary and secondary wood and paper product subsectors in Canada, 2014–20241–3

Graph summary
Comparison of the gross domestic product from primary and secondary wood and paper products in Canada for each year from 2014 to 2024.
| Year | Primary paper products | Primary wood products | Secondary paper products | Secondary wood products |
|---|---|---|---|---|
| 2014 | 5.6 | 7.5 | 3.4 | 2.8 |
| 2015 | 5.7 | 7.8 | 3.6 | 2.8 |
| 2016 | 5.7 | 8.4 | 3.5 | 2.9 |
| 2017 | 5.3 | 8.3 | 3.5 | 2.8 |
| 2018 | 5.1 | 8.1 | 3.5 | 2.9 |
| 2019 | 4.6 | 7.9 | 3.4 | 3.1 |
| 2020 | 4.2 | 7.0 | 3.1 | 3.4 |
| 2021 | 4.4 | 7.7 | 3.3 | 3.5 |
| 2022 | 4.6 | 8.0 | 3.2 | 3.7 |
| 2023 | 4.3 | 7.2 | 3.0 | 3.9 |
| 2024 | 3.8 | 7.3 | 3.0 | 3.9 |
Why is this indicator important?
- The secondary forest product manufacturing sector generates additional employment and revenue and is a significant and integral part of the forest product industry, representing 38% of real GDP,1 38% of the sales,3 20% of the exports, and 57% of the domestic consumption.2,3
- Complementing the primary sector, the secondary forest product manufacturing sector mitigates risks related to both timber supply and market demand. It creates a cushion against upstream supply shocks for the communities and stabilizes economies by focusing on domestic markets instead of volatile global ones, reducing reliance on exports.
What is the outlook?
- The secondary wood manufacturing subsector will benefit from the positive momentum driven by Canada’s housing and infrastructure needs and the growing demand of sustainable and renewable materials in the construction. It faces challenges like United States tariffs and timber shortages, although United States policies could pressure primary producers to shift toward value-added products.
- Despite the rising demand for paper-based packaging, the secondary paper product subsector could continue to face challenges such as competing imports and rising production costs.
Sources and information
- Statistics Canada. Table 36-10-0434-04. Gross domestic product at basic prices, by industry, monthly, industry detail; Jan 2025–May 2025 [updated 2025 Aug 8]. https://doi.org/10.25318/3610043401-eng (See Notes a and b)
- Statistics Canada. Table: 12-10-0136-01. Canadian international merchandise trade by industry for all countries; Feb 2024–Jun 2024 [updated 2025 Aug 8]. https://doi.org/10.25318/1210013601-eng (See Notes a and b)
- Statistics Canada. Table 16-10-0047-01. Manufacturers’ sales, inventories, orders and inventory to sales ratios, by industry (dollars unless otherwise noted); Jan 2025–May 2025 [updated 2025 Aug 8]. https://doi.org/10.25318/1610004701-eng (See Notes a and b)
Notes
- Real GDP is in 2017 constant prices.
- Domestic consumption is calculated as the following: domestic sales − exports + imports.
This indicator only considers GHG emissions released from the combustion of fossil fuels (mainly natural gas and oil) for forest industry operations; including indirect fossil fuel emissions for electricity used in the sector.
Pulp and paper mills released 72% of the forest sector’s fossil GHG emissions in 2022, mostly due to natural gas and electricity use. Wood product manufacturing also relied on natural gas and electricity, but in smaller quantities. Forestry activities used GHG-intensive diesel fuel to operate harvesting equipment.
Indicator: forest sector fossil carbon emissions
Following a pronounced reduction between 2005 and 2011, greenhouse gas (GHG) emissions from the use of fossil fuels at forest sector facilities have decreased more slowly since 2011.1 Reductions in GHG emissions followed improvements in energy efficiency, increased use of forest biomass for heat and power generation, and reduced production capacity for certain types of forest products.
- Bioenergy meets 53% of the total annual energy demand of the forest sector. Increased bioenergy shares in wood product manufacturing, in addition to switching away from fuels such as coal and heavy fuel oil, has contributed to reducing GHG emissions from fossil fuels (direct and indirect emissions) in forest industry operations by 52% from 2005 through 2022.1
- Total energy demand for the sector has decreased by 32% from 2005 through 2022 owing to reductions in industrial activities and energy efficiency improvements.1
- Energy use in 2022 and GHG emissions remain mostly unchanged from 2021, remaining at levels lower than before the COVID-19 pandemic.
Fossil fuel greenhouse gas (GHG) emissions and total energy use in Canada's forest sector, 2005–20221

Graph summary
The total energy use and the greenhouse gas emissions from Canada’s forest sector for each year from 2005 to 2022.
| Year | Total energy use (petajoules) | Greenhouse gas emissions (million tonnes of CO2 equivalent) |
|---|---|---|
| 2005 | 924 | 25.1 |
| 2006 | 847 | 22.5 |
| 2007 | 827 | 22.3 |
| 2008 | 735 | 19.1 |
| 2009 | 674 | 16.4 |
| 2010 | 655 | 16.0 |
| 2011 | 640 | 14.5 |
| 2012 | 625 | 13.6 |
| 2013 | 657 | 13.9 |
| 2014 | 669 | 13.5 |
| 2015 | 671 | 13.6 |
| 2016 | 628 | 13.2 |
| 2017 | 647 | 14.0 |
| 2018 | 669 | 13.7 |
| 2019 | 663 | 13.2 |
| 2020 | 602 | 11.7 |
| 2021 | 625 | 12.0 |
| 2022 | 624 | 11.9 |
Why is this indicator important?
- Tracking annual emissions from fossil fuels is important to measure the forest sector’s transition to net zero in industrial operations.
- Reliable data on fossil fuel GHG emissions associated with forest industry operations complements information on biogenic emissions and removals from forests and wood products (see Indicator: forest greenhouse gas fluxes). Considering both types of emissions data allows for a more accurate picture of GHG emissions associated with the entire forest sector. A portion of the emissions are part of the natural carbon cycle, where emissions occur alongside carbon removals as trees grow back and carbon is stored before being released by end-of-life forest products, as opposed to fossil emissions that are net additions to the atmosphere.
What is the outlook?
- Canada’s forest sector continues to reduce emissions in other sectors. The substitution of carbon-intensive materials and energy sources in favour of forest products like mass timber, biocoal, and biocarbon can decrease GHG emissions across Canadian industry.
- Biomass for energy use is mainly a by-product of forest product manufacturing (i.e., lumber, pulp and paper, etc.) and increasingly post-consumer and demolition waste. In the future, residues from activities such as forest thinning and the use of FireSmart practices could become sources of bioenergy.
- Bioenergy with carbon capture and sequestration (BECCS) technology can support Canada’s decarbonization goals and result in net negative emissions energy production. Pulp and paper mills emit large quantities of biogenic carbon dioxide by burning waste biomass for energy, making them good candidates for BECCS development, especially in provinces with existing carbon dioxide transport and storage infrastructure such as Alberta. A few BECCS projects are operating in Canada, with more under development.
Sources and information
Notes
- The Office of Energy Efficiency at NRCan has changed the base year related to its National Energy Use Database from 1990 to 2000, beginning with the release of 2018 data. This change in methodology has resulted in minor changes in the energy use and GHG emissions data back to 2000. This rebasing is to ensure that National Energy Use Database reflects developments in trends and structures of Canada’s energy end use and efficiency across sectors. It also synchronizes Canada’s energy use data reporting with changes recently made by the International Energy Agency. Although new estimates are no longer made available for years prior to 2000, data with the new base year are expected to better service the development, implementation, and monitoring of government policies; programs and projects; evidence-based decision-making; industrial and market analysis and projection; and energy use literacy, education, and stakeholder engagement.
- Direct emissions come from sources that are owned or controlled by the reporting entity. Indirect emissions are emissions that are a consequence of the activities of the reporting entity but that occur at sources owned or controlled by another entity. For this indicator, indirect emissions reported only include emissions from electricity generation.
- National Resources Canada’s Comprehensive Energy Use Database is compiled using the following sources:
- The Canadian Energy and Emissions Data Centre, Simon Fraser University. 2024
- Statistics Canada. 2024. Report on Energy Supply and Demand in Canada 2000–2022
- Natural Resources Canada. 2024. Industrial End-Use Model
- Environment and Climate Change Canada. 2024. National Inventory Report 1990–2022: Greenhouse Gas Sources and Sinks in Canada
Key facts and figures
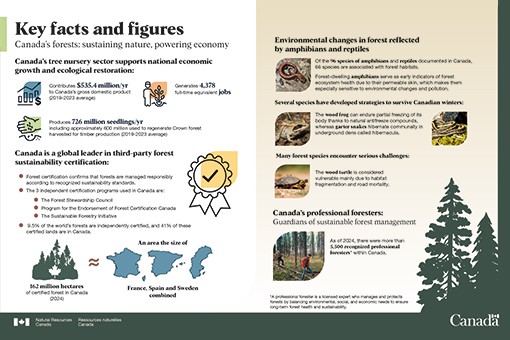
Sources and information
- The economic value of Canada’s tree nursery sector. Canadian Tree Nursery Association; 2025. https://ctna-acpf.ca/s/Rapport-danalyse-economique-du-secteur-des-pepinieres-forestieres-Jan-23_25.pdf
- Certification Canada Certification Summary 2024-year end status report. Forest Products Association.
- Wild Species Reports. Canadian Endangered Species Conservation Council. 2022. https://www.wildspecies.ca/reports
- The Great Lakes wetlands as amphibian habitats: a review. Aquatic Ecosystem Health & Management. 2004; 7(2):289-303. https://doi.org/10.1080/14634980490461542
- The Canadian Encyclopedia. [cited 2025 Nov 17]. https://www.thecanadianencyclopedia.ca/
- Wood Turtle (Glyptemys insculpta) COSEWIC assessment and status report: Chapter 8. Government of Canada; [cited 2025 Nov 17].https://www.canada.ca/en/environment-climate-change/services/species-risk-public-registry/cosewic-assessments-status-reports/wood-turtle/chapter-8.html
- Registered Professional Forester Numbers. Personal Communication. Registered Foresters of Canada; 2025 May 20.