
Statement outlining results, risks and significant changes in operations, personnel and programs
1. Introduction
This quarterly financial report should be read in conjunction with the Main Estimates and Supplementary Estimates (A), and the Net Budgetary Authorities published on the Treasury Board Secretariat website, as well as Canada’s Economic Action Plan 2014 (Budget 2014). It has been prepared by management as required by section 65.1 of the Financial Administration Act and in the form and manner prescribed by Treasury Board. This quarterly financial report has not been subject to an external audit or review.
1.1 Authority, Mandate and Programs
Natural Resources Canada (NRCan) seeks to enhance the responsible development and use of Canada’s natural resources and the competitiveness of Canada’s natural resource sectors. The department is an established leader in science and technology in the fields of energy, forests, and minerals and metals, and applies its expertise in earth sciences to build and maintain an up-to-date knowledge base of Canada’s landmass. NRCan develops policies and programs that enhance the contribution of the natural resource sectors to the economy and improve the quality of life of Canadians.Footnote 1
Further details on NRCan’s authority, mandate and programs can be found in Part II of the Main Estimates.
1.2 Basis of Presentation
This quarterly financial report has been prepared by management using an expenditure basis of accounting. The accompanying Statement of Authorities includes NRCan’s spending authorities granted by Parliament, and those used by NRCan are consistent with the Main Estimates and Supplementary Estimates (A) for the 2014-15 fiscal year. This quarterly report has been prepared using a special purpose financial reporting framework.
The authority of Parliament is required before monies can be spent by the Government. Approvals are given in the form of annually approved limits through appropriation acts or through legislation in the form of statutory spending authority for specific purposes.
As part of the Parliamentary business of supply, the Main Estimates must be tabled in Parliament on or before March 1 preceding the new fiscal year. As the Federal Budget is typically tabled around the same time as Main Estimates, measures announced in the Budget are not included in Main Estimates for either 2014-15 or 2013-14.
In fiscal year 2014-15, frozen allotments will be established by Treasury Board authority in departmental votes to prohibit the spending of funds identified as savings measures in Budget 2014. The changes to departmental authorities for future years will be implemented through the Annual Reference Level Update, as approved by Treasury Board, and reflected in the subsequent Main Estimates tabled in Parliament. The same approach was taken in 2013-14 for savings measures in Budget 2013.
NRCan uses the full accrual method of accounting to prepare and present its annual unaudited departmental financial statements, which are part of the Departmental Performance Report. However, the spending authorities voted by Parliament remain on an expenditure basis.
2. Highlights of Fiscal Quarter and Fiscal Year-to-Date Results
This Departmental Quarterly Financial Report reflects the results as at September 30, 2014, including Main Estimates and Supplementary Estimates (A) for which full supply was released. The details presented in this report focus on and compare the second quarter (Q2) results of 2014-15 with those of 2013-14.
Authorities
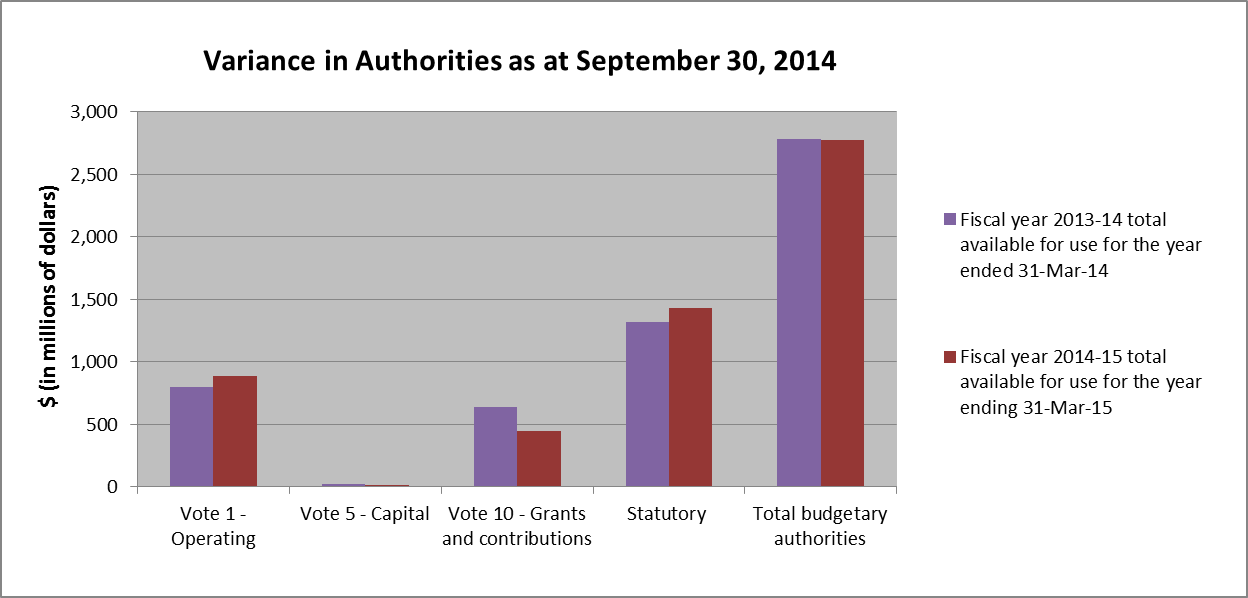
As per Table 1, presented at the end of this document, and on Graph 1 below, as at September 30, 2014, NRCan has authorities available for use of $2,773.6 million in 2014-15 compared to $2,779 million in 2013-14, for a net decrease of $5.4 million or 0.2%.
Graph 1
Text version
| Authority | Fiscal year 2013-14 total available for use for the year ended 31-Mar-14 |
Fiscal year 2014-15 total available for use for the year ending 31-Mar-15 |
|---|---|---|
| Vote 1 - Operating | 799 | 886 |
| Vote 5 - Capital | 26 | 16 |
| Vote 10 - Grants and contributions | 639 | 444 |
| Statutory | 1,315 | 1,428 |
| Total budgetary authorities | 2,779 | 2,774 |
The decrease of $5.4 million in authorities in 2014-15 compared to 2013-14 is explained by the net effect of both increases and decreases within operating expenditures, capital expenditures, grants and contributions, and statutory authorities, as per the following.
For operating expenditures, a net increase of $86.3 million between the second quarters of 2014-15 ($885.7 million) and 2013-14 ($799.4 million) in total authorities available for use is explained mainly by the following year-over-year changes:
Increases:
- $40.8 million for Operating Budget Carry Forward (OBCF) which is included in fiscal year 2014-15 Q2 authorities, while in fiscal year 2013-14, OBCF was included in authorities in Q3;
- $30.5 million for the Port Hope Area Initiative as part of a planned adjustment to the program financial profile;
- $22.9 million for the Nuclear Legacy Liabilities Program as part of a planned adjustment to the program financial profile;
- $20.3 million for the Stakeholder Engagement and Outreach Campaign to Build Prosperity for Canada - International Advertising Component as this program was approved in fiscal year 2013-14 through Supplementary Estimates (B)Footnote 2;
- $11.7 million for the Geo-mapping for Energy and Minerals Program as it sunsetted on March 31, 2013 and was renewed in fiscal year 2013-14 through Supplementary Estimates (B)Footnote 2; and
- $10 million for Advisory Services for the restructuring of Atomic Energy of Canada Limited, as this funding was approved in fiscal year 2013-14 through Supplementary Estimates (B)Footnote 2.
Decreases:
- $16.5 million for the Advertising Campaign Program as it sunsetted on March 31, 2014;
- $15.2 million for the Budget 2012 Savings Measures and Budget 2013 Travel Reduction as the amount of reduction increased from 2013-14 to 2014-15;
- $7.7 million for the Clean Energy Fund as part of a planned adjustment to the program financial profile;
- $3.4 million for the Targeted Geoscience Initiative Phase IV as part of a planned adjustment to the program financial profile;
- $3 million for the Program of Energy Research and Development as part of a planned adjustment to the program financial profile; and
- $1.8 million for transfers to the Capital Vote as part of an alignment exercise in fiscal year 2014-15 only, as the exercise began in 2014-15.
For capital expenditures, a net decrease of $9.7 million between the second quarters of 2014-15 ($15.9 million) and 2013-14 ($25.5 million) in total authorities available for use is explained mainly by the following year-over-year changes:
Increases:
- $3.1 million for Capital Budget Carry Forward (CBCF) which is included in fiscal year 2014-15 Q2 authorities, while in fiscal year 2013-14, CBCF was not included in authorities as of Q2;
- $1.8 million for transfers from the Operating Vote as part of an alignment exercise in fiscal year 2014-15 only, as the exercise began in 2014-15; and
- $0.2 million for the Marine Geo-hazards program, which is new in fiscal year 2014-15.
Decreases:
- $10.8 million for the Revitalization of NRCan’s Satellite Station Facilities across Canada as part of a planned adjustment to the program financial profile as work was mostly completed by March 31, 2014;
- $3.3 million for the relocation of the CANMET Materials Technology Laboratory to Hamilton as work was mostly completed by March 31, 2014; and
- $0.6 million for the Canadian Armed Forces Arctic Training Centre (CAFATC) as the project was completed by March 31, 2014.
For grants and contributions, a net decrease of $194.9 million between the second quarters of 2014-15 ($444 million) and 2013-14 ($638.9 million) in total authorities available for use is explained mainly by the following year-over-year changes:
Increases:
- $12.5 million for the grant to Sustainable Development Technology Canada-Tech Fund due to a planned adjustment to the program financial profile; and
- $4 million for Gunnar Mine Remediation Program as part of a planned adjustment to the program financial profile.
Decreases:
- $107.5 million for Clean Energy Fund due to a planned adjustment to the program financial profile resulting from a number of projects not proceeding and the program sunsets on March 31, 2015;
- $35.7 million for the Investments in Forest Industry Transformation Program as it sunsetted on March 31, 2014, and its renewal will be included in 2014-15 Supplementary Estimates (B);
- $31.1 million for the ecoENERGY for Biofuels Producer Incentive due to a planned adjustment to the program financial profile;
- $25 million for the grant to Sustainable Development Technology Canada for the Next Generation Biofuels Fund due to a planned adjustment to the program financial profile;
- $4.6 million for the Isotope Technology Acceleration Program as part of a planned adjustment to the program financial profile;
- $3.3 million for the Forest Innovation Program and Expanding Market Opportunities Program as part of a planned adjustment to the program financial profile;
- $2.6 million for the Wind Power Production Incentive Program as part of a planned adjustment to the program financial profile; and
- $1.9 million for the African Model Forest Initiative as it sunsetted on March 31, 2014.
For statutory items, a net increase of $112.8 million between the second quarters of 2014-15 ($1,428 million) and 2013-14 ($1,315.2 million) in total authorities available for use is explained mainly by:
Increases:
- $79.3 million for the Canada Foundation for Sustainable Development Technology - Next Generation Biofuels Fund – Statutory due to a planned adjustment to the program funding profile; and
- $57.4 million in the Newfoundland Offshore Petroleum Resource Revenue Fund as expectations are that more revenue will be collected in 2014-15 than in 2013-14.
Decreases:
- $11.1 million in the Nova Scotia Offshore Revenue Account caused by fluctuations in oil and gas prices and production levels;
- $8.1 million pertaining to the Crown Share Adjustment Payments for Nova Scotia Offshore Petroleum Resources due to a planned adjustment to the program financial profile; and
- $4.8 million for the Contribution to the Employee Benefit Plan as a result of a change in rate and a reduction in salary funding.
In addition to the above detail, other minor increases and decreases occurred within the appropriated funding and in other statutory departmental programs.
Budgetary Expenditures by Standard Object
As at September 30, 2014, year-to-date spending amounts to $890.8 million or 32.1% of total funding available, compared to $736.2 million or 26.5% at the same time last year. The increase is mainly related to an increase in transfer payments in 2014-15 compared to payments in 2013-14.
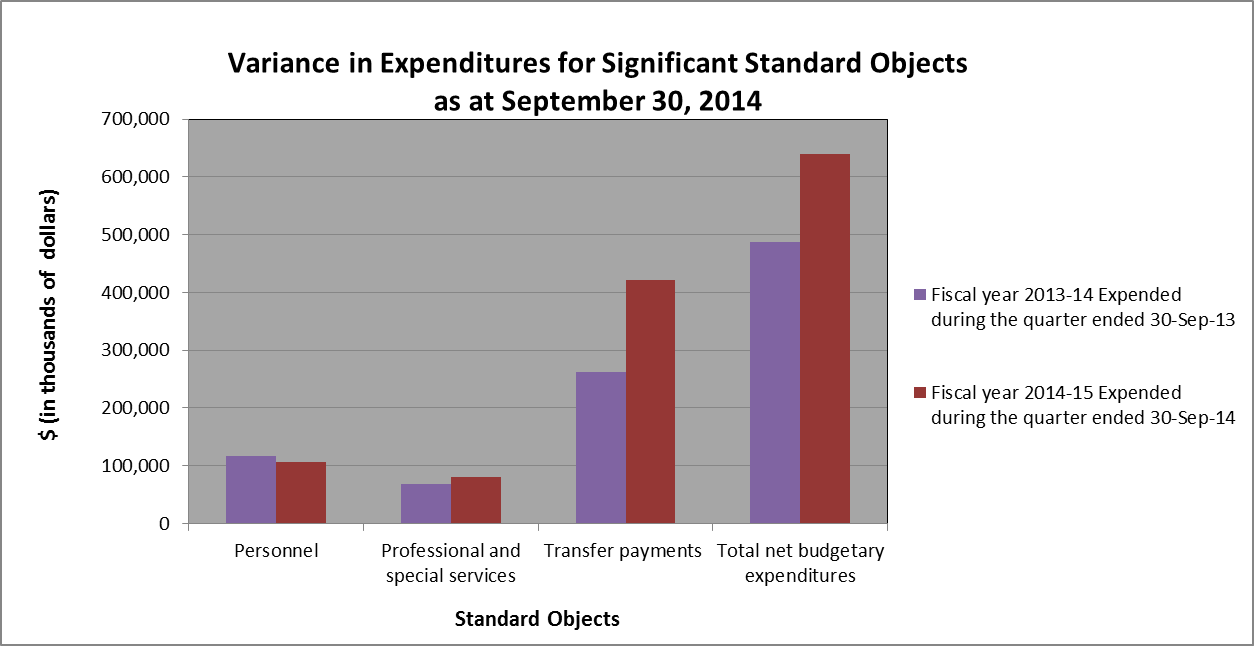
The spending from July 1, 2014 to September 30, 2014 amounts to $638.9 million or 23% of total funding available for the fiscal year, compared to $487 million or 17.5% for the same quarter last year. Therefore, spending for the second quarter for the current fiscal year has been higher than last fiscal year, mainly related to an increase in transfer payments in 2014-15 compared to payments in 2013-14. Further analysis has been done on standard objects with significant expenses, which is represented on Graph 2 below. Table 2 at the end of this document presents the spending for all standard objects.
Graph 2
Text version
| Standard Object | Fiscal year 2013-14 Expended during the quarter ended 30-Sep-13 |
Fiscal year 2014-15 Expended during the quarter ended 30-Sep-14 |
|---|---|---|
| Personnel | 116,675 | 106,767 |
| Professional and special services | 68,037 | 80,263 |
| Transfer payments | 263,005 | 420,943 |
| Total net budgetary expenditures | 487,044 | 638,884 |
The net decrease of $9.9 million in personnel expenditures for the period July 1 to September 30 between the second quarters of 2014-15 ($106.8 million) and 2013-14 ($116.7 million) is mainly explained by a decrease in FTEs due to the implementation of Budget 2012 Savings Measures and the restructuring of some sectors. These reductions also decrease NRCan’s expenditures for the Contribution to the Employee Benefit Plan.
The net decrease of $14.7 million in personnel expenditures between the year-to-date expenditures at the end of the second quarters of 2014-15 ($209.7 million) and 2013-14 ($224.4 million) is related mainly to the same reasons as above.
The increase of $12.3 million in expenditures for professional and special services for the period July 1 to September 30 between the second quarters of 2014-15 ($80.3 million) and 2013-14 ($68 million) is mainly explained by the following:
Increases:
- $14.9 million related to the Nuclear Legacy Liabilities Program (NLLP) as a result of increase in payments made in Q2 of 2014-15;
- $2 million due to the ramp-up of the procurement process in 2014-15, which required the ongoing services of external nuclear, financial and legal advisors;
- $1.1 million related to the payments made to Agriculture and Agri-Food Canada for SAP services, as it was paid in Q3 in 2013-14;
- $1 million related to the Stakeholder Outreach and Engagement Fund which was only received through the Supplementary Estimates (B) in October 2013; and
- $0.4 million for the GCDOCS expenditures due to the project has already been implemented and consultants/facilitators being procured early in the fiscal year.
Decreases:
- $2.2 million for the Port Hope Area Initiative expenditures as a result of a review of the procurement approach for major contracts and subsequent decrease in contract disbursements;
- $1.6 million for the transfers to other government departments as a result of a decrease in various research and development projects;
- $1.3 million related to the timing of expenditures from one year to the next for various programs;
- $0.9 million for the Cold Stream Well relief drilling that occurred during the second quarter of 2013-14 but did not occur during the second quarter of 2014-15;
- $0.6 million related to the relocation of the Hamilton lab that was mostly completed last fiscal year; and
- $0.5 million for the Clean Energy Renewal expenditures.
The net increase of $3.4 million in expenditures for professional and special services between the year-to-date expenditures at the end of the second quarters of 2014-15 ($121.5 million) and 2013-14 ($118.1 million) relate mainly to the same reasons as above. The increase in year-to-date expenditures is smaller than the increase in the quarter as the first quarter of 2014-15 had been $8.9 million lower than the first quarter of 2013-14 as a result of the timing of expenditures from one year to the next.
The increase of $157.9 million in expenditures for transfer payments for the period July 1 to September 30 between the second quarters of 2014-15 ($420.9 million) and 2013-14 ($263 million) primarily consists of:
Increases:
- $170.3 million under the Atlantic Offshore Accord Acts, of which $157.3 million is for the payment to the Newfoundland Offshore Petroleum Resource Revenue Fund and $13 million, is for the payment to the Nova Scotia Offshore Revenue Account. These statutory payments mirror, for the most part, royalty revenues collected in relation to offshore oil and gas activity and fluctuate based on oil and gas prices and production levels;
- $3.5 million for the ecoENERGY Innovation Initiative due to a greater number of contribution agreements that are fully active compared to the second quarter of last year;
- $0.7 million for the Wind Power Producer Incentive program as a result of greater incentives distributed due to idealized conditions for wind;
- $0.4 million for the Contribution to the Canada-Newfoundland and Labrador Offshore Petroleum Board and the Contribution to the Canada/Nova Scotia Offshore Petroleum Board; and
- $0.3 million for the Clean Energy Fund due to a greater number of contribution agreements that are fully active compared to the second quarter of last year.
Decreases:
- $12.9 million for the Nova Scotia Crown Share Payment since the payment has been delayed to the third quarter in the current year;
- $1.8 million for the ecoENERGY for Biofuels Producer Incentive mainly due to a declining incentive rate, which is part of the program design as the program itself is in its declining years;
- $0.7 million for the African Model Forest Initiative since the program terminated on March 31, 2014;
- $0.7 million for the ecoENERGY for Renewable Power program due to slightly lower production levels of renewable resources in the second quarter of fiscal year 2014-15;
- $0.4 million for the Expanding Market Opportunities Program due to the declining funding profile; and
- $0.2 million for the Forest Communities Program due to the termination of the program in fiscal year 2013-14.
The net increase of $167.6 million in expenditures for transfer payments between the year-to-date expenditures at the end of the second quarter of 2014-15 ($508.6 million) and 2013-14 ($341 million) is mainly related to the same reasons as above in addition to the following:
Increases:
- $0.8 million for the Isotope Technology Acceleration Program due to the advances given in the contribution program according to the proponent agreements in the first quarter of fiscal year 2014 -15.
Decreases:
- $0.4 million for the Forest Innovation Program due to the declining funding profile.
In addition, the increase of $4.9 million in expenditures between the year-to-date expenditures at the end of the second quarters of 2014-15 ($25.5 million) and 2013-14 ($20.6 million) for “Other subsidies and payments” is mainly due to a one-time transition payment of $12.5 million for implementing salary payment in arrears by the Government of Canada in 2014-15, offset by a reduction of $7.6 million related to the Interdepartmental Settlement Suspense Account in 2013-14.
3. Risks and Uncertainties
NRCan manages a number of risks, the most prominent of which are identified in its Corporate Risk Profile. Many of these risks relate to uncertainties in the global context and their potential impacts on Canada’s natural resource sectors which, given their significant contribution to the economy, might impact the country’s prosperity. As the lead on natural resource issues at the federal level, NRCan plays a key role in managing these risks. NRCan also handles a range of operational risks.
In the short run, the global economy is continuing to expand at a moderate, but uneven pace. After a difficult first half to 2014, largely caused by poor weather in the United States, financial market turbulence and several geopolitical conflicts, the Organization for Economic Co-operation and Development (OECD) revised downward the forecasted economic growth in 2014 for Canada, the United States and the European Union, as compared to the four months prior. This may impact the demand for natural resources. While the medium-term outlook for global demand for energy is growing, Canada faces challenges to maintain an attractive climate for resource development, driven in part by existing infrastructure limitations and public confidence issues.
These macro challenges impact all levels of Canada’s resource industries and create uncertainties that may constrain their ability to execute on their business plans. This may affect the pace at which the Department’s projects conducted in partnership with external stakeholders and industry – including joint research, development and demonstration projects – can be implemented.
Internally, NRCan has mitigated financial risks by closely tracking program uptake, following best practices in accordance with the Financial Administration Act and requesting the reprofiling of funds, as required, to ensure program objectives continue to be met.
NRCan continues to manage financial uncertainty associated with the sunsetting of specific time-limited programs. NRCan also faces challenges in addressing the need to absorb costs related to collective bargaining as well as addressing mounting financial pressures resulting from its aging real property assets. NRCan mitigates its financial risks through scenario planning, the conduct of a monthly analysis of trends and forecasting in salary expenditures and non-salary expenditures, and comprehensive quarterly reviews. NRCan has also implemented several specific initiatives to address these challenges including the development of sector-specific plans to meet existing and anticipated sector financial pressures.
4. Significant Changes in Relation to Operations, Personnel, Programs
No significant changes in relation to operations, personnel or programs occurred during the second quarter of 2014-15.
5. Budget 2012 Implementation
This section provides an overview of the savings measures announced in Budget 2012, which have been implemented to refocus government and programs, make it easier for Canadians and businesses to deal with their government, and modernize and reduce the back office.
NRCan’s budget was adjusted in 2012 to implement ongoing annual savings of $107 million by 2014-15, with additional annual savings of $5 million associated with the horizontal review of the International Assistance Envelope. In achieving these savings, NRCan has streamlined corporate support to ensure sustainability and achieve internal efficiencies; focused on core roles and alignment with Government priorities; focused on work that provides clear economic benefits and adapts to changing industry circumstances; and scaled back programs to maintain affordability. In the first year of implementation, NRCan achieved savings of $67.8 million. Savings increased to $84.7 million in 2013-14 and to $107 million in 2014-15 and for future years. In addition, annual savings of $5 million, which began in 2012-13, were achieved through the horizontal review of the International Assistance Envelope.
In implementing these changes, NRCan has made it a priority to treat its employees in an equitable, transparent and respectful manner. The transition to a smaller workforce is virtually complete and the Department is supporting a very small number of employees still engaged in the workforce adjustment process. A planning, monitoring and reporting framework for tracking implementation of Budget 2012 savings measures was developed, and progress on financial, HR and operational adjustments for specific savings initiatives was tracked on a quarterly basis since June 2013. During the fourth quarter of 2013-14, Assistant Deputy Ministers accountable for monitoring and reporting on Budget 2012 savings measures were asked to complete attestation forms confirming the completion of their implementation plans and providing an overall attestation for the implementation of all Budget 2012 savings measures and indicating any exceptions, impacts and corrective actions. All plans were reported as having been fully implemented.
Approved by:
| Original Signed by | Original Signed by | |
Bob Hamilton Deputy Minister |
Kami Ramcharan, CMA Chief Financial Officer |
|
| November 26, 2014 Ottawa, Canada |
November 24, 2014 Ottawa, Canada |
Table 1: Statement of Authorities (unaudited)
(in thousands of dollars)
| Fiscal year 2014-15 | Fiscal year 2013-14 | |||||
|---|---|---|---|---|---|---|
| Total available for use for the year ending March 31, 2015* |
Used during the quarter ended September 30, 2014 |
Used year-to-date at quarter-end |
Total available for use for the year ending March 31, 2014** |
Used during the quarter ended September 30, 2013 |
Used year-to-date at quarter-end |
|
| Vote 1 - Net Operating Expenditures | 885,669 | 201,200 | 349,486 | 799,352 | 203,606 | 358,907 |
| Vote 5 - Capital Expenditures | 15,880 | 2,920 | 5,112 | 25,535 | 5,457 | 6,279 |
| Vote 10 - Grants and Contributions | 444,039 | 76,780 | 98,722 | 638,924 | 76,663 | 103,641 |
| Statutory Payments | ||||||
| Minister of Natural Resources – Salary and motor car allowance | 80 | 20 | 40 | 79 | 20 | 39 |
| Contributions to employee benefit plans | 55,168 | 13,792 | 27,584 | 59,957 | 14,927 | 29,853 |
| Collection agency fees under sec 17.1 of the Financial Administration Act | - | - | - | - | 2 | 2 |
| Spending of amounts equivalent to proceeds from disposal of surplus crown assets | - | 8 | 8 | - | 28 | 28 |
| Canada Foundation for Sustainable Development Technology Grant | 79,338 | - | - | - | - | - |
| Contribution to the Canada/Newfoundland Offshore Petroleum Board | 7,756 | 2,209 | 4,418 | 7,756 | 1,913 | 3,825 |
| Contribution to the Canada/Nova Scotia Offshore Petroleum Board | 3,550 | 1,045 | 1,983 | 3,550 | 938 | 1,875 |
| Payments to the Nova Scotia Offshore Revenue Account | 68,216 | 21,846 | 28,567 | 79,339 | 8,866 | 10,835 |
| Payments to the Newfoundland Offshore Petroleum Resource Revenue Fund | 1,199,509 | 319,064 | 374,914 | 1,142,062 | 161,770 | 208,010 |
| Crown Share Adjustment Payments for Nova Scotia Offshore Petroleum Resources | 14,394 | - | - | 22,460 | 12,856 | 12,856 |
| Total Statutory Payments | 1,428,011 | 357,984 | 437,514 | 1,315,203 | 201,318 | 267,323 |
| Total Budgetary Authorities | 2,773,599 | 638,884 | 890,834 | 2,779,014 | 487,044 | 736,150 |
* Total available for use includes only authorities available for use and granted by Parliament at quarter-end through the Main Estimates, Supplementary Estimates (A) as well as
carry forward from fiscal year 2013-14 and does not reflect measures announced in Budget 2014.
** Total available for use includes only authorities available for use and granted by Parliament at quarter-end through the Main Estimates and Supplementary Estimates (A)
and does not reflect measures announced in Budget 2013.
Table 2: Budgetary Expenditures by Standard Object (unaudited)
(in thousands of dollars)
| Fiscal year 2014-15 | Fiscal year 2013-14 | |||||
|---|---|---|---|---|---|---|
| Planned expenditures for the year ending March 31, 2015* |
Expended during the quarter ended September 30, 2014 |
Year-to-date used at Quarter- end |
Planned expenditures for the year ending March 31, 2014** |
Expended during the quarter ended September 30, 2013 |
Year-to-date used at Quarter-end |
|
| Budgetary Expenditures: | ||||||
| Personnel | 390,814 | 106,767 | 209,724 | 404,149 | 116,675 | 224,415 |
| Transportation and communication | 25,856 | 4,424 | 5,671 | 39,679 | 3,805 | 6,344 |
| Information | 9,871 | 1,382 | 2,096 | 10,792 | 8,819 | 12,267 |
| Professional and special services | 471,140 | 80,263 | 121,465 | 336,497 | 68,037 | 118,098 |
| Rentals | 17,123 | 9,731 | 13,107 | 20,352 | 6,683 | 9,903 |
| Repair and maintenance | 5,705 | 494 | 813 | 8,110 | 718 | 909 |
| Utilities, materials and supplies | 28,537 | 4,233 | 6,056 | 32,288 | 3,646 | 5,853 |
| Acquisition of land, buildings and works | 6,713 | 74 | 226 | 24,982 | 52 | 52 |
| Acquisition of machinery and equipment | 28,000 | 3,328 | 6,361 | 33,682 | 5,641 | 8,021 |
| Transfer payments | 1,816,802 | 420,943 | 508,603 | 1,894,091 | 263,005 | 341,042 |
| Other subsidies and payments | 8,089 | 11,818 | 25,532 | 10,160 | 14,504 | 20,596 |
| Total Budgetary Expenditures | 2,808,650 | 643,457 | 899,655 | 2,814,782 | 491,585 | 747,499 |
| Less: | ||||||
| Total Revenues Netted Against Expenditures | 35,051 | 4,573 | 8,821 | 35,768 | 4,541 | 11,349 |
| Total Net Budgetary Expenditures | 2,773,599 | 638,884 | 890,834 | 2,779,014 | 487,044 | 736,150 |
* Planned expenditures do not reflect measures announced in Budget 2014.
** Planned expenditures do not reflect measures announced in Budget 2013.