
Statement outlining results, risks and significant changes in operations, personnel and programs
1. Introduction
This quarterly financial report should be read in conjunction with the Main Estimates, Supplementary Estimates (A) and Supplementary Estimates (B), as well as Canada’s Budget 2016. It has been prepared by management as required by section 65.1 of the Financial Administration Act and in the form and manner prescribed by Treasury Board. This quarterly financial report has not been subject to an external audit or review.
1.1 Authority, Mandate and Programs
Natural Resources Canada (NRCan) seeks to enhance the responsible development and use of Canada’s natural resources and the competitiveness of Canada’s natural resource sectors. The Department is an established leader in science and technology in the fields of energy, forests, and minerals and metals, and applies its expertise in earth sciences to build and maintain an up-to-date knowledge base of Canada’s landmass. NRCan develops policies and programs that enhance the contribution of the natural resource sectors to the economy and improve the quality of life of Canadians.Footnote 1
Further details on NRCan’s authority, mandate and programs can be found in Part II of the Main Estimates.
1.2 Basis of Presentation
This quarterly financial report has been prepared by management using an expenditure basis of accounting. The accompanying Statement of Authorities includes NRCan’s spending authorities granted by Parliament, and those used by NRCan are consistent with the Main Estimates, Supplementary Estimates (A) and Supplementary Estimates (B) for the 2016-17 fiscal year. This quarterly report has been prepared using a special purpose financial reporting framework.
The authority of Parliament is required before monies can be spent by the Government. Approvals are given in the form of annually approved limits through appropriation acts or through legislation in the form of statutory spending authority for specific purposes.
As part of the Parliamentary business of supply, the Main Estimates must be tabled in Parliament on or before March 1 preceding the new fiscal year. As the Federal Budget is typically tabled around the same time as Main Estimates, measures announced in the Budget are not included in Main Estimates for either 2015-16 or 2016-17.
In fiscal year 2016-17, frozen allotments have been established by Treasury Board authority in departmental votes to prohibit the spending of funds identified as savings measures in Budget 2016. The changes to departmental authorities for future years will be implemented through the Annual Reference Level Update, as approved by Treasury Board, and reflected in the subsequent Main Estimates tabled in Parliament. The same approach was taken in 2015-16 for savings measures in Budget 2015.
NRCan uses the full accrual method of accounting to prepare and present its annual unaudited departmental financial statements, which are part of the Departmental Performance Report. However, the expenditure authorities voted by Parliament remain on an expenditure basis.
2. Highlights of Fiscal Quarter and Fiscal Year-to-Date Results
This Departmental Quarterly Financial Report reflects the results as at December 31, 2016, including Main Estimates, Supplementary Estimates (A) and Supplementary Estimates (B), for which full supply was released. The details presented in this report focus on and compare the third quarter results of 2016-17 with those of 2015-16.
Authorities
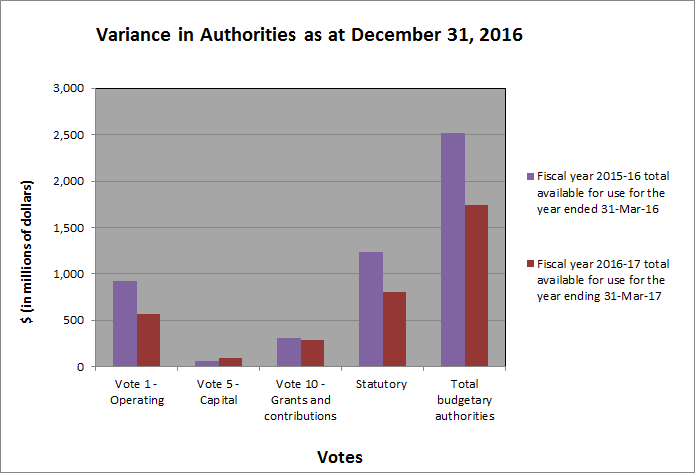
As per Table 1, presented at the end of this document, and on Graph 1 below, as at December 31, 2016 NRCan has authorities available for use of $1,743.3 million in 2016-17 compared to $2,523.2 million as of December 31, 2015, for a net decrease of $779.9 million or 31%.
Graph 1
Text version
| (in millions of dollars) | Fiscal year 2015-16 total available for use for the year ending 31-Mar-16 |
Fiscal year 2016-17 total available for use for the year ending 31-Mar-17 |
|---|---|---|
| Vote 1 - Operating | 924 | 565 |
| Vote 5 - Capital | 54 | 88 |
| Vote 10 - Grants and contributions | 307 | 288 |
| Statutory | 1,239 | 803 |
| Total budgetary authorities | 2,523 | 1,743 |
The decrease of $779.9 million in authorities in 2016-17 compared to 2015-16 is explained by the net effect of both increases and decreases within Vote 1 operating expenditures, Vote 5 capital expenditures, Vote 10 grants and contributions, and statutory authorities, as per the following:
For Vote 1 operating expenditures, a net decrease of $359.0 million between the authorities available for use at the end of the third quarters of 2016-17 ($564.7 million) and 2015-16 ($923.7 million) is explained mainly by the following year-over-year changes:
Decreases:
- $395.2 million for the transfer of responsibility for the Nuclear Legacy Liabilities Program and Port Hope Area Initiative to Atomic Energy Canada Limited (AECL); and
- $7.3 million for the Operating Budget Carry Forward as there were fewer authorities available to carry forward in 2016-17.
Increases:
- $14.5 million for the Soldier Settlement Board mineral rights and implementation of the transfer agreement with the Government of Manitoba, most of which was reprofiled from fiscal year 2015-16 to 2016-17;
- $7.0 million for the transfers from Capital to Operating, as part of planned decrease in capital expenditures;
- $5.0 million for the United Nations Convention on the Law of the Sea (UNCLOS) - Mapping of the North Pole, due to a planned adjustment to the program financial profile;
- $3.3 million for Major Project Management Office Initiative; similar funding for 2015-16 was only received in the fourth quarter of 2015-16;
- $2.9 million for the Protection of Marine and Coastal areas, a new initiative announced in Budget 2016;
- $2.8 million for the Accelerated Infrastructure Program (AIP), as this program received additional funds via Budget 2016; and
- $2.4 million for the modernization of the National Energy Board, a new initiative in 2016-17.
For Vote 5 capital expenditures, a net increase of $33.4 million between the authorities available for use at the end of the third quarters of 2016-17 ($87.7 million) and 2015-16 ($54.3 million) is explained mainly by the following year-over-year changes:
Increases:
- $29.2 million for the AIP, as this program received additional funds via Budget 2016;
- $6.1 million for the Enhancing National Earthquake Monitoring initiative, due to a planned adjustment to the program financial profile; and
- $4.9 million for the Capital Budget Carry Forward as there were more authorities to carry forward in 2016-17.
Decrease:
- $7.0 million for the transfers from Capital to Operating, as part of planned decrease in capital expenditures.
For Vote 10 grants and contributions, a net decrease of $19.0 million between the authorities available for use at the end of the third quarters of 2016-17 ($287.6 million) and 2015-16 ($306.6 million) is explained mainly by the following year-over-year changes:
Decreases:
- $25.7 million for the Climate Change Renewal, as the envelope - announced in Budget 2016- was at a lower level than that of 2015-16;
- $22.0 million for ecoENERGY for Biofuels, due to a planned adjustment to the program financial profile; and
- $13.6 million for the Wind Power Production Incentive Program, due to a planned adjustment in the program financial profile.
Increases:
- $13.8 million for the Investments in Forest Industry Transformation (IFIT) program, due to a planned adjustment to the program financial profile;
- $11.3 million for the Sustainable Development Technology Canada (SDTC) Sustainable Development Technology Fund, due to a planned adjustment to the program financial profile from $6.0 million in 2015-16 to $46.2 million in 2016-17, offset by a decrease of $28.9 million for the transfer of responsibility for SDTC to the Department of Innovation, Science and Economic Development via the 2016-17 Supplementary Estimates (A);
- $12.9 million for the Green Infrastructure, a group of new initiatives announced in Budget 2016; and
- $4.9 million for cleaner oil and gas technologies, a new initiative announced in Budget 2016.
For statutory items, a net decrease of $435.5 million between the authorities available for use at the end of the third quarters of 2016-17 ($803.2 million) and 2015-16 ($1,238.7 million) is explained mainly by:
Decreases:
- $368.1 million in the Newfoundland Offshore Petroleum Resource Revenue Fund, as forecasts at the time of Main Estimates were that less revenue would be collected in 2016-17 than in 2015-16, due to lower oil pricesFootnote 2;
- $59.9 million in the Nova Scotia Offshore Revenue Account, as forecasts at the time of Main Estimates were that less revenue would be collected in 2016-17 than in 2015-16 due to decreased production and lower natural gas pricesFootnote 2; and
- $10.6 million pertaining to the Crown Share Adjustment Payments for Nova Scotia Offshore Petroleum Resources, due to a planned adjustment to the financial profile.
Increase:
- $3.2 million in Employee Benefit Plan adjustment, mostly due to the increased rate in 2016-17 compared to 2015-16.
In addition to the above detail, other minor increases and decreases occurred within the appropriated funding and in other statutory departmental programs.
Budgetary Expenditures by Standard Object
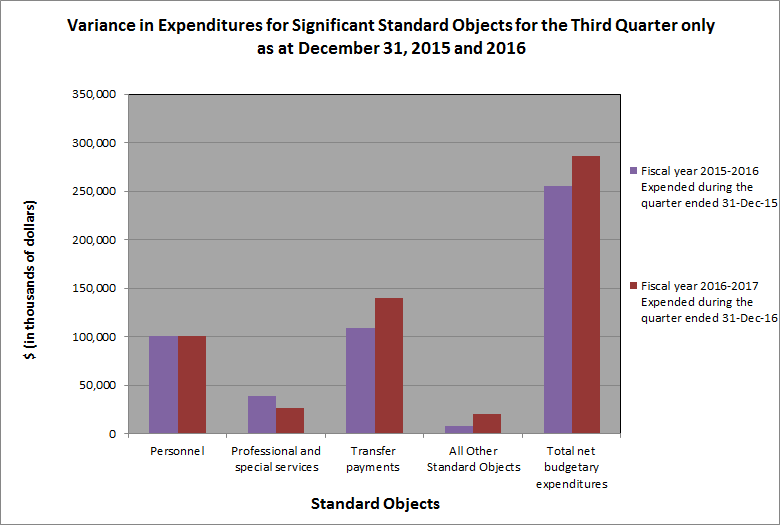
The spending for the quarter ending December 31, 2016 amounts to $286.2 million or 16% of total funding available for the current fiscal year, compared to $254.8 million or 10% for the same quarter of the previous fiscal year. This increase of $31.4 million is mainly related to increased expenditures for transfer payments in 2016-17 compared to transfer payments in 2015-16. Further analysis has been done on standard objects with significant expenses, which is presented on Graph 2 below; and Table 2 at the end of this document presents the spending for all standard objects.
Graph 2
Text version
| (in thousands of dollars) | Fiscal year 2015-16 Expended during the quarter ended 31-Dec-15 |
Fiscal year 2016-17 Expended during the quarter ended 31-Dec-16 |
|---|---|---|
| Personnel | 100,123 | 100,373 |
| Professional and special services | 38,504 | 25,906 |
| Transfer payments | 108,774 | 140,080 |
| All Other Standard Objects | 7,352 | 19,854 |
| Total net budgetary expenditures | 254,753 | 286,213 |
For the personnel expenditures, there are no significant variances between the third quarters of 2016-17 and 2015-16.
The net decrease of $3.6 million in personnel expenditures between the year-to-date expenditures at the end of the third quarters of 2016-17 ($303.9 million) and 2015-16 ($307.5 million) is mainly due to the sun-setting of the ecoENERGY for Biofuels program and changes in the Energy Efficiency program structure.
The net decrease of $12.6 million in expenditures for professional and special services between the third quarters of 2016-17 ($25.9 million) and 2015-16 ($38.5 million) is mainly explained by the following:
Decreases:
- $10.0 million for the transfer of responsibility for the Nuclear Legacy Liabilities Program and Port Hope Area Initiative to AECL in 2015-16;
- $1.6 million due to changes in the Energy Efficiency program design and the sun-setting of the ecoENERGY for Biofuels program; and
- $0.7 million due to the completion of the operational phase of the Cold Stream Well Remediation initiative in 2015-16.
Increase:
- $1.2 million due to higher litigation expenses related to softwood lumber in the third quarter of the current fiscal year compared to the same period in 2015-16.
The net decrease of $80.1 million in expenditures for professional and special services between the year-to-date expenditures at the end of the third quarters of 2016-17 ($71.2 million) and 2015-16 ($151.3 million) is mainly due to the same reasons as above.
The net increase of $31.3 million in expenditures for transfer payments between the third quarters of 2016-17 ($140.1 million) and 2015-16 ($108.8 million) primarily consists of:
Increases:
- $32.6 million for statutory Atlantic offshore transfers due to more payments being made in comparison to the third quarter of 2015-16;
- $4.5 million related to the timing differences of the receipt and processing of invoices; and
- $2.5 million for the Expanding Market Opportunities program, as there were higher claim requests in comparison to the third quarter of 2015-16.
Decreases:
- $4.4 million for IFIT contribution program as there were lower payment requests in comparison to the third quarter of 2015-16; and
- $3.8 million related to the completion of the ecoENERGY Innovation Initiative in 2015-16.
The net increase of $44.0 million in expenditures for transfer payments between the year-to-date expenditures at the end of the third quarter of 2016-17 ($380.6 million) and 2015-16 ($336.6 million) is mainly related to the same reasons as above as well as the payments made to SDTC in the first quarter of 2016-17.
In addition to the above details, other minor increases and decreases were observed within different standards objects.
3. Risks and Uncertainties
NRCan recognizes that a solid understanding of its risk environment is fundamental to achieving its strategic outcomes and maintaining operational efficiency and effectiveness. NRCan sees risk management as an essential element in developing and implementing efficient, effective and relevant policies, programs, science and technology and internal services. NRCan’s approach to risk management is codified in the Integrated Risk Management Policy Framework, which is aligned with the Treasury Board Framework for the Management of Risk.
Natural resources are at the nexus of Canada’s economic and environmental agendas. They bring large economic benefits, accounting for about 17% of Canada’s nominal gross domestic product and 1.77 million jobs. Furthermore, they inform Canada’s environmental performance.
Our collective challenge, which is also an opportunity, is to set and implement a plan that will ensure the growth of the resource sectors and the achievement of our goals in terms of the reduction of our greenhouse gas emissions.
Over the last few months, the Government of Canada has undertaken a whole-of-government approach to further address these challenges, leveraging the resources and input of NRCan and multiple other departments. Some specific initiatives include:
- Announcing a price on carbon;
- Identifying a set of actions on energy that will be undertaken with the provinces and territories and contributing to the Pan-Canadian Framework on Clean Growth and Climate Change; and
- Approving the Pacific NorthWest Liquefied Natural Gas facilities, the Trans Mountain Expansion and Line 3 Pipeline Replacement Project to move resources to new markets as well as to create jobs and opportunities across the country.
NRCan is closely monitoring the impacts of these and other developments and taking actions to ensure that our resource sectors remain a source of jobs, prosperity and opportunity in a world that values sustainable practices. Among the key events that have marked the third quarter are the Organization of the Petroleum Exporting Countries (OPEC) agreement to cut production for the first time in eight years, and the United States (US) election. In response, the department has quickly engaged with the new US administration to discuss matters of common interest.
In addition to being responsive to its external context, NRCan also manages uncertainties regarding its future funding level and spending. The Department continues to manage the costs related to unfunded collective bargaining. In response, it tracks its financial risks through scenario planning, monthly analysis of trends and forecasting in both salary and non-salary expenditures, and comprehensive quarterly reviews.
NRCan will continue to integrate risk information into strategic and operational decision making.
4. Significant Changes in Relation to Operations, Personnel, Programs
No significant change in relation to operations, personnel or programs occurred during the third quarter of 2016-17.
Original signed by:
___________________________________________
Christyne Tremblay
Deputy Minister
February 27, 2017
Ottawa, Canada
___________________________________________
Cheri Crosby, CPA
Chief Financial Officer
February 16, 2017
Ottawa, Canada
| (in thousands of dollars) | Fiscal year 2016-17 | Fiscal year 2015-16 | ||||
|---|---|---|---|---|---|---|
| Total available for use for the year ending March 31, 2017* | Used during the quarter ended December 31, 2016 | Used year-to-date at quarter-end | Total available for use for the year ending March 31, 2016** |
Used during the quarter ended December 31, 2015 |
Used year- to-date at quarter-end |
|
| Vote 1 - Net Operating Expenditures | 564,744 | 111,400 | 364,227 | 923,658 | 124,029 | 448,741 |
| Vote 5 - Capital Expenditures | 87,738 | 19,072 | 35,337 | 54,302 | 7,565 | 14,388 |
| Vote 10 - Grants and Contributions | 287,564 | 47,893 | 128,062 | 306,609 | 46,670 | 121,906 |
| Statutory Payments | ||||||
| Minister of Natural Resources – Salary and motor car allowance |
84 | 30 | 49 | 82 | 16 | 57 |
| Contributions to employee benefit plans | 59,826 | 13,325 | 39,973 | 56,645 | 14,082 | 42,249 |
| Spending of amounts equivalent to proceeds from disposal of surplus crown assets |
- | 105 | 106 | - | 285 | 285 |
| Canada Foundation for Sustainable Development Technology Grant |
- | - | 2,290 | - | 338 | 338 |
| Contribution to the Canada/ Newfoundland Offshore Petroleum Board |
8,835 | (55) | 4,363 | 8,835 | 1,822 | 6,240 |
| Contribution to the Canada/Nova Scotia Offshore Petroleum Board |
4,013 | (184) | 1,994 | 3,965 | - | 2,121 |
| Payments to the Nova Scotia Offshore Revenue Account |
14,828 | 5,416 | 8,360 | 74,752 | 5,472 | 14,751 |
| Payments to the Newfoundland Offshore Petroleum Resource Revenue Fund |
713,253 | 89,211 | 236,267 | 1,081,331 | 54,473 | 178,954 |
| Crown Share Adjustment Payments for Nova Scotia Offshore Petroleum Resources | 2,408 | - | 1,607 | 13,055 | - | 12,322 |
| Total Statutory Payments | 803,247 | 107,848 | 295,009 | 1,238,666 | 76,488 | 257,317 |
| Total Budgetary Authorities | 1,743,293 | 286,213 | 822,635 | 2,523,235 | 254,752 | 842,352 |
* Total available for use includes only authorities available for use and granted by Parliament at quarter-end through the Main Estimates, Supplementary Estimates (A), Supplementary Estimates (B), and carry forward from 2015-16; and reflects some measures announced in Budget 2016.
** Total available for use includes only authorities available for use and granted by Parliament at quarter-end through the Main Estimates, Supplementary Estimates (A), Supplementary Estimates (B), and carry forward from 2014-15; and reflects some measures announced in Budget 2015.
| (in thousands of dollars)
|
Fiscal year 2016-17 | Fiscal year 2015-16 | |||||
|---|---|---|---|---|---|---|---|
| Planned expenditures for the year ending March 31, 2017* | Expended during the quarter ended December 31, 2016 | Year-to-date used at Quarter-end | Planned expenditures for the year ending March 31, 2016** | Expended during the quarter ended December 31, 2015 | Year-to-date used at Quarter-end | ||
| Budgetary Expenditures: | |||||||
| Personnel | 403,872 | 100,373 | 303,944 | 394,827 | 100,123 | 307,544 | |
| Transportation and communication | 14,675 | 3,009 | 9,792 | 15,926 | 3,822 | 10,261 | |
| Information | 9,349 | 975 | 2,781 | 12,915 | 779 | 2,038 | |
| Professional and special services | 142,952 | 25,906 | 71,212 | 523,576 | 38,504 | 151,288 | |
| Rentals | 33,170 | 1,591 | 15,251 | 15,276 | 1,986 | 15,599 | |
| Repair and maintenance | 4,157 | 7,527 | 12,059 | 9,832 | 2,722 | 5,356 | |
| Utilities, materials and supplies | 34,084 | 4,100 | 11,104 | 33,329 | 3,613 | 10,018 | |
| Acquisition of land, buildings and works | 38,068 | 155 | 155 | 7,071 | 553 | 1,018 | |
| Acquisition of machinery and equipment | 51,681 | 6,177 | 11,630 | 51,483 | 2,375 | 5,637 | |
| Transfer payments | 1,030,901 | 140,080 | 380,641 | 1,488,547 | 108,774 | 336,631 | |
| Other subsidies and payments | 19,254 | 4,294 | 23,042 | 5,532 | 696 | 15,011 | |
| Total Budgetary Expenditures | 1,782,163 | 294,187 | 841,611 | 2,558,313 | 263,947 | 860,401 | |
| Less: | |||||||
| Total Revenues Netted Against Expenditures | 38,870 | 7,974 | 18,976 | 35,079 | 9,194 | 18,049 | |
| Total Net Budgetary Expenditures | 1,743,293 | 286,213 | 822,635 | 2,523,235 | 254,753 | 842,352 | |
* Planned expenditures reflect some measures announced in Budget 2016.
** Planned expenditures reflect some measures announced in Budget 2015.