
Gross domestic product
In 2024, the natural resources sector directly and indirectly accounted for 16.0% of nominal GDP in Canada ($459 billion).

Text version
This pie chart displays percentages of Canada’s nominal GDP. Natural resources directly contributed 12.7% and indirectly contributed 3.3%, while other sectors contributed 84.0%. The energy sector contributed 7.8%, the minerals and metals sector contributed 3.9%, and the forest sector contributed 1.0%.
Employment
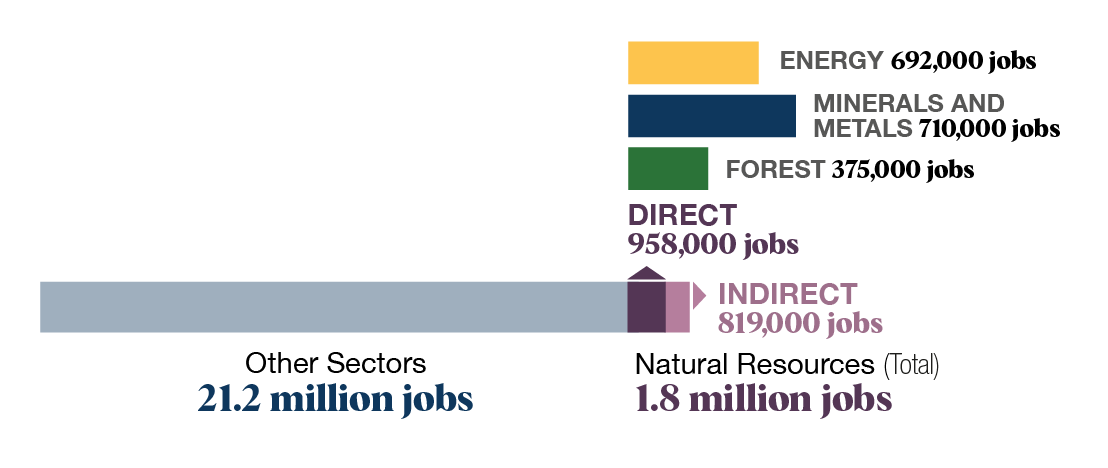
In 2024, the natural resources sector directly and indirectly accounted for 1.8 million jobs in Canada.
Text version
This bar chart shows the number of direct and indirect jobs in natural resources, including 692,000 jobs in the energy sector, 710,000 in the minerals and metals sector, and 375,000 in the forest sector. This stacked bar chart shows the number of direct and indirect jobs in various sectors, including 819,000 indirect and 958,000 direct natural resources jobs, totaling 1.8 million, and 21.2 million jobs in other sectors.
Post-secondary attainment
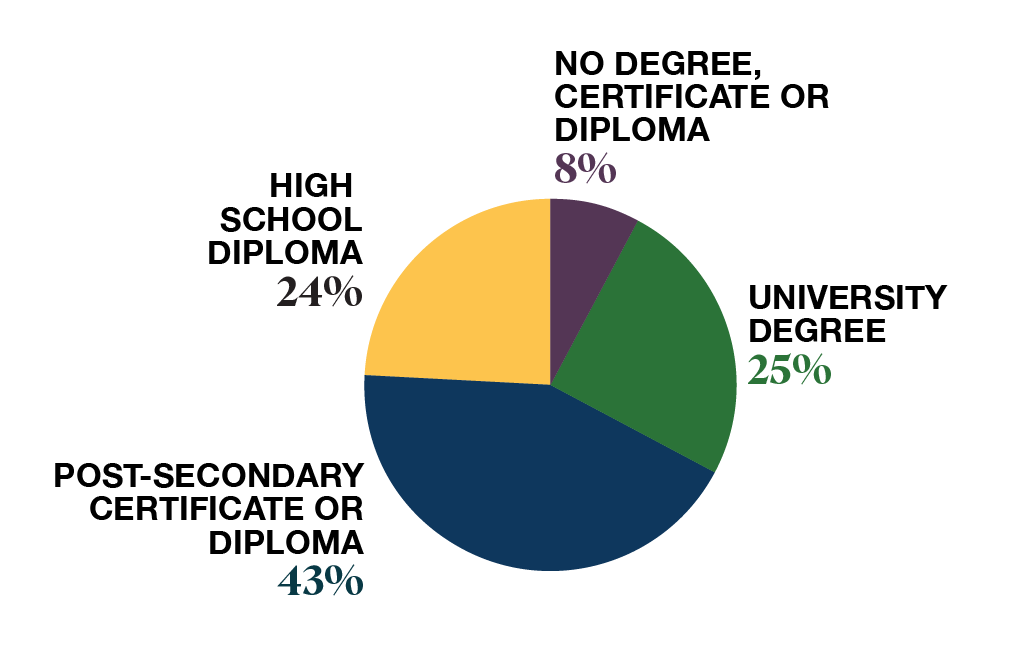
In 2024, 68% of workers in the natural resources sector had a post-secondary certificate, diploma, or degree.
Text version
This pie chart displays the percentages of employees in the natural resources sector who have attained post-secondary education. It shows that 24% of employees had a high school diploma, 8% had no degree, certificate or diploma, 43% had a post-secondary certificate or diploma, and 25% had a university degree.
Major projects
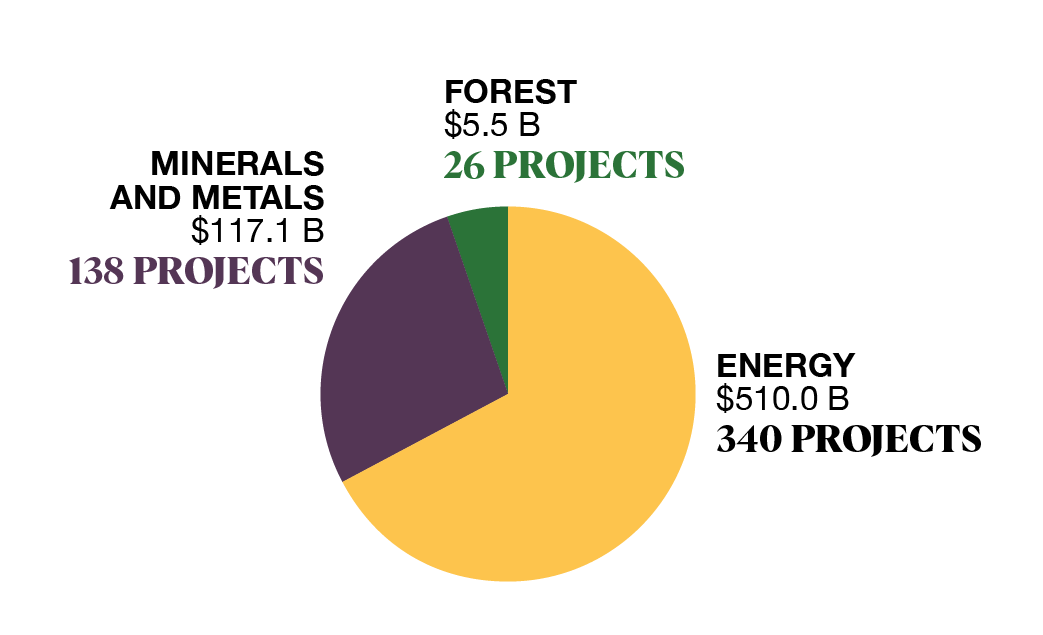
In September 2024, there were 504 major resource projects under construction or planned over the next 10 years in Canada, worth $632.6 billion in potential investment.
Text version
This pie chart displays sector investments and numbers of major resource projects in three sectors, including 138 projects in the minerals and metals sector (worth $17.1 billion), 26 in the forest sector ($5.5 billion), and 340 in the energy sector ($510 billion).
Revenues
Governments derived $33.7 billion annually on average from the natural resources sector from 2019 to 2023.

Note: Excludes indirect taxes.
Exports
Canada’s natural resources sector exports rose from $370 billion in 2023 to $383 billion in 2024, accounting for 53% of the value of Canada's total merchandise exports in 2024.

Text version
This world map shows the percentages of Canada’s total natural resource exports, valued at $383 billion, that went to its top 5 export countries. The countries are the United States (75%), the United Kingdom (4%), China (6%), Japan (2%), and South Korea (1%).
Note: The figures on the map are percentages of Canada’s total natural resource exports by country (5 highest).
Foreign direct investment in Canada and Canadian direct investment abroad
Canadian direct investment abroad (CDIA) in the natural resources sector increased 56.1% ($119 billion) from 2014 to 2024, reaching $331 billion.
Foreign direct investment (FDI) in Canada’s natural resources sector declined 4.9% ($14 billion) over the same 10-year period.

Text version
| Year | Foreign Direct Investment into Canada (in millions of dollars) | Canadian Direct Investment Abroad (in millions of dollars) |
|---|---|---|
| 2014 | ~285,000 | ~215,000 |
| 2015 | ~260,000 | ~235,000 |
| 2016 | ~255,000 | ~245,000 |
| 2017 | ~250,000 | ~240,000 |
| 2018 | ~265,000 | ~265,000 |
| 2019 | ~210,000 | ~290,000 |
| 2020 | ~170,000 | ~295,000 |
| 2021 | ~205,000 | ~250,000 |
| 2022 | ~215,000 | ~300,000 |
| 2023 | ~235,000 | ~310,000 |
| 2024 | ~275,000 | ~335,000 |
Resource-reliant communities
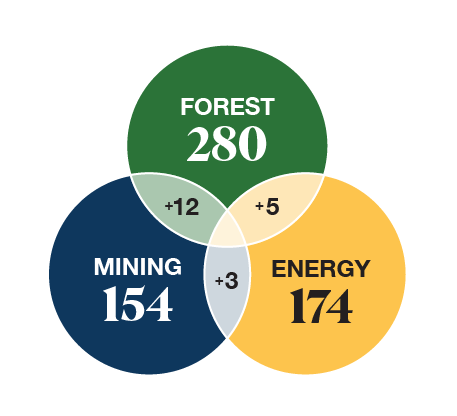
Based on the 2021, 628 communities were economically reliant on at least one natural resources sector. Of those communities, 421 were either significantly or highly reliant on at least one of the natural resources sectors.
Text version
This figure shows the number of Canadian communities that are economically dependent on natural resources in the country, including 280 of the forest sector, 174 of the energy sector, and 154 of the minerals and metals sector.
Note: Sector totals are not additive because some communities are reliant on more than 1 resource sector.
Energy intensity
Canada used 25% less energy per dollar of GDP in 2022 than in 2000.

Text version
This line chart shows Canada’s energy intensity index per dollar of GDP from 2000 to 2022. The energy intensity index gradually decreased from 100 in 2000 to 75 in 2022.
Clean technology
In 2023, clean technologies, clean energy, and environmental goods and services accounted for $80.8 billion (3.0%) of Canada's nominal GDP and provided 354,257 jobs.
The GDP in the sector grew by 16% from 2013 to 2023.
The average annual compensation per job in the sector, including benefits, was $105,768 in 2023, 38.8% higher than the national average.
The value of exports from the sector grew by 14% from $12.2 billion in 2013 to $14.0 billion in 2023.
Read key facts from previous years
Sources
- Gross Domestic Project: Natural Resources Canada estimates, based on Statistics Canada data (National Accounts).
- Employment: Natural Resources Canada estimates, based on Statistics Canada data (National Accounts).
- Post-secondary attainment: Natural Resources Canada calculations, based on custom Labour Force Survey (LFS) extract from Statistics Canada
- Major projects: Natural Resources Canada, Natural Resources: Major Projects Planned or Under Construction, 2024 to 2034
- Revenues: Natural Resources Canada estimates based on data from Statistics Canada (Table 33-10-0500-01), Canadian Association of Petroleum Producers, Mining Association of Canada, and Canadian Council of Forest Ministers
- Exports: Natural Resources Canada calculations, based on Statistics Canada data
- Foreign direct investment in Canada and Canadian direct investment abroad: Natural Resources Canada calculations, based on Statistics Canada data (Table 36-10-0009-01)
- Resource-reliant communities: Natural Resources Canada estimates, based on Statistics Canada data (2021 Census of Population)
- Energy intensity: National Energy Use Database
- Clean technology: Statistics Canada Environmental and Clean Technology Products Economic Account (Tables 36-10-0630-01, 36-10-0631-01, and 36-10-0681-01)
Notes
Totals may not add up because of rounding. Economic activity associated with coal and uranium mining are categorized with the minerals and metals sector.
In this iteration of 10 Key Facts on Canada’s Natural Resources, government revenues exclude indirect taxes. This figure is not directly comparable to previous iterations, which included indirect taxes.
The number of resource-reliant communities in 2021 has been revised since the previous iteration of this document based on the most recent Census of Population data and on Natural Resources Canada’s revised calculation methodology.