
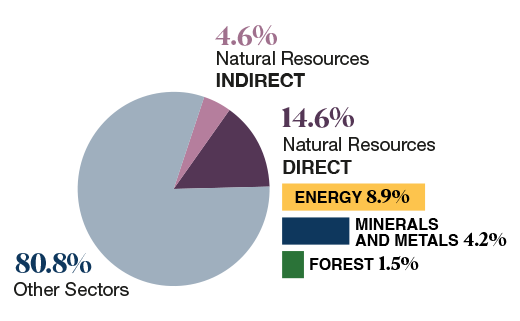
1. Gross Domestic Product
In 2022, natural resources directly and indirectly accounted for 19.2% of nominal GDP.
Source: Natural Resources Canada estimates, based on Statistics Canada data (national accounts)
Text version
This pie chart displays percentages of Canada’s nominal GDP. Natural resources directly contributed 14.6% and indirectly contributed 4.6%, while other sectors contributed 80.8%. This bar chart shows percentages of direct sector contributions to Canada’s nominal GDP. The energy sector contributed 8.9%, the minerals and metals sector contributed 4.2%, and the forest sector contributed 1.5%.
Text version
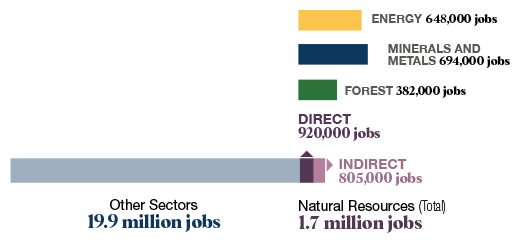
This bar chart shows the number of direct and indirect jobs in natural resources, including 648,000 jobs in the energy sector, 694,000 in the minerals and metals sector, and 382,000 in the forest sector. This stacked bar chart shows the number of direct and indirect jobs in various sectors, including 805,000 indirect and 920,000 direct natural resources jobs, totaling 1.7 million, and 19.9 million jobs in other sectors.
2. Employment
In 2022, natural resources directly and indirectly accounted for 1.7 million jobs in Canada.
Source: Natural Resources Canada estimates, based on Statistics Canada data (national accounts)
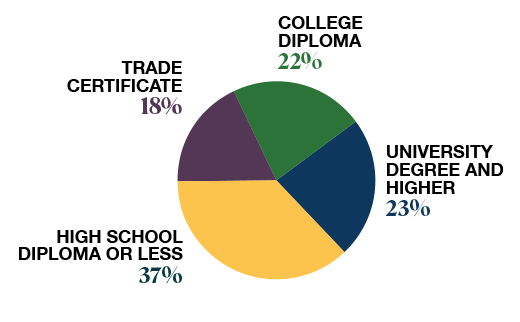
3. Post-secondary attainment
In 2021, 63% of employees in the natural resources sector had a post-secondary certificate, diploma or degree.
Source: Natural Resources Canada calculations, based on Statistics Canada data (Table 36-10-0653-01)
Text version
This pie chart displays the percentages of employees in the natural resources sector who have attained post-secondary education. It shows that 37% of employees had a high school diploma or less, 18% had a trade certificate, 22% had a college diploma, and 23% had a university degree and higher.
Text version
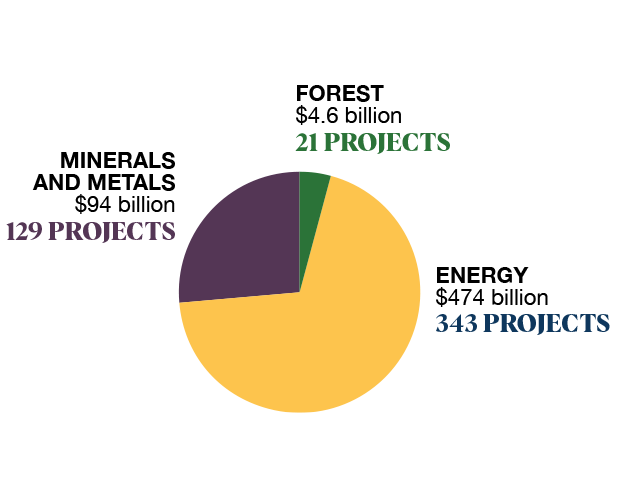
This pie chart displays sector investments and numbers of major resource projects in three sectors, including 129 projects in the minerals and metals sector (worth $94 B), 21 in the forest sector ($4.6 B), and 343 in the energy sector ($474 B).
4. Major projects
In May 2023, there were 493 major resource projects under construction or planned over the next 10 years in Canada, worth $572 billion in potential investment.
Source: Natural Resources Canada, Natural Resources: Major Projects Planned or Under Construction, 2023 to 2033
5. Revenues
Governments derived $14.8 billion annually on average from the natural resource sector from 2016 to 2020.
Sources: Natural Resources Canada estimates based on data from Statistics Canada (Table 33-10-0500-01), Canadian Association of Petroleum Producers, Mining Association of Canada, and Canadian Council of Forest Ministers
Note: Excludes indirect taxes

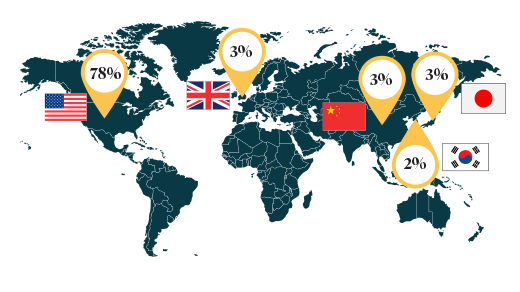
Text version
This world map shows the percentages of Canada’s total natural resource exports, valued at $422 billion, that went to its top five export countries. The countries are the United States (78%), the United Kingdom (3%), China (3%), Japan (3%), and South Korea (2%).
6. Exports
Canada’s natural resource exports were valued at $422 billion in 2022, comprising 58% of the value of Canada's total merchandise exports.
Source: Natural Resources Canada calculations, based on Statistics Canada data
Note: Figures on the map are percentages of Canada’s total natural resource exports by country (5 highest)
7. Canadian assets abroad
The total value of publicly traded Canadian extractive company assets was $619 billion in 2021.
Of those assets, $283 billion were located outside of Canada, in 108 countries.
Source: Natural Resources Canada estimates based on company filings

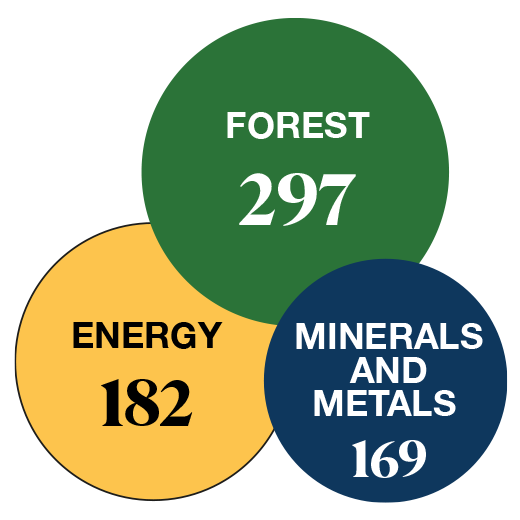
Text version
This figure shows the number of resource-reliant communities in Canada, including 297 in the forest sector, 182 in the energy sector, and 169 in the minerals and metals sector.
8. Resource-reliant communities
In 2021, 648 communities were economically reliant on at least one natural resource sector. Of those communities, 440 were either significantly or highly reliant on at least one of the natural resource sectors.
Source: Natural Resources Canada estimates, based on Statistics Canada data (2021 Census of Population)
Note: Sector totals are not additive because some communities are reliant on more than one resource sector
9. Energy intensity
Canada used 21% less energy per dollar of GDP in 2020 than in 2000.
Source: National Energy Use Database
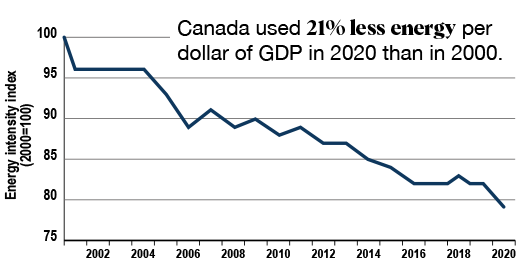
Text version
This line chart shows Canada’s energy intensity index per dollar of GDP from 2000 to 2020. The energy intensity index gradually decreased from 100 in 2000 to 79 in 2020.
10. Clean technology
In 2021, clean technologies, clean energy, and environmental goods and services accounted for $73.1 billion (2.9%) of Canada's nominal GDP and provided 314,000 jobs.
The GDP in this sector grew by 50% from 2011 to 2021.
Average annual compensation per job in the sector was $96,910 in 2021, 40% higher than the national average.
The value of exports from the sector grew by 91% from $9.3 billion in 2011 to $17.9 billion in 2021.
Source: Statistics Canada Environmental and Clean Technology Products Economic Account (Tables 36-10-0629-01, 36-10-0632-01, and 36-10-0627-01)
Notes
Totals may not add up because of rounding. Economic activity associated with coal and uranium mining are categorized with the minerals and metals sector.
In this iteration of 10 Key Facts on Canada’s Natural Resources, government revenues exclude indirect taxes. This figure is not directly comparable to previous iterations, which included indirect taxes.
The number of resource-reliant communities in 2021 has been revised since the previous iteration of this document based on the most recent Census of Population data and on Natural Resources Canada’s revised calculation methodology.