
Aluminum is a lightweight, durable, flexible, and non-corrosive metal that is infinitely recyclable, making it one of the most widely used and recycled metals in the world.
Key facts
- In 2024, Canadian smelters produced about 3.3 million tonnes of primary aluminum.
- Canada is the world’s fourth-largest primary aluminum producer, following China, India, and Russia.
- Canadian aluminum producers have the lowest carbon footprint among major producers, thanks largely to their reliance on hydroelectricity and cutting-edge technologies.
Learn more about aluminum
 Uses
Uses
The automotive and transportation industry uses a variety of aluminum alloys because of their light weight and exceptional durability. These properties contribute significantly to reducing the weight of vehicles, which in turn enhances fuel efficiency and lowers greenhouse gas emissions.
Aluminum is also widely used in
- construction, which relies on various aluminum products from exterior siding to structural components
- packaging, such as beverage cans and foils, which benefit from its infinite recyclability
- the electrical and electronics industries
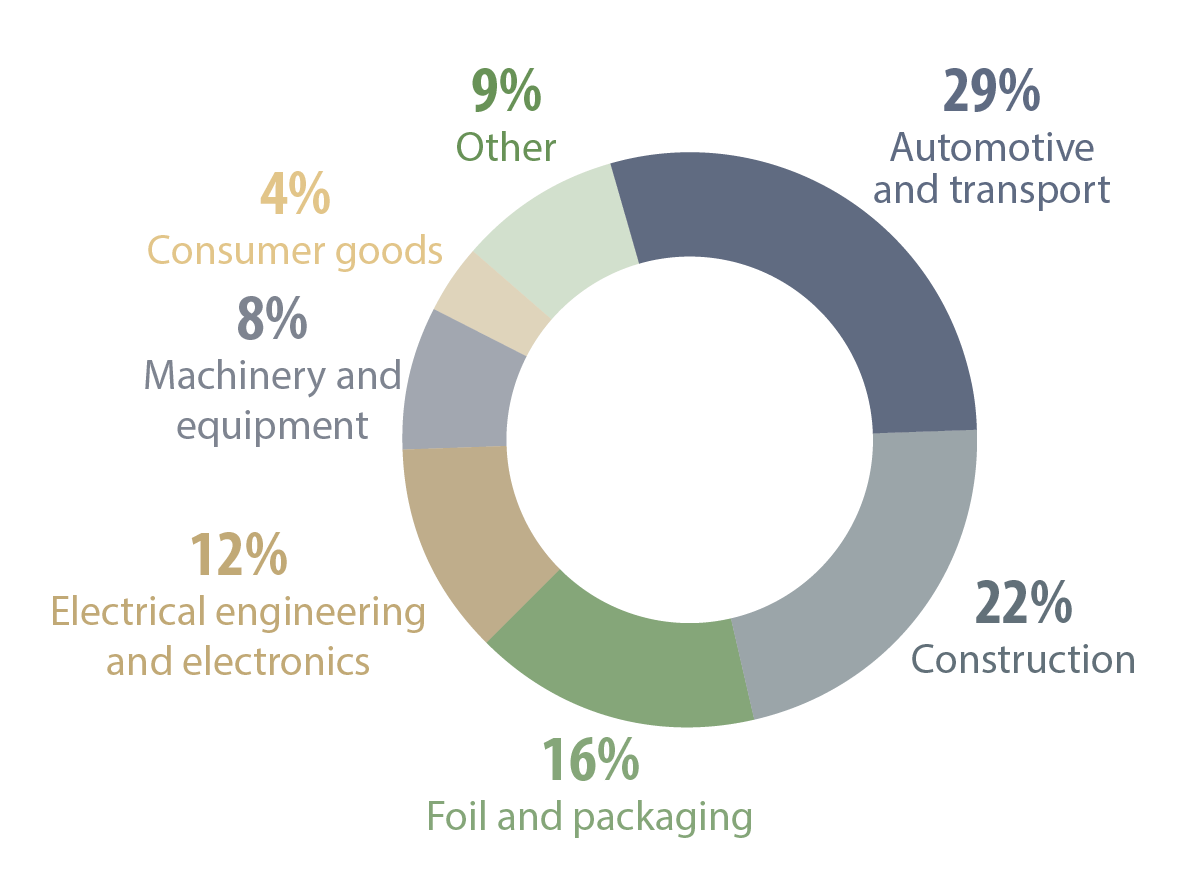
Aluminum, global uses, 2024 (p)
Text version
This pie chart illustrates the primary global applications of aluminum in 2024. The largest share was allocated to the automotive and transportation sectors, accounting for 29%. This was followed by construction at 22%, foil and packaging at 16%, electrical engineering and electronics at 12%, machinery and equipment at 8%, consumer goods at 4%, and other applications at 9%.
 Production
Aluminum is not found in its pure form in nature. It is extracted from bauxite ore, which is comprised of 40% to 60% hydrated aluminum oxide, mixed with silica and iron oxide. The production process refines mined bauxite ore to obtain alumina. About 4 to 5 tonnes of bauxite ore are required to produce 2 tonnes of alumina. In turn, it takes about 2 tonnes of alumina to yield 1 tonne of aluminum.
In Canada, there are 10 primary aluminum smelters, with one in Kitimat, British Columbia and the other nine in Quebec. An alumina refinery is also in operation in Jonquière, Quebec. It is important to note that Canada does not mine bauxite domestically, relying instead on imported bauxite to support its aluminum production.
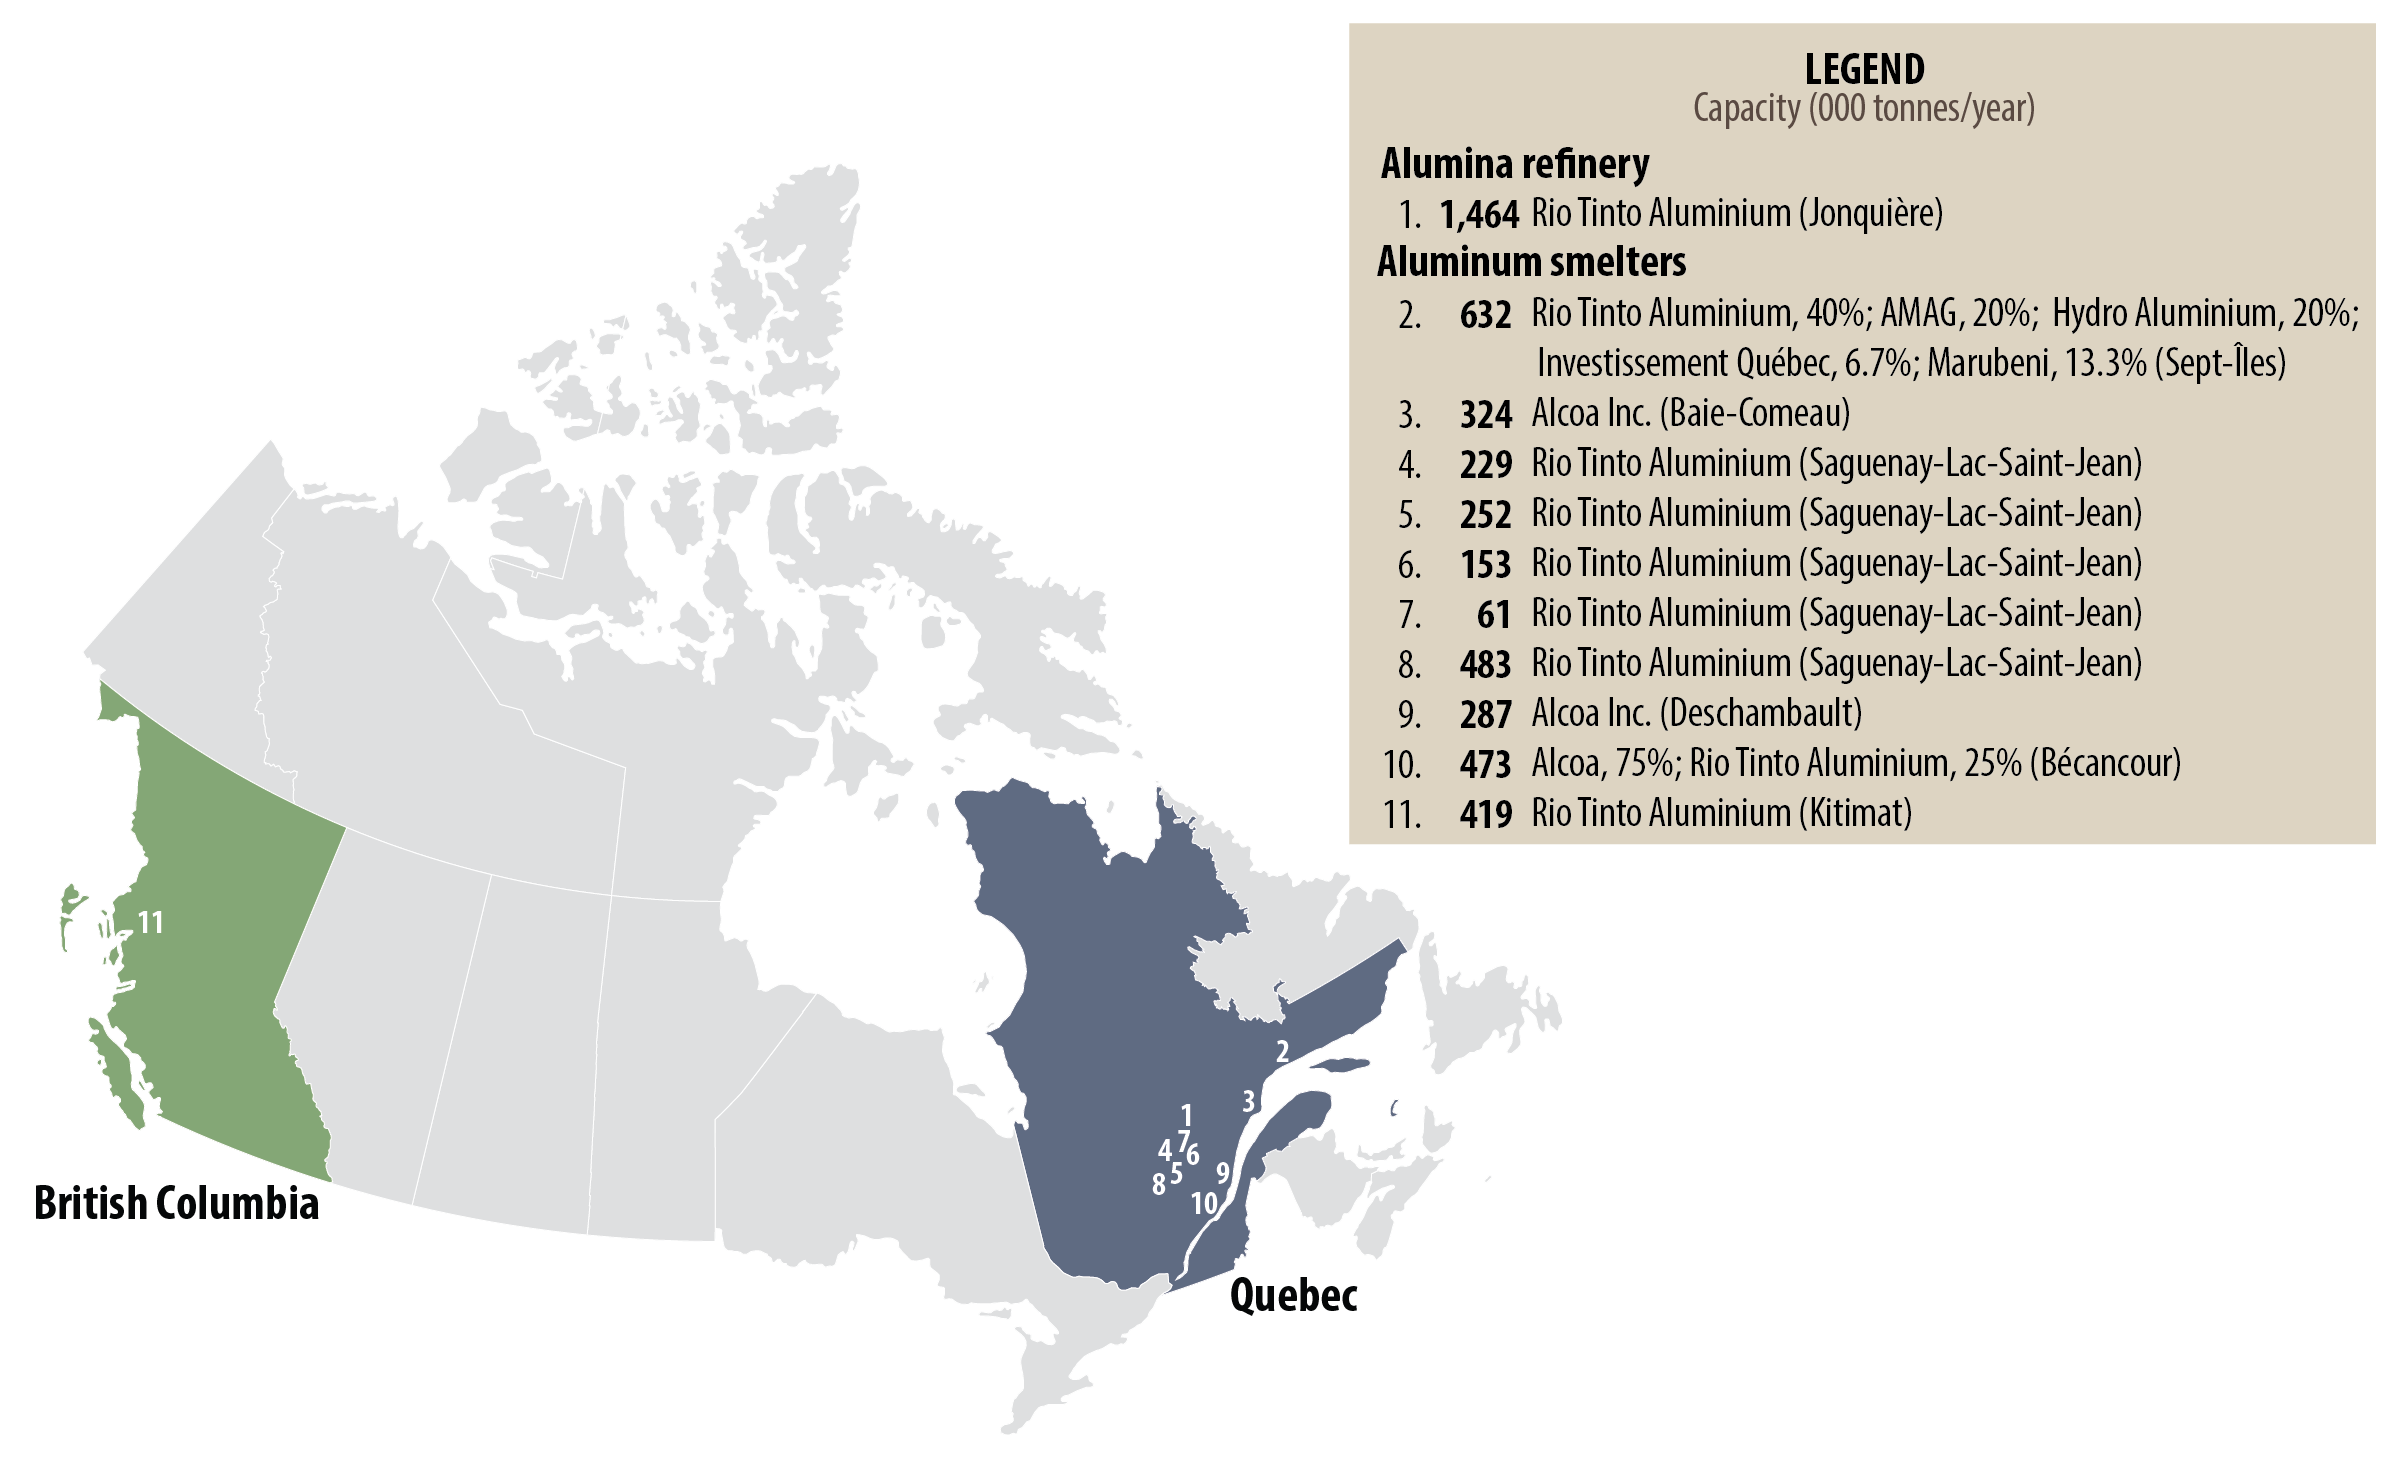
Canadian refinery and smelters estimated capacity and production, 2024
Text version
This map shows the locations of aluminum smelters and the sole alumina refinery in Canada. The alumina refinery is in Quebec, as are 9 of the 10 aluminum smelters. The last smelter is in Kitimat, British Columbia. The largest smelter is the Alouette facility in Sept-Îles, Quebec, which boasts an impressive production capacity of 632,000 tonnes per year. The legend accompanying the map provides details on ownership and annual production levels (in thousands of tonnes) for each facility.
In 2024, Canada’s primary aluminum production is estimated at 3.3 million tonnes, an increase of 1% from 2023. Canadian aluminum producers have the lowest carbon footprint among the world’s major producers because they use mostly hydroelectricity and cutting-edge technologies.
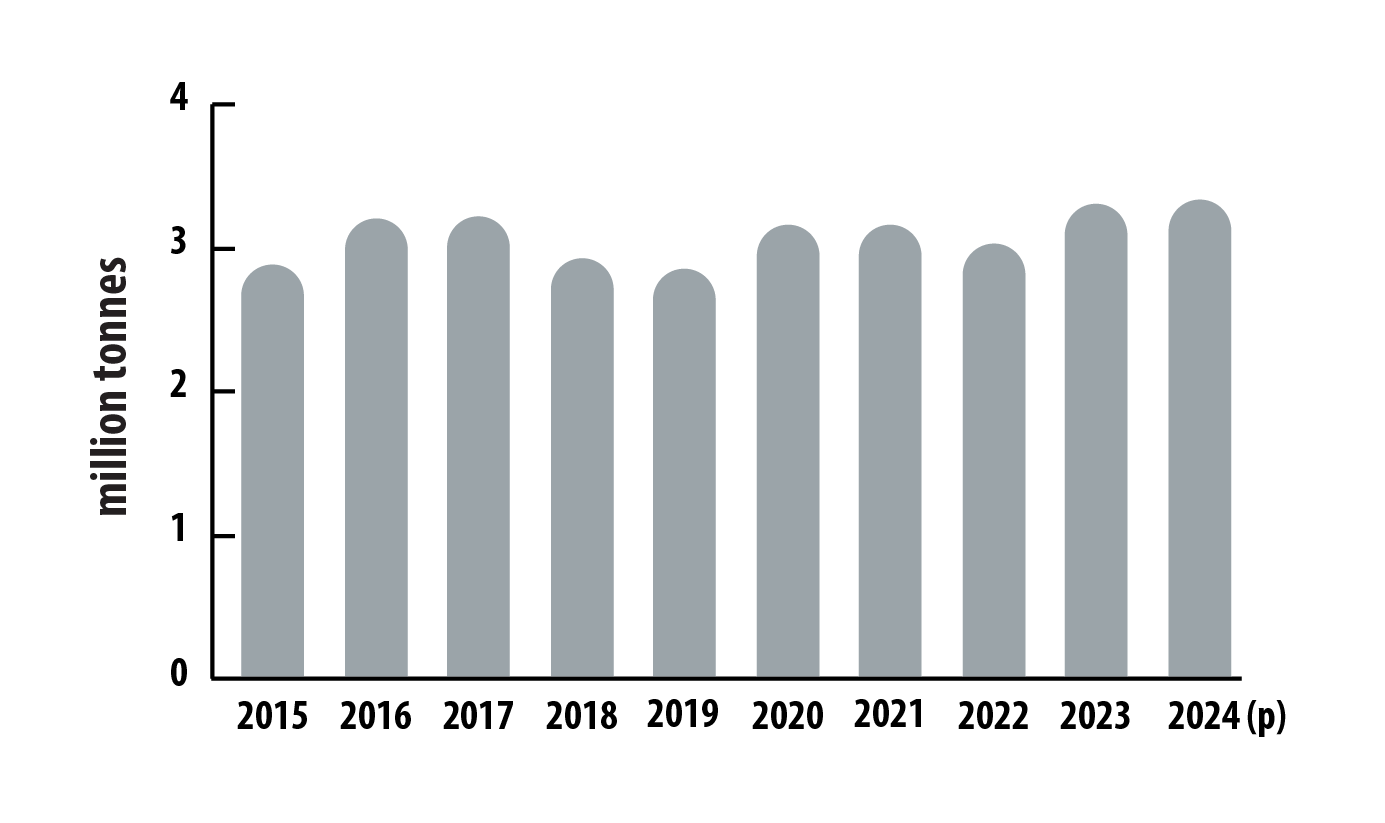
Canadian production of primary aluminum, 2015–2024 (p)
Text version
This bar graph shows Canada’s annual primary aluminum production from 2015 to 2024. Production was about 2.9 million tonnes in 2015 and rose to a peak of 3.2 million tonnes in 2017 before declining to 2.9 million tonnes in 2019. It rebounded to 3.2 million tonnes in 2020 and 2021, decreased to 3.0 million tonnes in 2022, and climbed to a decade high of 3.3 million tonnes in 2024.
 International context
Global primary aluminum production is estimated at 72 million tonnes for 2024. China led the world in production with 43 million tonnes, followed by India, Russia, and Canada.
Find out more about the leading global producers:
Bauxite ore, by country
| Ranking | Country | Thousand tonnes | Percentage of total |
|---|---|---|---|
| 1 | Guinea | 130,000 | 28.9% |
| 2 | Australia | 100,000 | 22.2% |
| 3 | China | 93,000 | 20.6% |
| 4 | Brazil | 33,000 | 7.3% |
| 5 | Indonesia | 32,000 | 7.1% |
| 6 | India | 25,000 | 5.6% |
| 7 | Russia | 6,300 | 1.4% |
| 8 | Jamaica | 6,100 | 1.4% |
| 9 | Saudi Arabia | 5,800 | 1.3% |
| 10 | Kazakhstan | 4,900 | 1.1% |
| – | Other countries | 14,300 | 3.2% |
| Total (rounded) | 450,000 | 100.0% | |
Alumina, by country
| Ranking | Country | Thousand tonnes | Percentage of total |
|---|---|---|---|
| 1 | China | 84,000 | 59.2% |
| 2 | Australia | 18,000 | 12.7% |
| 3 | Brazil | 11,000 | 7.7% |
| 4 | India | 7,600 | 5.4% |
| 5 | Russia | 2,900 | 2.0% |
| 6 | United Arab Emirates | 2,400 | 1.7% |
| 7 | Saudi Arabia | 1,800 | 1.3% |
| 8 | Ireland | 1,600 | 1.1% |
| 9 | Canada | 1,500 | 1.1% |
| 10 | Jamaica | 1,500 | 1.1% |
| – | Other countries | 9,680 | 6.8% |
| Total (rounded) | 142,000 | 100.0% | |
Primary aluminum, by country
| Ranking | Country | Thousand tonnes | Percentage of total |
|---|---|---|---|
| 1 | China | 43,000 | 60.0% |
| 2 | India | 4,200 | 5.9% |
| 3 | Russia | 3,800 | 5.3% |
| 4 | Canada | 3,300 | 4.6% |
| 5 | United Arab Emirates | 2,700 | 3.8% |
| 6 | Bahrain | 1,600 | 2.2% |
| 7 | Australia | 1,500 | 2.1% |
| 8 | Norway | 1,300 | 1.8% |
| 9 | Brazil | 1,100 | 1.5% |
| 10 | Malaysia | 870 | 1.2% |
| – | Other countries | 8,250 | 11.5% |
| Total (rounded) | 72,000 | 100.0% | |
World production of primary aluminum, 2015–2024 (p)

Text version
This bar graph shows global primary aluminum production, in millions of tonnes, from 2015 to 2024. Production rose steadily from 53.9 million tonnes in 2015 to a peak of 72 million tonnes in 2024.
World reserves
Global bauxite ore reserves amounted to 29 billion tonnes in 2024.
World reserves of bauxite ore, by country, 2024 (p)
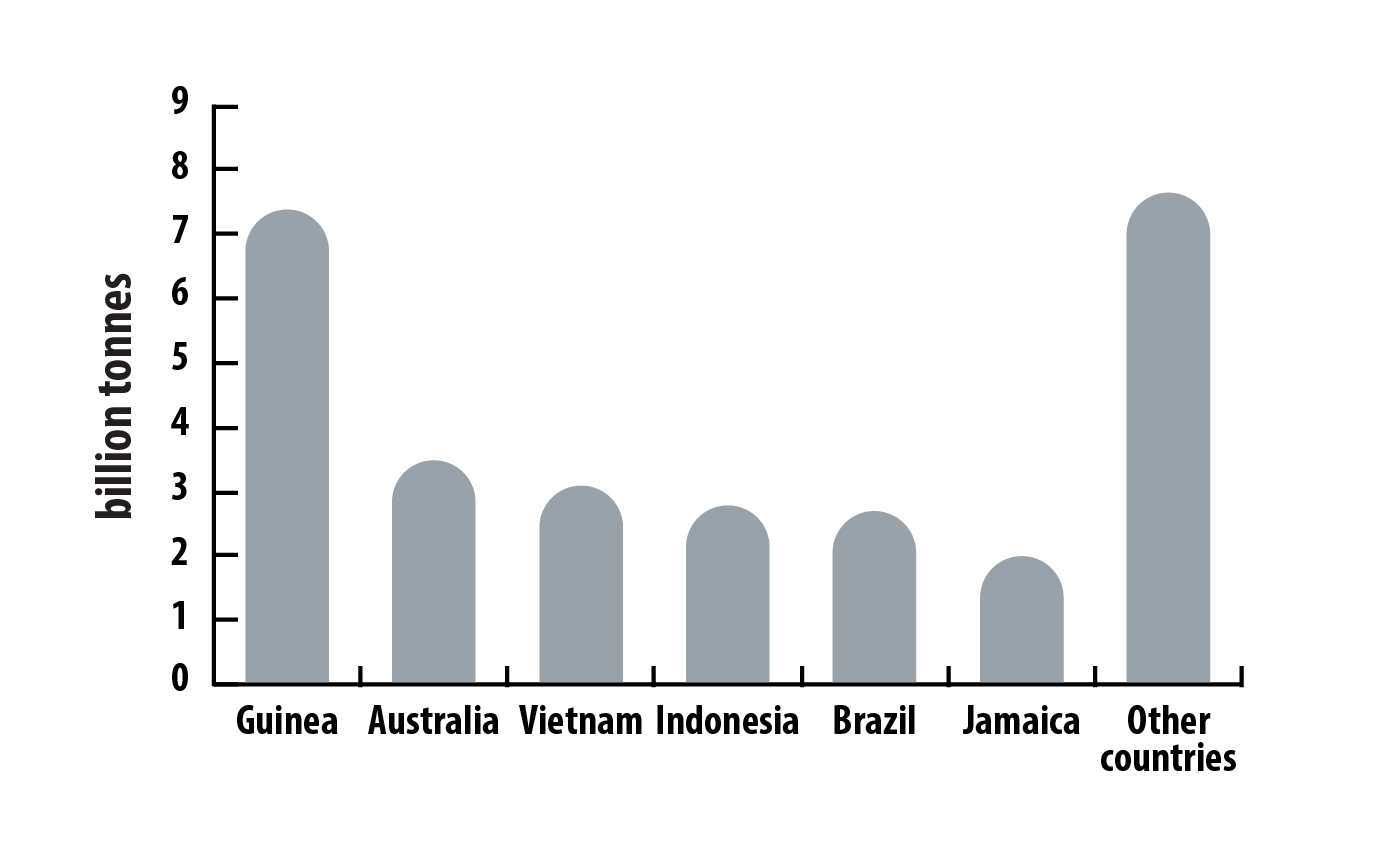
Text version
This bar graph illustrates global reserves of bauxite ore by country in billions of tonnes for 2024. Guinea held the largest reserves, with 7.4 billion tonnes, followed by Australia (3.5 billion tonnes), Vietnam (3.1 billion tonnes), Indonesia (2.8 billion tonnes), Brazil (2.7 billion tonnes), and Jamaica (2.0 billion tonnes), while all other countries combined held 7.7 billion tonnes.
Demand
Global demand for primary aluminum reached an estimated 71.4 million tonnes in 2024, a 2.1% increase from 2023. World aluminum demand generally grew between 2015 and 2024, largely supported by increased demand in China and in key sectors such as construction and transportation.
China accounted for the largest share of global aluminum consumption by region in 2024, followed by Europe, Asia (excluding China), North America, and the Middle East.
Primary aluminum demand, by region, 2024
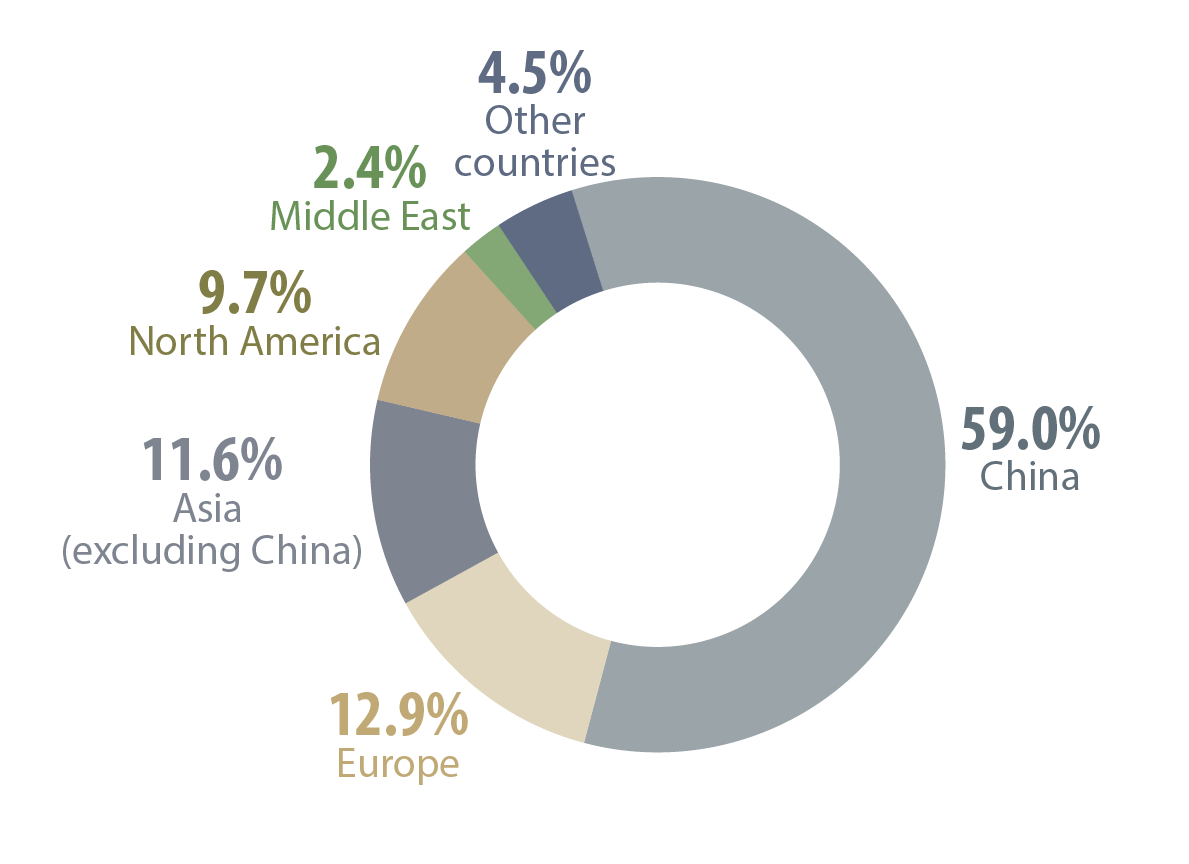
Text version
This pie chart illustrates the estimated regional demand for primary aluminum in 2024. China accounted for the largest share at 59.0%, followed by Europe (12.9%), Asia excluding China (11.6%), North America (9.7%), the Middle East (2.4%), and other regions (4.5%).
 Trade
Trade
Exports
In 2024, Canadian exports of aluminum products were valued at $17.4 billion, up 3% from the previous year, driven by higher market prices.
Exports included:
- $11.3 billion in unwrought alloyed and non-alloyed aluminum
- $2.5 billion in semi-finished aluminum products
- $1.7 billion in finished aluminum products
- $1.7 billion in aluminum waste and scrap
The United States was Canada’s largest export destination for aluminum products in 2024, accounting for 91% of the total value of aluminum exports, followed by Mexico (2%) and the Netherlands (1%).
Imports
In 2024, Canada’s imports of aluminum products were valued at $10.7 billion, a 12.6% increase from the previous year. Imports of bauxite concentrate and alumina for aluminum production accounted for $3.0 billion or 28% of Canada’s aluminum imports in 2024.
Most imports came from the United States (39%), Brazil (22%), China (17%), Australia (7%), and Germany (1%).
 Prices
Aluminum prices rose on average in 2024. The average monthly price rose from US$2,193 per tonne in January to a peak of US$2,596 in October, before easing slightly to US$2,541 in December. The overall average monthly price for 2024 was US$2,419, up from US$2,256 in 2023.
Aluminum prices, monthly average, 2015–2024
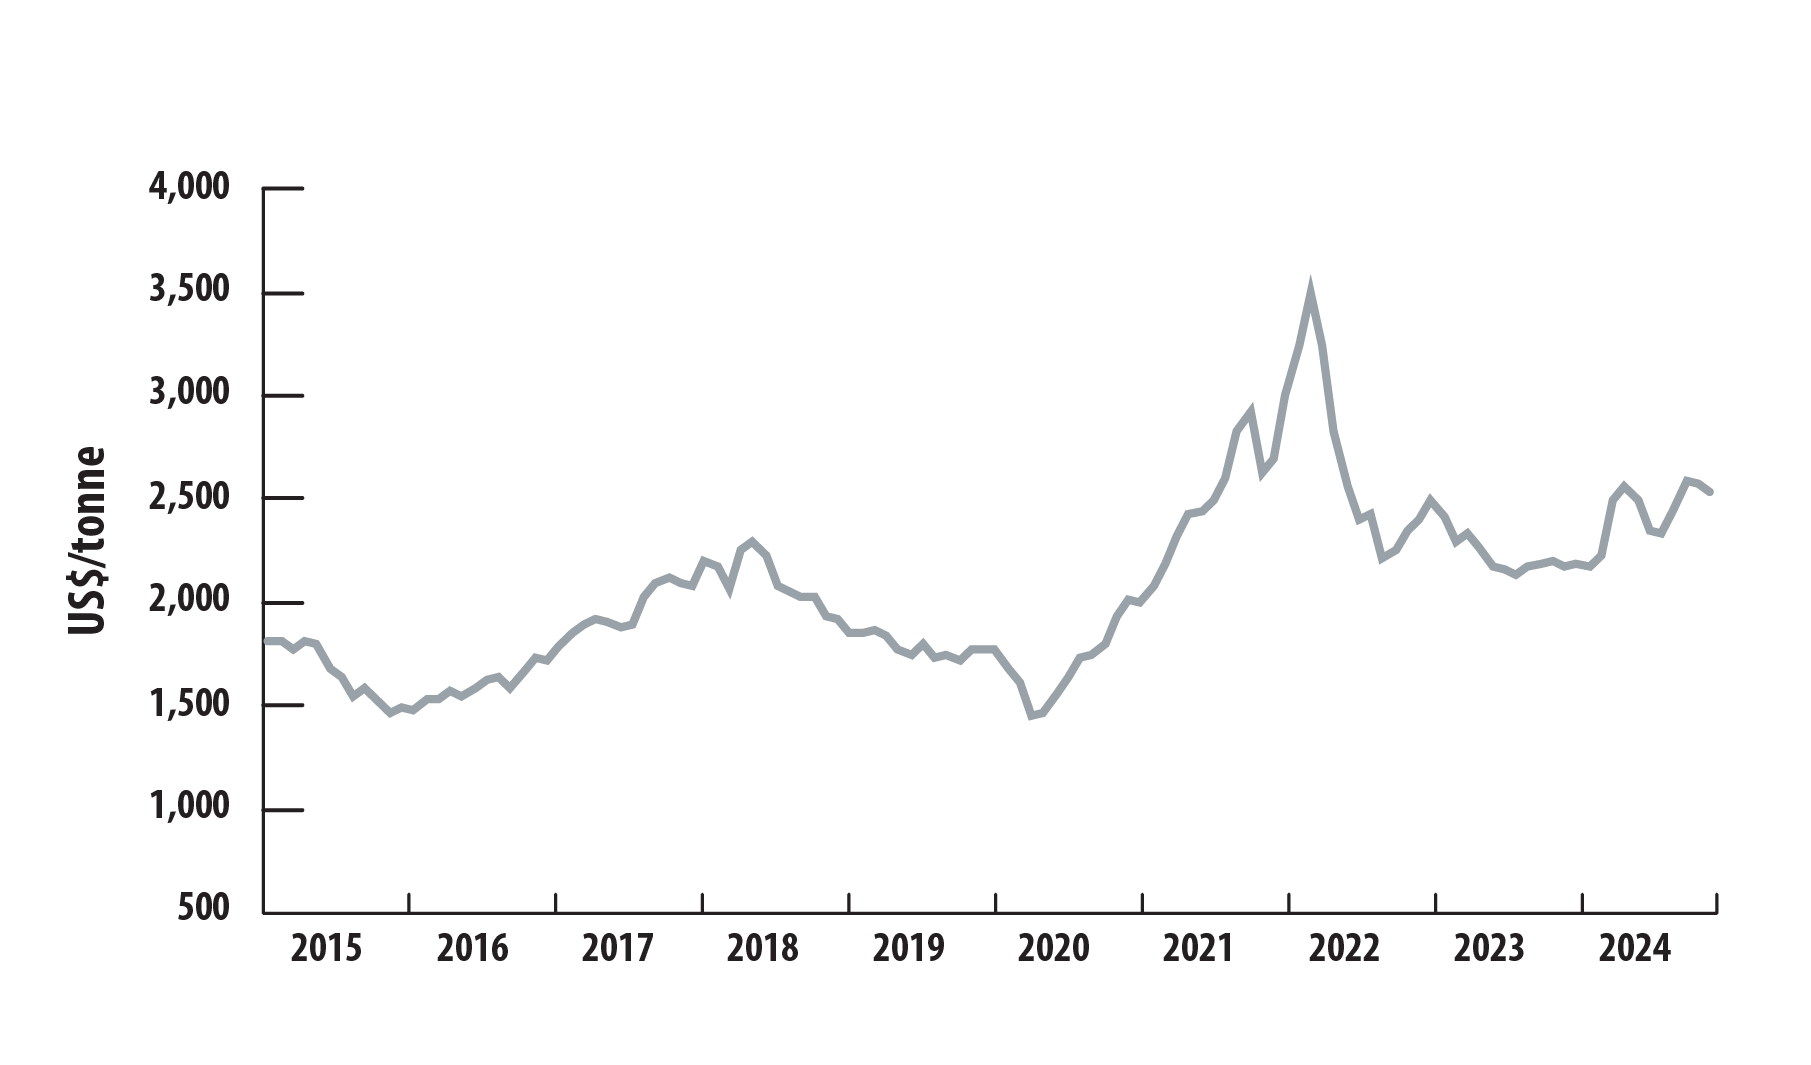
Text version
This line graph shows the monthly average price of aluminum in Unites States dollars per tonne from 2015 to 2024. Between January and November 2015, the price decreased from US$1,815 to US$1,468 per tonne. Prices then rose to US$2,300 by May 2018 before falling to a decade low of US$1,460 in April 2020. They rebounded to a decade high of US$3,498 in March 2022, before declining to US$2,541 by December 2024.
 Recycling
Aluminum use in transportation is rising because of its unique properties of strength and light weight. Its recyclability contributes to reducing greenhouse gas emissions.
Aluminum is infinitely recyclable, making it one of the most recycled metals in the world. More than 90% of the aluminum used in automotive and construction applications is recycled, driving a closed-loop, circular economy.
Secondary aluminum production requires 95% less energy than primary aluminum production, thereby reducing carbon emissions and costs to businesses and consumers.
Notes and sources
(p) preliminary
Totals may be different because of rounding.
Uses
- Aluminum, global uses, 2024 (p)
- Wood Mackenzie
Production
- Canadian refinery and smelters estimated capacity and production, 2024
- Natural Resources Canada; Statistics Canada
- Company annual reports
- Canadian production of primary aluminum, 2015–2024 (p)
- Statistics Canada
International context
- World production of bauxite ore, by country, 2024 (p)
- U.S. Geological Survey
- World production of alumina, by country, 2024 (p)
- U.S. Geological Survey
- World production of primary aluminum, by country, 2024 (p)
- U.S. Geological Survey
- World production of primary aluminum, 2015–2024 (p)
- U.S. Geological Survey
- World reserves of bauxite ore, by country, 2024 (p)
- U.S. Geological Survey
- Primary aluminum demand, by region, 2024
- Wood Mackenzie
Trade
- Natural Resources Canada; Statistics Canada
- Mineral trade includes ores, concentrates, smelting and refining products, and semi-fabricated and fabricated mineral products.
Prices
- Aluminum prices, monthly average, 2015–2024
- The World Bank
Recycling
- Aluminum Association of Canada