

Copper is a soft, malleable metal valued for its excellent electrical and thermal conductivity, durability, and resistance to corrosion. It is widely used in wiring, plumbing, construction, industrial machinery, and clean technologies such as electric vehicles and solar power. Copper is also a key ingredient in alloys such as brass and bronze and can be recycled indefinitely without losing quality, making it vital for a sustainable, low-carbon economy.
Key facts
- In 2024, Canadian mines produced 514,582 tonnes of copper in concentrate, with nearly half originating from British Columbia.
- Canada’s exports of copper and copper-based products were valued at $10.7 billion in 2024.
- Chile led global copper production, contributing 23% of the total mined output.
- The green energy transition is expected to significantly increase copper demand, driven by its essential role in electricity networks and clean energy technologies, including electric vehicles.
Learn more about copper
 Uses
Uses
Copper plays a crucial role across various industries, including energy, manufacturing, construction, and transportation. The green energy transition is anticipated to significantly increase copper demand because of its critical applications in expanding electricity networks and clean energy technologies, such as electric vehicles. As an essential trace mineral, copper is also vital for all living organisms, with the adult human containing between 1.4 and 2.1 milligrams per kilogram of body weight.
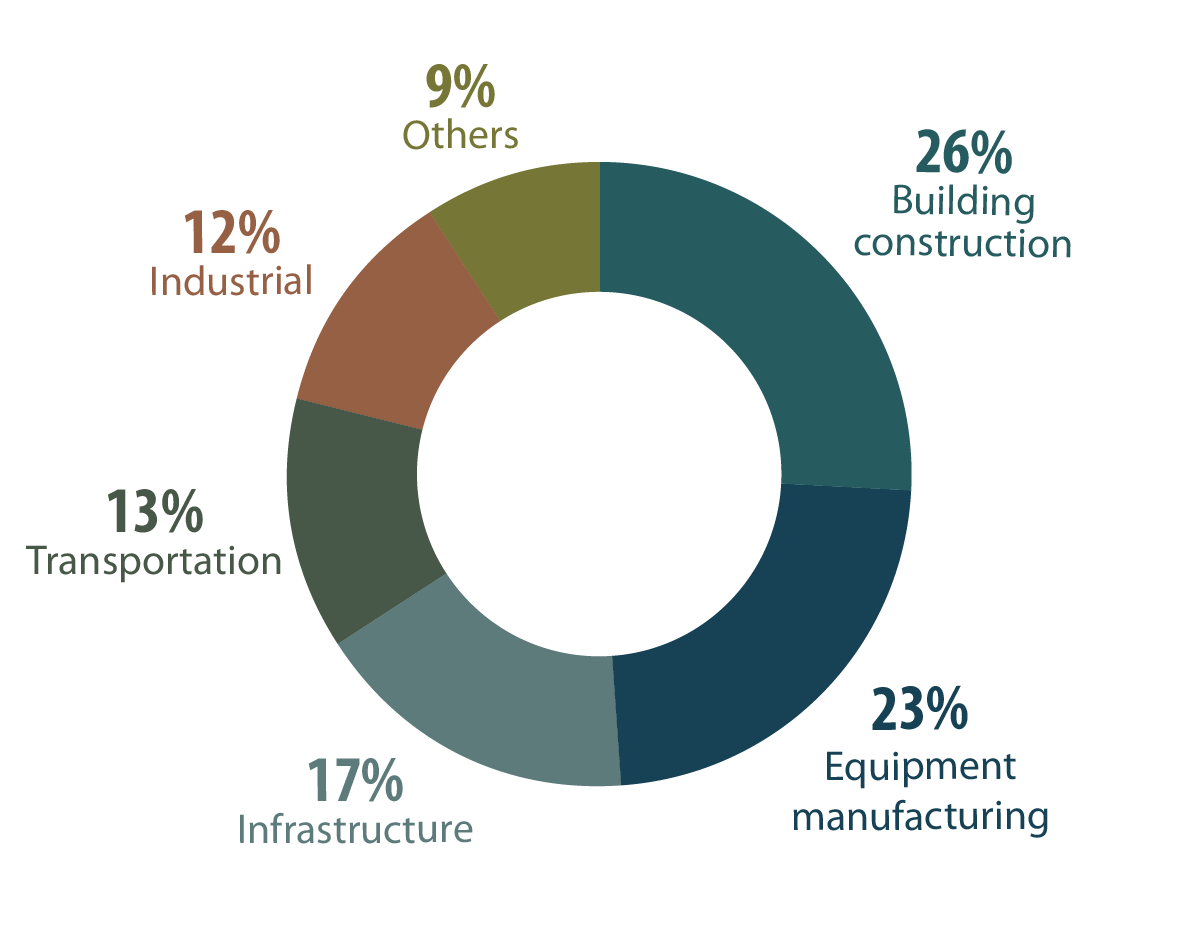
Copper, global uses, 2024
Text version
This pie chart illustrates the primary global uses of copper in 2024. The largest use was for building construction (26%), followed by consumer and general products, cooling, and electronic (23%), infrastructure (power and telecom) (17%), transportation (13%), industrial equipment (12%), and others (9%).
 Production
Copper can be mined as a primary product or extracted as a by-product of other metals such as gold, molybdenum, zinc, nickel, and lead.
In 2024, Canadian mines produced 514,582 tonnes of copper in concentrate, marking an increase of 6.2% from the 484,552 tonnes produced in 2023. From 2015 to 2024, copper production in Canada declined 26.2%, falling from 697,322 tonnes to 514,582 tonnes.
Canada has one primary copper smelter and refinery in Quebec and two sites in Ontario and Newfoundland and Labrador that produce limited amounts of refined copper with the processing of other metals.
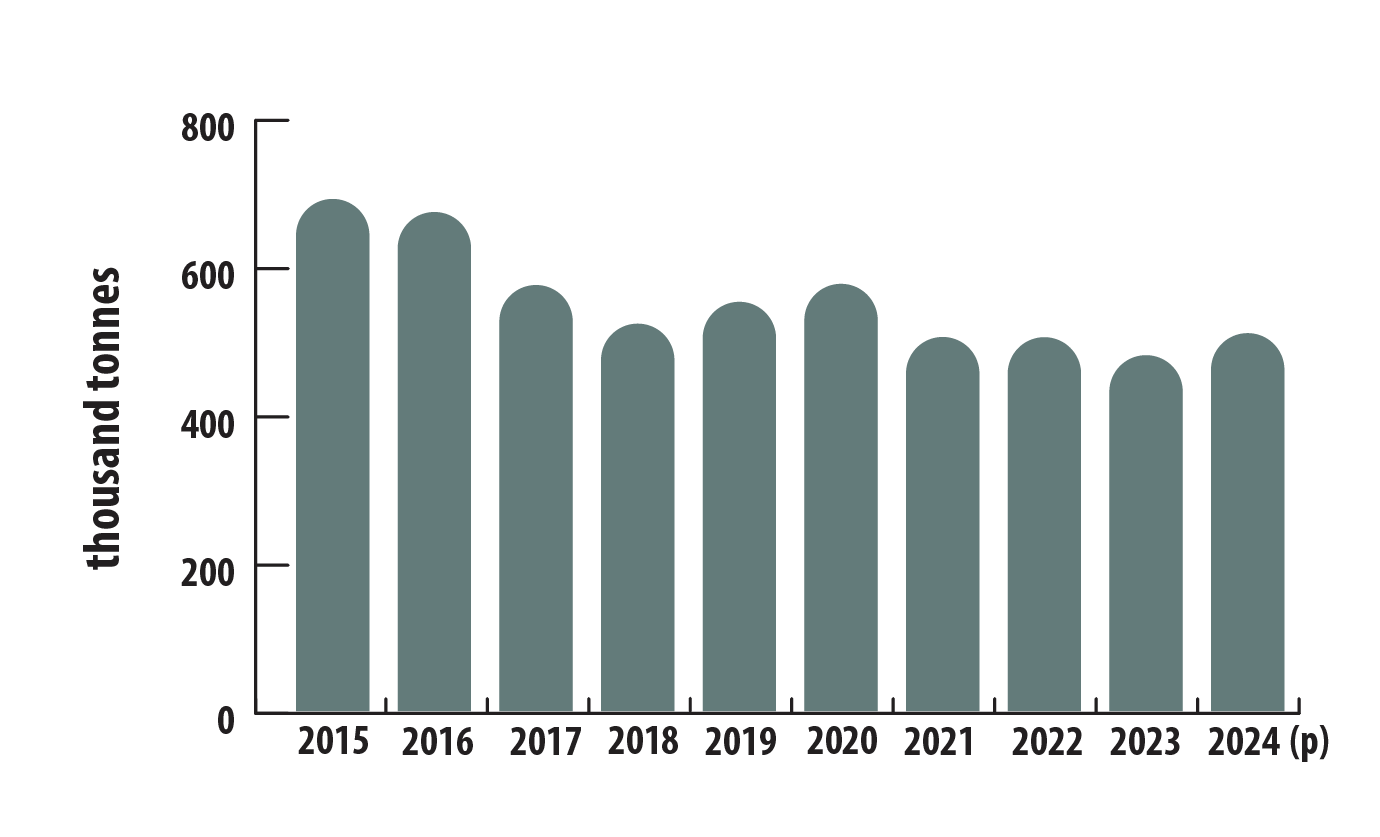
Canadian mine production of copper, 2015–2024 (p)
Text version
This bar graph illustrates Canada's annual mine production of copper from 2015 to 2024 (p). Production reached a 10-year peak of 697,322 tonnes in 2015 before gradually declining to 527,510 tonnes by 2018. It then climbed to 581,713 tonnes in 2020, but declined to 509,062 tonnes in 2022, with a further decrease to 484,552 tonnes in 2023. Production then increased to 514,582 tonnes in 2024.
British Columbia led Canada’s copper production, accounting for about 48% of the nation’s total output. The province is home to Canada’s largest copper mine, Highland Valley, near Logan Lake.
Consult a map of producing Canadian mines and processing sites
| Ranking | Province | Thousand tonnes | Percentage |
|---|---|---|---|
| 1 | British Columbia | 249 | 48.3 |
| 2 | Quebec | 23 | 4.5 |
| 3 | Newfoundland and Labrador | 13 | 2.5 |
| – | Others | 230 | 44.7 |
| Total | 515 | 100 | |
 International context
In 2024, Chile led global copper production with 5.3 million tonnes of copper, representing 23% of the world’s total mined output of about 23 million tonnes. Canada ranked 12th, contributing 2% of global mined copper.
Global refined copper production increased by 3.8% in 2024, reaching 27.5 million tonnes, up from 26.5 million tonnes in 2023. This total included 22.8 million tonnes from primary sources and 4.7 million tonnes from secondary sources, compared to 22 million tonnes and 4.5 million tonnes, respectively, the previous year.
| Ranking | Country | Thousand tonnes | Percentage |
|---|---|---|---|
| 1 | Chile | 5,300 | 23 |
| 2 | Democratic Republic of Congo (DRC) | 3,300 | 14 |
| 3 | Peru | 2,600 | 11 |
| 4 | China | 1,800 | 8 |
| 5 | United States | 1,100 | 5 |
| 6 | Indonesia | 1,100 | 5 |
| 7 | Russia | 930 | 4 |
| 8 | Australia | 800 | 3 |
| 9 | Kazakhstan | 740 | 3 |
| 10 | Mexico | 700 | 3 |
| – | Other countries | 4,270 | 19 |
| Total (rounded) | 23,000 | 100 | |
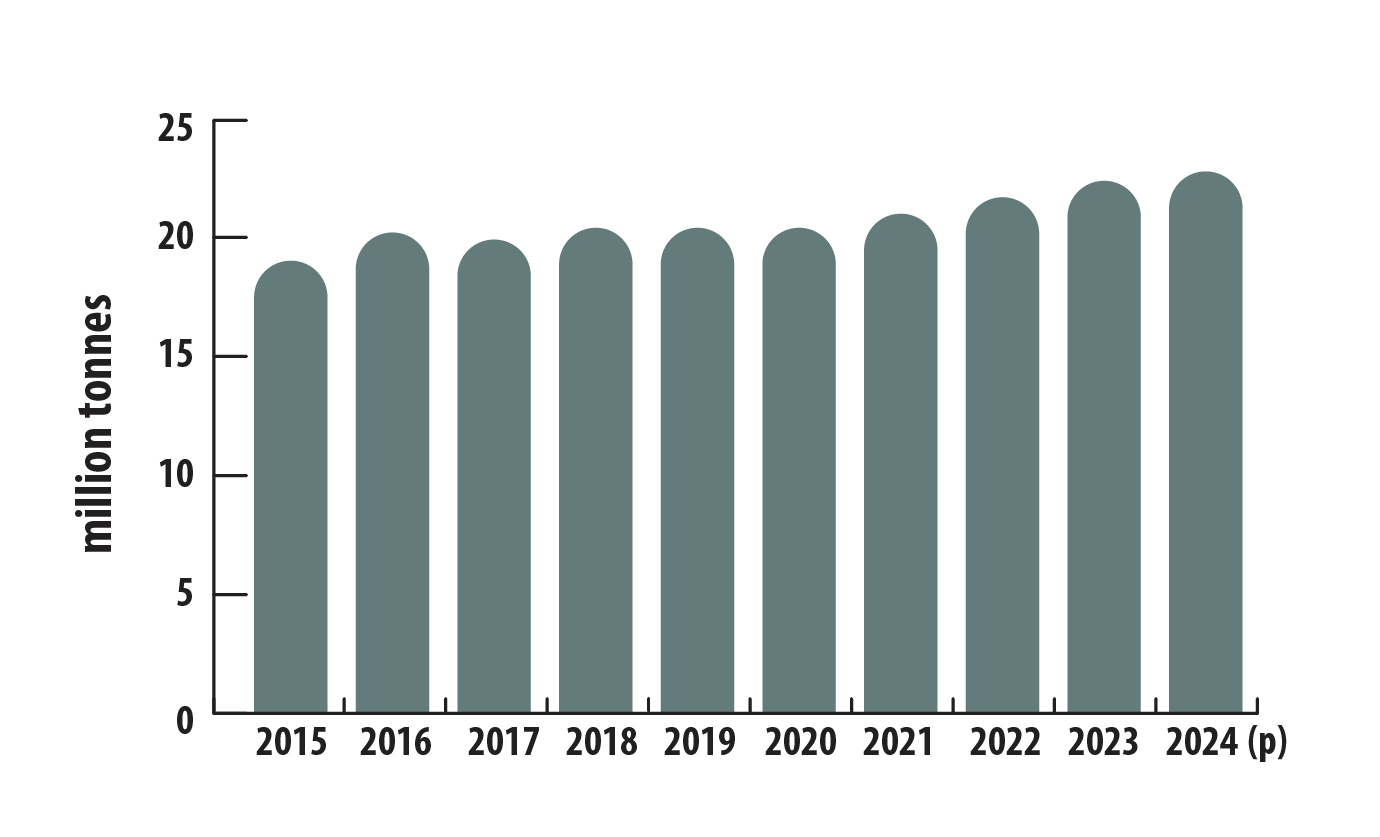
World mine production of copper, 2015–2024 (p)
Text version
This bar graph illustrates global production of mined copper from 2015 to 2024. Production was 19.2 million tonnes in 2014 and increased gradually to a peak of 23.0 million tonnes by 2024.
World refined production of copper, 2015–2024 (p)

Text version
This bar graph illustrates the global production of refined copper from 2015 to 2024, including both primary and secondary sources. In 2015, refined copper production totaled 22.8 million tonnes, comprising 18.9 million tonnes from primary sources and 3.9 million tonnes from secondary sources. Over the decade, production increased steadily, reaching 27.5 million tonnes in 2024, with 22.8 million tonnes from primary sources and 4.7 million tonnes from secondary sources.
World reserves
In 2024, Chile held the largest share of global copper reserves, totaling 190 million tonnes or 19% of the total reserves. With worldwide reserves estimated at 1 billion tonnes, Canada holds about 8.3 million tonnes, making up about 1% of the global total.
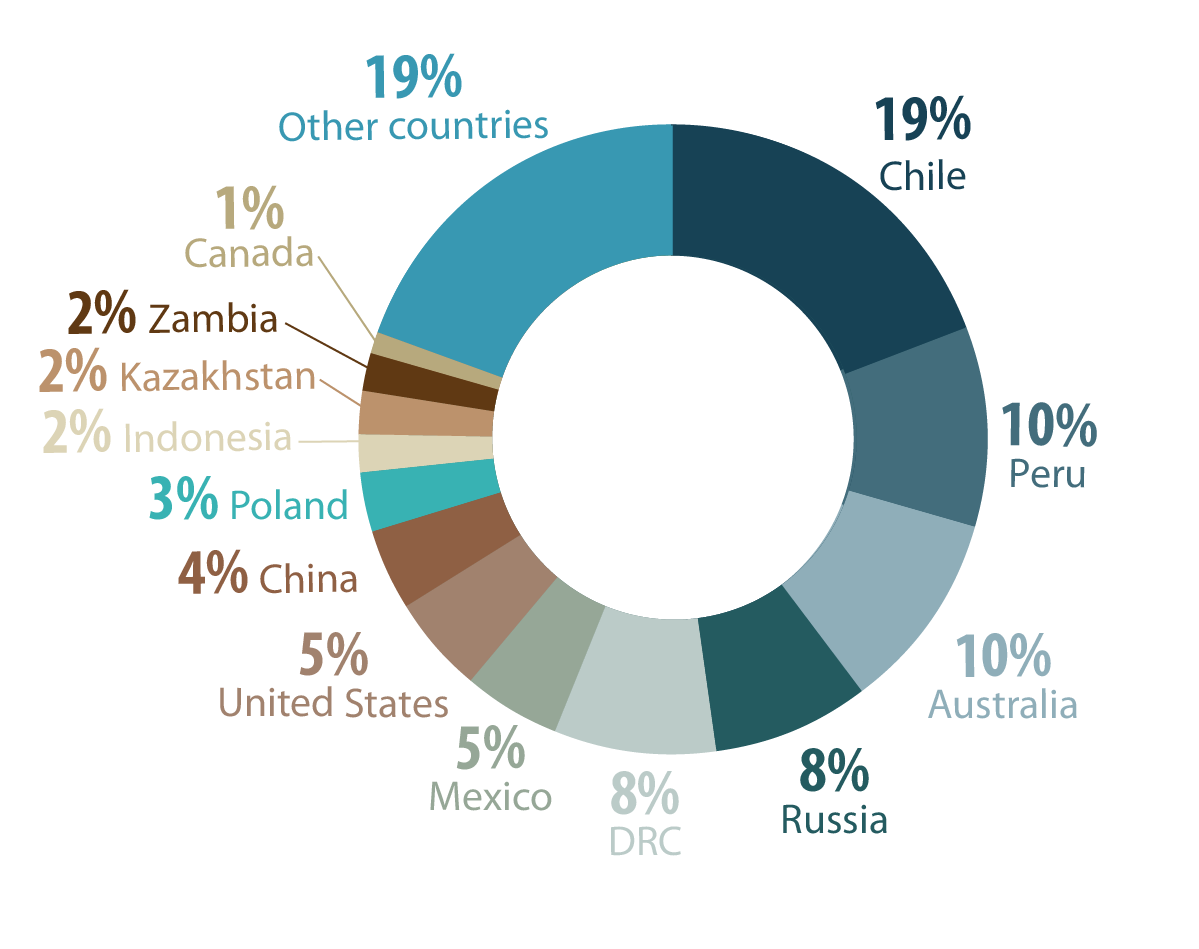
World reserves of copper, by country, 2024 (p)
Text version
This circular chart illustrates the distribution of global copper reserves by country in 2024. Chile leads with 19% of the world’s reserves, followed by Peru and Australia with 10%, and Russia and Congo each hold 8%. Mexico and the United States each account for 5%, while China holds 4%. Poland has 3% and Indonesia, Kazakhstan, and Zambia each have 2% of the global reserves. Canada holds 1% of the world’s known copper reserves. All other countries collectively accounted for the remaining 19%.
 Trade
Trade
In 2024, Canada's total trade (exports and imports) in copper and copper-based products was valued at $17.3 billion.
Exports
In 2024, Canada's domestic exports of copper and copper-based products were valued at $10.7 billion, a 15% increase from the previous year. The United States was the main destination, accounting for 56% of the total export value, followed by China (19%), Japan (9%), and South Korea (7%).
Canada exported 348,211 tonnes of copper ores and concentrates in 2024, a 4% increase from 2023. These exports were valued at $4.0 billion, up 17% from the previous year. China and Japan were the primary destinations of Canadian copper concentrate.
Refined copper exports totaled 140,639 tonnes in 2024, up 6% from 2023. These exports were valued at $1.8 billion, up 17% from the previous year. The United States was the primary destination, accounting for over 99% of Canada’s refined copper exports.
Imports
Canada’s imports of copper and copper-based products amounted to $6.5 billion in 2024, up 12% from 2023. Primary copper products, including ores, concentrates, waste, and scrap made up 24% of these imports. Copper alloys, mattes, powders, flakes, refined copper, and unrefined copper (copper anodes for electrolytic refining) made up 36%. The remaining 40% of imports were comprised of semi-fabricated and fabricated copper products.
The United States was the main source, accounting for 56% of the total. Other significant sources included Chile (15%) and Sweden (7%).
 Prices
The price of copper is generally considered to be a barometer of global economic conditions because the metal’s key uses are in construction, manufacturing and clean technologies. Consequently, demand for copper tends to rise during periods of growth and decline during slowdowns.
Copper prices have fluctuated significantly over the past decade. In 2015, the average monthly price per tonne was US$5,511, then declined in 2016 to a decade low of US$4,472, and peaked at US$10,231 in March 2022.
Prices dipped in early 2020 because of the onset of the COVID-19 pandemic but quickly rebounded later that year, reaching US$10,162 by May 2021. In 2024, the average price remained relatively high at US$9,142, with minimal fluctuations. The monthly price in January was US$8,339, rising to US$10,139 in May and dipping slightly to US$8,916 by December.
Copper price, monthly average, nominal United States dollars per tonne, 2015–2024

Text version
This line graph depicts the monthly average nominal price of copper (in United States dollars per tonne) from 2015 to 2024. In January 2015, the price was $5,830 and steadily declined to a low of $4,868 in 2016. Prices rebounded to $6,530 in 2018, dropped to $6,010 in 2019, and then increased to $6,174 in 2020. A rapid surge followed, reaching $10,162 by May 2021. Prices then dropped to $8,822 in 2022. In 2024, monthly average prices fluctuated between $8,305 and $10,139, finishing the year at $8,916 in December.
 Recycling
Copper is one of the few materials that retains its chemical and physical properties through repeated recycling, making it an ideal candidate for resource conservation and waste reduction.
According to the International Copper Study Group, 32% of global copper consumption in 2023 came from recycled sources.
Canada plays a key role in copper recycling, with significant quantities of the metal recovered through its well established industry. A substantial portion of this recycling occurs at smelting and refining facilities in Rouyn-Noranda and Montréal, Quebec.
Notes and sources
(p) preliminary
Totals may be different because of rounding.
All dollars are Canadian unless otherwise indicated.
Uses
- Copper, global uses, 2024
- International Copper Study Group
Production
- Canadian mine production of copper, 2015–2024 (p)
- Natural Resources Canada
- Canadian mine production of copper, by province and territory, 2024 (p)
- Natural Resources Canada
International context
- World mine production of copper, by country, 2024 (p)
- U.S. Geological Survey, Mineral Commodity Summaries, January 2025
- World mine production of copper, 2015–2024 (p)
- International Copper Study Group
- U.S. Geological Survey, Mineral Commodity Summaries, January 2024
- World refined production of copper, 2015–2024 (p)
- International Copper Study Group
- World reserves of copper, by country, 2024 (p)
- U.S. Geological Survey, Mineral Commodity Summaries, January 2024
Trade
- Statistics Canada
- Mineral trade includes ores, concentrates, and semi- and final-fabricated mineral products HS chapter 74 – copper and articles thereof.
- Copper in copper ores and concentrates consist of HS code 2603.00.10.
- Refined copper consists of HS subchapter 7403.
Prices
- Copper price, monthly average, nominal United States dollars per tonne, 2015–2024
- World Bank Commodity Price Data (The Pink Sheet)
Recycling
- Copper, recycling, 2024
- International Copper Study Group