

On this page
- Theme introduction
- Indicator: Forest sector employment
- Indicator: Forest sector average earnings
- Indicator: Forest communities
- Sources and information
Theme introductionFootnote 1
Forests play an important role in sustaining life by serving as essential habitats for biodiversity, sequestering carbon and providing ecological services. They hold significant social, cultural, and recreational value by offering resources such as food, medicine, and spiritual solace while sequestering greenhouse gas emissions and providing the inputs that support jobs in key sectors in Canada’s economy, such as forestry, housing construction and bioenergy and bioproducts.
All these benefits are part of the bioeconomy. The bioeconomy supplies sustainable biomass for use in products and services that provide good jobs, enhance human well-being, sustain ecosystems, and help meet global environmental commitments.
Forests are a key contributor to life
Canadians environmentally benefit from forests given the rich ecosystems they support. Home to abundant and diverse life forms such as animals, plants and microbes, forest ecosystems preserve soils, support biodiversity and cycle nutrients. Trees, forest soils, and forest plants also act as a natural cleanser by filtering pollutants from water and air.
Furthermore, forests directly benefit the lives of Canadians by playing a critical role in mitigating climate change and serving as a valuable tool for climate adaptation. Over the past forty years, forests have absorbed approximately one quarter of the carbon resulting from human activities such as burning fossil fuels and land use changes. Carbon uptake by forests reduces the rate at which carbon accumulates in the atmosphere and thus reduces the rate at which climate change occurs. Forests and trees may also act as natural infrastructure to mitigate flood damage, protect against erosion and landslides, and provide Canadians with shade, wind protection and cooler air temperatures.
Forests hold social, cultural, spiritual and recreational significance
Human health is linked to forest health. Time spent in forests may have positive benefits for mental health and overall wellness. Forests encourage physical activity and provide recreational and ecotourism opportunities for people living in rural and urban settings, including camping, hiking, biking, snowshoeing and wildlife viewing. Moreover, forests act as a source of sustenance and spiritual nourishment, offering food, medicine, shelter and a sanctuary for the spirit.
Forests also have cultural significance for many First Nations, Métis and Inuit Peoples. Historically, forest-based Indigenous communities depended on the abundant natural resources found within forests for subsistence, obtaining food, medicine, shelter, and materials for crafting tools and other necessities. Many of these practices continue into present day.
Forests help meet the needs of Canadians
Sustainably managed forests provide essential goods for Canadians now and for future generations, such as lumber, furniture, toilet paper and sanitary products, and packaging products. Forests also provide opportunities to accelerate low carbon building solutions and housing construction through innovative manufacturing and wood-based construction such as mass timber, panels and prefabricated (prefab) construction. These materials are part of the bioeconomy.
Forests present opportunities to boost the economic sustainability of the forest sector and the bioeconomy in Canada; they provide enormous potential to produce bioenergy, which is particularly important in rural and Indigenous communities. Canada’s forests also provide diverse revenue sources through value-added bioproducts, such as textiles, industrial chemicals, pharmaceuticals and personal care products. The bioeconomy can also benefit Canadians by reducing our dependence on fossil fuels, reducing Canada’s net greenhouse gas emissions.
Forests support communities through diverse employment opportunities. In 2023, Canada’s forest sector employed 199,345 people (a 1.6% decrease from 2022). In addition, according to the last Census (2021), approximately 19% of the forest sector workers are women (over 34,000), 13% are immigrants, 12% are visible minorities and 6% are Indigenous (over 11,000). The forest sector supports approximately 300 forest-reliant communities, many of which are Indigenous.
The forest sector employment in rural and Indigenous communities is important for Canada’s overall economic health. Supporting Indigenous-led forestry projects is one of many ways to promote reconciliation, self-determination and economic development in Indigenous communities.
Indicator: Forest sector employmentFootnote 2
Annual indicator of direct employment in the forest sector. This indicator is an important measure of how the forest sector contributes nationally to the economic and social welfare of Canadians.
Indicator details
In 2023, Canada’s forest sector employed 199,345 people, which is a 1.6% decrease from 2022. According to the last census (2021), approximately 19% of the forest sector workers are women, 13% are immigrants, 12% are visible minorities and 6% are Indigenous. In 2021, over 11,000 Indigenous people worked in the forest sector.
- Employment in the forest sector has remained fairly stable since 2021.
- The forestry and logging subsector saw the largest decrease in employment in 2023 at 4.4%, reflecting long-term fibre supply shortages that are particularly challenging in British Columbia.
- Jobs in support activities for forestry, which includes employment in forest conservation and reforestation services, timber cruising, and fire fighting activities, saw the only increase in employment of the forest sub-sectors. Rising by 3.8% since 2022, this change reflects the increased forest maintenance and wildfire management required during 2023.
Wood product manufacturing, a category that includes facilities like sawmills, has the largest proportion of forest sector jobs, employing 48% of forest sector workers. As a result, closures of mills and other manufacturing facilities can cause large impacts across the forest sector and local communities.
Why is this indicator important?
- The forest sector is an important employer in Canada and contributes to the economic and social welfare of the country and many of its communities.
- The forest sector employment is particularly important for many rural and Indigenous communities, where it often presents a large source of income.
What is the outlook?
- Increased funding for housing initiatives is expected to strengthen the forest sector employment in 2024 to meet increasing demand for wood-based construction materials.
- Shortages of skilled tradespeople continues to be a challenge to the forest sector, which is caused in part by reduced apprenticeship enrollment during the COVID-19 pandemic and an aging workforce. However, apprenticeship registration has been increasing since 2020, exceeding pre-pandemic levels for many trades.
- The forest sector’s transformation to increase efficiencies in the use of timber and energy, reduce negative environmental impacts, and shift production to higher-value green products will create new forest sector opportunities for Canadians.
How government initiatives support sustainable forest management
- There are various provincial and federal programs that support employment in the forest sector. The federal Indigenous Forestry Initiative is one example of how the Government of Canada helps to increase the participation of Indigenous Peoples in the Canadian economy and improve economic outcomes for Indigenous Peoples throughout Canada.
Forest sector direct employment, 2013–2023
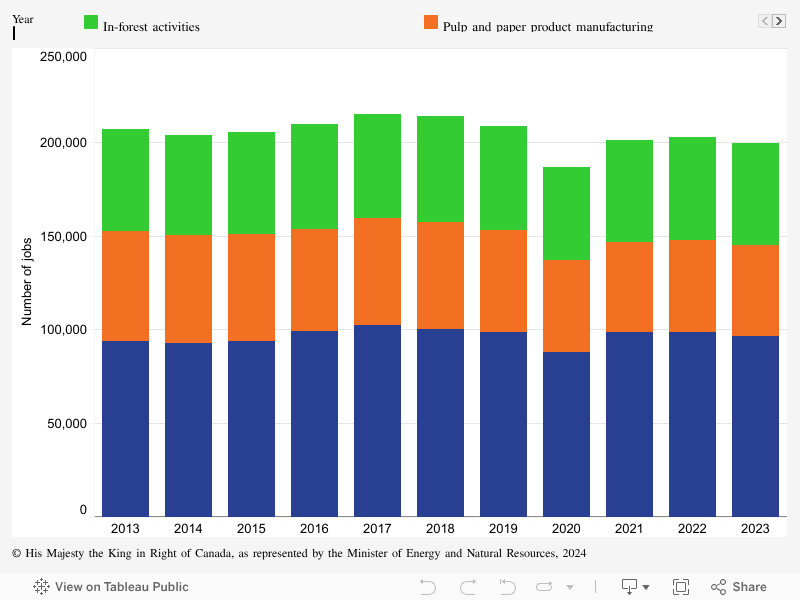
Graph summary
Comparison of the total number of jobs in the forest sector by subsector for each year between 2013 and 2023.
Graph data
| Year | Number of jobs | ||
|---|---|---|---|
| In-forest activities | Pulp and paper product manufacturing | Wood product manufacturing | |
| 2013 | 54,415 | 58,495 | 93,915 |
| 2014 | 53,305 | 57,480 | 92,660 |
| 2015 | 53,915 | 57,045 | 94,060 |
| 2016 | 55,940 | 54,180 | 99,160 |
| 2017 | 55,425 | 57,210 | 102,120 |
| 2018 | 56,305 | 56,995 | 100,415 |
| 2019 | 55,480 | 54,515 | 98,485 |
| 2020 | 49,680 | 48,975 | 87,930 |
| 2021 | 54,550 | 48,215 | 98,400 |
| 2022 | 54,870 | 48,965 | 98,665 |
| 2023 | 54,355 | 48,365 | 96,625 |
Indicator: Forest sector average earningsFootnote 3
Annual average earnings in the forest sector. Trends in average earnings indicate the overall importance of the sector to the economy, especially when compared with other industries.
Indicator details
In 2023, the average employment earnings of workers across the forest sector increased by 1.5% from 2022 levels to approximately $56,400 annually (in 2017 dollars) and decreased 3.4% from the 10-year peak achieved in 2021. While average earnings are volatile year-over-year, they have generally followed a stable upward trend since 2001.
Average employment earnings refer to the average net annual income per person directly employed in the forest sector and excludes overtime pay.
- In 2023, employment earnings from wood product manufacturing and from forestry and logging activity were up 3.6% and 2.3% (in 2017 dollars), respectively, compared to 2022. Elements that put upward pressure on wages include productivity gains (e.g., technology and equipment improvements), strong domestic and international demand for wood-based products and raw wood materials and increased lumber prices.
- Over the same period, average earnings of workers in the pulp and paper product manufacturing subsector were down very slightly (-0.7%). Elements that put downward pressure on wages include increased production costs due to inflation and supply chain disruptions (e.g. wildland fires). Rising costs of inputs could reduce profit margins, which could lead to reductions in earnings.
- Overall, average earnings in the forest sector remained slightly higher than average earnings across all manufacturing jobs.
Why is this indicator important?
- Trends in the forest sector average employment earnings highlight the importance of the forest sector to the economy and to the social well-being of Canadians when compared with other industries.
- Real wage growth, (i.e., changes to wages after adjusting for inflation), reflects the change in actual purchasing power of employees in the forest sector.
What is the outlook?
- In the short term, commodity price performance and changes in production costs due to variations in energy prices, inflation and logistics factors could impact compensation levels.
- In the long term, improving productivity and the expansion of the bioeconomy and other high-value forest products could support growth in specialized technical positions with enhanced skills and educations, and may increase pay rates.
How government initiatives support sustainable forest management
- There are various federal and provincial programs that support employment in the forest sector. These programs contribute to a resilient forest sector, fostering employment opportunities and economic stability.
- The federal Forest Innovation Program aims to improve the sustainability and economic productivity of Canada’s forest sector by supporting the advancement of new products, and improved processes and technologies.
- The federal Green Construction through Wood Program encourages innovative wood-based building technologies and low-carbon construction materials.
- The Investments in Forest Industry Transformation (IFIT) Program supports projects that facilitate the development and adoption of innovative technologies and products, with a focus on the bioeconomy.
Average earnings in the forest sector compared with all manufacturing sectors, 2013–2023
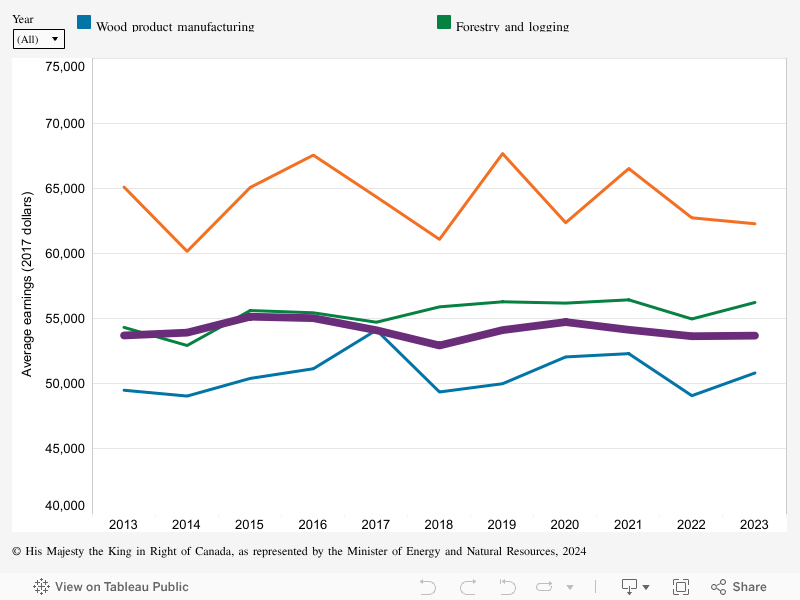
Graph summary
Comparison of average earnings in the forest sector by subsector and for all other manufacturing sectors for each year between 2013 and 2023.
Graph data
| Year | Average earnings (2017 dollars) | |||
|---|---|---|---|---|
| Forestry and logging | Pulp and paper product manufacturing | Wood product manufacturing | All manufacturing | |
| 2013 | 54,315 | 65,110 | 49,481 | 53,695 |
| 2014 | 52,923 | 60,164 | 49,034 | 53,912 |
| 2015 | 55,612 | 65,080 | 50,391 | 55,139 |
| 2016 | 55,438 | 67,565 | 51,133 | 55,027 |
| 2017 | 54,713 | 64,353 | 54,109 | 54,097 |
| 2018 | 55,895 | 61,089 | 49,347 | 52,923 |
| 2019 | 56,285 | 67,684 | 49,983 | 54,107 |
| 2020 | 56,182 | 62,367 | 52,044 | 54,724 |
| 2021 | 56,435 | 66,531 | 52,296 | 54,131 |
| 2022 | 54,964 | 62,744 | 49,062 | 53,636 |
| 2023 | 56,233 | 62,288 | 50,808 | 53,681 |
Indicator: Forest communitiesFootnote 4
Statistics about people working and living within Canada’s forests. Forests provide a range of important economic, cultural and environmental benefits for many Canadian rural and urban communities
Indicator details
Canada’s forest sector plays an important role in the economic and cultural landscape, particularly in rural and Indigenous communities, where it is one of the primary employers. With millions of people living in forested areas, forests continue to provide essential economic, cultural and health benefits to communities across the country.
Communities are municipalities or similar local areas where people live and work. Employment in the forest sector at the local level develops community self-reliance, economic resilience and opportunities for a diversified economy.
Forest resources in Canada sustain the natural landscape and the livelihoods for communities across urban and rural areas offering environmental, economic and cultural benefits.
- Roughly one third of Canada’s population resides in or near forested areas.
- There are approximately 300 forest-reliant communities in Canada, where the forest sector serves as a vital source of employment and income.
- Communities characterized by lower sectoral diversity, where the forest sector contributes 14% (moderately reliant) to 26% (highly reliant) of total income, consider the forest sector a vital source of both employment and income (based on Census 2021).
- Forest-reliant communities account for around 2% of Canada’s population, totalling approximately 615,000 people.
- According to the most recently available Census (2021), over one million First Nations, Métis and Inuit people live in or near forests and over 11,000 are employed in the forest sector.
Why is this indicator important?
- Forest-reliant communities in Canada are stewards of forested landscapes. They participate in sustainable forest management (SFM), monitor wildlife and manage wildland fires. These activities are important to the delivery of local forest mitigation and adaptation initiatives. Additionally, communities near forests rely heavily on the forest sector for employment and income. Any downturns in the sector affect not only its employees but the entire community’s social and economic well-being.
- Forests hold cultural significant for numerous First Nations, Métis and Inuit communities, playing integral roles in their health and overall well-being, beyond just economic benefits. Furthermore, forests provide residents of forest-reliant communities with various environmental services and recreational opportunities.
What is the outlook?
- The forest sector will find new opportunities from the increased demand for solid wood products for residential construction.
- A skilled and resilient forest workforce is crucial for Canada’s transition to low-carbon economy. Continuous efforts in recruiting, training and retaining workers to sustain the sector is required. Providing education and capacity-building initiatives can help strengthen forest-dependent communities. Diversification of forest products through bioeconomy and innovation can help empower these communities to thrive and adapt in a changing world.
How government initiatives support sustainable forest management
- In 2024, the Government of Canada unveiled its National Housing Strategy, targeting the construction of 3.87 million new homes by 2031.
- Since 2017, the Green Construction through Wood program has been successfully encouraging the use of innovative wood-based building technologies in construction projects, including generating awareness and implementation of innovative wood building systems with First Nations across Canada. For example, the Tsleil-Waututh First Nation’s Administration and Health Centre in British Columbia is a primary structure that is all wood. It showcases the values of the community’s cultural heritage that is embodied in the design solutions and were developed through an integrated collaborative design process with the entire Tsleil-Wautuh community.
- Since 2017, the Indigenous Forestry Initiative (IFI) has been successfully accelerating Indigenous entry to the sector, supporting Indigenous businesses, skills training, and capacity building for Indigenous-led forest sector projects. For example, one project in Ontario resulted in 40 First Nation participants receiving training as truck drivers, millwrights or heavy equipment mechanics, developing skills to succeed in the forest products sector.
- The IFI continues to evolve to better align with Indigenous priorities, most recently broadening its mandate to include targeted support for forest stewardship. The program’s new grants stream has the potential to directly increase Indigenous participation in forest management planning and SFM policy discussions.
- Ensuring diverse perspectives in forest sector dialogues is important, as communities in Canada that depend on forests continue to experience the effects of climate change and natural disturbances, such as frequent and severe wildfires and pest infections, impacting forest health.