

On this page
- Theme introduction
- Indicator: Forest insects
- Indicator: Forest diseases
- Indicator: Forest fires
- Indicator: Forest carbon emissions and removals
- Sources and information
Theme introductionFootnote 1
Forest composition changes continuously through natural processes such as species migration, inter-specific competition, succession and natural disturbances. Disturbances, such as wildland fires, drought, windthrow, parasitism and disease are increasing in frequency and magnitude due to accelerated invasive species introductions and climate change. Natural Resources Canada (NRCan) research is improving our ability to predict, adapt to, and reduce the impacts of forest disturbance.
Major sources of disturbance
Climate change refers to long-term changes in global weather patterns such as average temperature or precipitation. Although these changes in statistical averages seem gradual, they reflect changes in the frequency and intensity of extreme weather events, such as extensive flooding that followed severe rain in southern British Columbia in 2021, or the -record-breaking number of wildland fires across the country in 2023. Novel species interactions or range shifts that occur in response to climate change can also drive new insect or disease outbreaks.
Introductions of invasive alien species have escalated in recent decades due to increased global trade and travel. The impacts of these introductions are difficult to predict. Invasive alien insects and diseases must contend with novel environments to which they may be poorly adapted. On the other hand, local forest ecosystems and tree species may lack effective defences against these invaders. In Canada, the management of native forest insects and diseases must be accompanied by a constant effort to prevent the introduction of invasive alien species and to contain or eradicate established invaders such as spongy moth and white pine blister rust.
Individual disturbances can build on one another, compounding their effects on forest health and the surrounding environment. For example, forest stands lost to drought or insect outbreaks can supply increased fuel for wildland fires and often leave the landscape more susceptible to erosion. This is what happened when a mountain pine beetle outbreak peaked across British Columbia in the early 2000s, facilitated by factors such as mild winter temperature. The beetle spread across the Rocky Mountains into the Prairies, decimating pine forests in these regions. It also amplified the likelihood of other disturbances through the production of increased wood fuel. Furthermore, it altered the hydrology, affecting soil stability in mountainous terrain. Tree mortality has transformed lodgepole pine forests in this region from a net carbon sink to a source, further contributing to climate change.
The government supports progress toward a resilient future
NRCan research and programs in Canada are improving our ability to predict, adapt to, and reduce the effects of forest disturbance. Here are some examples:
- The Canadian Food Inspection Agency works with NRCan and other stakeholders to regulate invasive species and the import and export of Canadian forestry products.
- The 2 Billion Trees Program supports the regeneration of forests that have temporarily lost their tree cover due to natural disturbances.
- The Wildfire Resilient Futures Initiative supports activities to transform the way Canada manages wildfires, recognizing that we need to take proactive steps to prepare for wildfires and to reduce risks before they occur.
- The WildFireSat satellite mission, a collaboration between NRCan, the Canadian Space Agency and Environment and Climate Change Canada, will be the world’s first purpose-built, public satellite system for monitoring fires, providing daily information on all active wildfires to support rapid fire management decisions.
- The Forest Systems Information and Technology Enhancement program will improve information related to forest carbon and forest integrity, to support decisions about strengthening and sustaining Canada’s forest resources.
Indicator: Forest insectsFootnote 2
Trends of forest area affected by insects across Canada. Monitoring forest area defoliated and damaged by insects is important to determine impacts to timber supply, the risk of fire, and the risk to recreational enjoyment and other forest values.
Indicator details
Insects represent a large proportion of all living things on Earth, with over half of all animals described being an insect. In Canada, there are almost 39,000 described insect species and additional 35,000 estimated undescribed species. Altogether, insects represent more than one out of every two species in Canada.
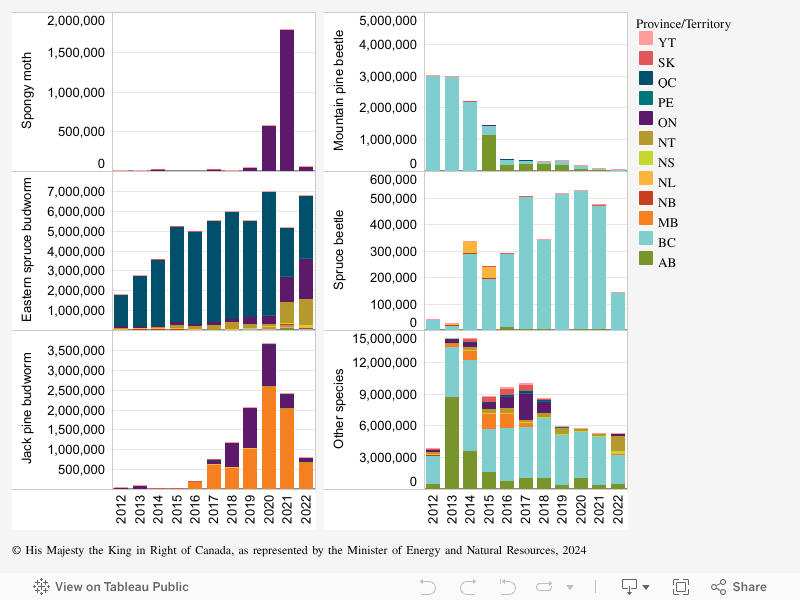
In 2022, 13.1 million ha of Canada’s forests were affected by insects, a 13.7% decrease from 2021.
- The significant outbreak of spongy moth in Ontario decreased dramatically between 2021 and 2022, with defoliation declining by over 95%. Defoliation in other provinces with known populations of spongy moth, such as Québec, was minimal.
- Defoliation by eastern spruce budworm rebounded to approximately 6.6 million ha, similar to the 2020 defoliation levels. The rebound was driven by increases in defoliation in Québec, Ontario and the Northwest Territories. Defoliation also increased in Newfoundland and Labrador.
- Defoliation by jack pine budworm decreased to levels last observed in 2017. This decline was driven primarily by decreases in outbreaks spanning the Ontario-Manitoba border.
- The area affected by spruce beetle declined from relatively high and stable levels for the first time since 2019. Damage was nearly all centred in British Columbia and Alberta, with some tree mortality in Yukon.
- Approximately 6 million ha were affected by other insect pests in 2022. This number is similar to that of 2021. However, increases in defoliation were seen in Ontario, Nova Scotia, Manitoba and the Northwest Territories.
Why is this indicator important?
- Insects fulfill innumerable vital ecological roles in Canada’s forests, with many insect species being closely associated with trees. Variations in their densities are common over time; however, some insects, including wood borers and defoliators, may reach population densities that can cause ecologically and economically significant effects. Negative effects include timber loss, alteration of carbon stocks, destruction of recreational areas and increases in wildland fire risk. These effects can expand beyond local and provincial jurisdictions to become regional or national issues. Forest health monitoring conducted by the provinces and territories, and, if necessary, effective management programs are essential for mitigating these risks.
- Invasive species introduced from other countries continue to be a threat to Canada’s forests. While these species are often not significant pests in their native ranges, when they arrive in a new range free of their normal controls (e.g. predators, parasites and diseases), they can establish, spread rapidly and disrupt ecosystem functioning. Trees in their new range also may have no defences against these species, which can enable them to rapidly increase in abundance and devastate tree health. Invasive species have reached extremely high population levels, such as the 1.8 million ha spongy moth outbreak in Ontario in 2021. Detection, monitoring and interception programs are critical in preventing invasive species from being introduced or established in Canada. Regulatory controls that restrict the movement of infested products or transport of invasive organisms can reduce the spread of invasive species, though these may have regional, national and international effects on trade, market access, raw material supplies and the movement of goods.
What is the outlook?
- Spongy moth populations are expected to remain low after the significant decrease in defoliation observed in 2022. Spongy moth abundance is greatly affected by the prevalence of pathogens, especially a virus and a fungus, as well as some parasites that contribute to population collapses. The abundance of these natural enemies increased in tandem with rising spongy moth population until it peaked in 2021. With a population cycle at approximately 10 years, increases in defoliation may be unlikely in the next few years. This may change if weather conditions, such as hot, dry summers favour the insect and dampen the effect of the fungus.
- Eastern spruce budworm levels remain relatively high in parts of its range. Spruce budworm outbreaks continue in the border area between northwestern Québec and northeastern Ontario, and in eastern Québec. The population levels remain low in the Maritime provinces (NB, NS, and PE), except in western Newfoundland where suppression efforts continue.
- Tree mortality caused by spruce beetle will likely continue to remain lower than previous years.
- Mountain pine beetle populations have collapsed in much of western Canada due to aggressive control actions and several cold winters, although ongoing infestations continue in northwestern and southeastern British Columbia.
- The threat of invasive species will continue to be important in relation to protecting Canada’s forests. Presently, several species threaten important components of Canada’s forests. Hemlock woolly adelgid has established in the southwest part of Nova Scotia, where it is expected to continue to spread and cause increasing levels of hemlock mortality. Although this insect is not as widespread in Ontario, hemlock woolly adelgid is expected to expand its range in the province via long-range dispersion by birds and other means. Ongoing tree mortality caused by emerald ash borer threatens both managed and wild ash species across the native range of ash trees in Canada. Significant research in species biology, monitoring tools and management methods for these insects is needed to develop strategies for these, as well as many other species to protect Canada’s forests from these threats to forest health.
How government initiatives support sustainable forest management
- With continued treatment via the Early Intervention Strategy, as well as the increase of regulatory factors such as natural enemies in the populations, densities of the Eastern spruce budworm are expected to decrease relatively soon in the Maritime provinces.
Forest area (in hectares) containing defoliated or beetle-killed trees for key insects in Canada, 2012-2022
Graph summary
Comparison of the area disturbed for five forest insect species (spongy moth, eastern spruce budworm, jack pine budworm, mountain pine beetle and spruce beetle) and all others by jurisdiction for each year from 2012 to 2022.
Graph data
| Jurisdiction | Year | Spruce beetle | Mountain pine beetle | Jack pine budworm | Eastern spruce budworm | Spongy moth | Other species |
|---|---|---|---|---|---|---|---|
| Alberta | 2012 | 0 | 0 | 28,530 | 0 | 496,194 | |
| 2013 | 0 | 0 | 37,076 | 0 | 8,667,566 | ||
| 2014 | 0 | 0 | 44,387 | 0 | 3,590,495 | ||
| 2015 | 1,405 | 1,121,477 | 0 | 51,750 | 0 | 1,645,030 | |
| 2016 | 10,465 | 198,963 | 0 | 19,265 | 0 | 764,679 | |
| 2017 | 3,138 | 213,170 | 0 | 17,337 | 0 | 1,044,352 | |
| 2018 | 2,145 | 205,015 | 1,217 | 30,446 | 0 | 990,575 | |
| 2019 | 1,762 | 178,909 | 0 | 47,213 | 0 | 412,864 | |
| 2020 | 2,853 | 77,637 | 0 | 65,719 | 0 | 1,027,715 | |
| 2021 | 2,095 | 23,051 | 0 | 100,443 | 0 | 373,101 | |
| 2022 | 182 | 8,981 | 0 | 68,069 | 0 | 510,660 | |
| British Columbia | 2012 | 42,862 | 3,016,228 | 0 | 0 | 0 | 2,701,892 |
| 2013 | 18,693 | 2,973,935 | 0 | 0 | 0 | 4,756,048 | |
| 2014 | 288,892 | 2,208,687 | 0 | 0 | 0 | 8,581,306 | |
| 2015 | 194,050 | 326,477 | 0 | 0 | 0 | 4,032,772 | |
| 2016 | 281,497 | 177,706 | 0 | 250 | 0 | 5,011,612 | |
| 2017 | 501,873 | 119,089 | 0 | 756 | 0 | 4,801,824 | |
| 2018 | 340,405 | 113,781 | 0 | 0 | 0 | 5,774,383 | |
| 2019 | 515,447 | 178,140 | 0 | 3,885 | 0 | 4,807,136 | |
| 2020 | 525,271 | 111,963 | 0 | 7,267 | 0 | 4,439,171 | |
| 2021 | 470,668 | 73,238 | 0 | 36,449 | 0 | 4,583,038 | |
| 2022 | 143,569 | 50,820 | 0 | 0 | 0 | 2,709,925 | |
| Manitoba | 2012 | 0 | 0 | 0 | 240 | 0 | 0 |
| 2013 | 0 | 0 | 311 | 1,163 | 0 | 305,790 | |
| 2014 | 0 | 0 | 4,346 | 0 | 0 | 905,484 | |
| 2015 | 0 | 0 | 3,285 | 0 | 0 | 1,480,933 | |
| 2016 | 199,799 | 12,597 | 1,427,175 | ||||
| 2017 | 638,181 | 388 | 429,610 | ||||
| 2018 | 552,118 | 71,055 | |||||
| 2019 | 1,025,850 | 34,305 | 714 | ||||
| 2020 | 0 | 0 | 2,580,547 | 104,433 | 0 | 3,067 | |
| 2021 | 0 | 0 | 2,035,037 | 156,055 | 0 | 34,937 | |
| 2022 | 0 | 0 | 673,851 | 19,422 | 0 | 151,956 | |
| New Brunswick | 2012 | 20 | 0 | 0 | 0 | 0 | 54,000 |
| 2013 | 0 | 0 | 0 | 0 | 0 | 4,700 | |
| 2014 | 0 | 0 | 0 | 0 | 0 | 0 | |
| 2015 | 0 | 0 | 0 | 0 | 0 | 0 | |
| 2016 | 0 | 0 | 0 | 0 | 0 | 0 | |
| 2017 | 0 | 0 | 0 | 875 | 0 | 0 | |
| 2018 | 0 | 0 | 0 | 440 | 0 | 0 | |
| 2019 | 0 | ||||||
| 2020 | 0 | 0 | 0 | 0 | 0 | 0 | |
| 2021 | 0 | 0 | 0 | 0 | 0 | 0 | |
| 2022 | 100 | 0 | 0 | 1,200 | 0 | 2,100 | |
| Newfoundland and Labrador | 2012 | 33,255 | 28,078 | ||||
| 2013 | 7,848 | 55,045 | 1,991 | ||||
| 2014 | 46,839 | 0 | 0 | 50,767 | 0 | 3,083 | |
| 2015 | 46,839 | 0 | 0 | 36,352 | 0 | 2,730 | |
| 2016 | 0 | 0 | 0 | 34,520 | 0 | 3,897 | |
| 2017 | 0 | 0 | 0 | 430 | 0 | 1,443 | |
| 2018 | 0 | 0 | 0 | 0 | 0 | 650 | |
| 2019 | 0 | 0 | 0 | 0 | 0 | 0 | |
| 2020 | 0 | 0 | 0 | 3,319 | 0 | 214 | |
| 2021 | 0 | 0 | 0 | 65,701 | 0 | 799 | |
| 2022 | 0 | 0 | 0 | 167,209 | 0 | 0 | |
| Northwest Territories | 2012 | 61,457 | 209,390 | ||||
| 2013 | 53,539 | 75,567 | |||||
| 2014 | 76,400 | 272,039 | |||||
| 2015 | 174,263 | 339,574 | |||||
| 2016 | 122,473 | 397,395 | |||||
| 2017 | 245,859 | 240,882 | |||||
| 2018 | 391,615 | 357,534 | |||||
| 2019 | 215,753 | 593,867 | |||||
| 2020 | 0 | 0 | 0 | 107,760 | 0 | 292,930 | |
| 2021 | 0 | 0 | 0 | 1,025,150 | 0 | 192,650 | |
| 2022 | 0 | 0 | 0 | 1,310,000 | 0 | 1,460,000 | |
| Nova Scotia | 2012 | ||||||
| 2013 | |||||||
| 2014 | 533 | ||||||
| 2015 | |||||||
| 2016 | |||||||
| 2017 | 0 | 0 | |||||
| 2018 | 0 | 0 | |||||
| 2019 | 0 | 0 | |||||
| 2020 | 0 | 0 | 0 | 0 | 0 | 0 | |
| 2021 | 0 | 0 | 0 | 0 | 30 | 18,727 | |
| 2022 | 0 | 0 | 0 | 0 | 0 | 167,559 | |
| Ontario | 2012 | 0 | 0 | 61,018 | 99,797 | 8,123 | 254,407 |
| 2013 | 0 | 0 | 91,865 | 348 | 8,451 | 315,839 | |
| 2014 | 0 | 0 | 22,010 | 30,317 | 23,335 | 534,429 | |
| 2015 | 0 | 0 | 21,349 | 149,310 | 2,529 | 686,311 | |
| 2016 | 0 | 0 | 5,086 | 119,462 | 0 | 1,197,517 | |
| 2017 | 0 | 0 | 100,510 | 147,546 | 21,712 | 2,511,092 | |
| 2018 | 0 | 0 | 625,955 | 136,410 | 14,930 | 1,082,906 | |
| 2019 | 0 | 0 | 1,029,916 | 343,426 | 47,431 | 53,620 | |
| 2020 | 0 | 0 | 1,060,623 | 447,730 | 583,158 | 23,735 | |
| 2021 | 0 | 0 | 345,389 | 1,327,513 | 1,780,348 | 57,658 | |
| 2022 | 0 | 0 | 133,472 | 2,035,849 | 57,078 | 277,114 | |
| Prince Edward Island | 2012 | 50 | 5 | 30 | |||
| 2013 | 60 | 1 | 35 | ||||
| 2014 | 50 | 25 | |||||
| 2015 | 50 | 25 | |||||
| 2016 | 10 | 17 | |||||
| 2017 | 10 | 2 | 15 | ||||
| 2018 | 5 | 2 | 10 | ||||
| 2019 | 5 | 2 | 12 | ||||
| 2020 | 0 | 0 | 0 | 0 | 0 | 0 | |
| 2021 | 0 | 0 | 0 | 0 | 0 | 10 | |
| 2022 | 0 | 0 | 0 | 0 | 0 | 220 | |
| Quebec | 2012 | 1,537,562 | 0 | 7,788 | |||
| 2013 | 0 | 2,621,520 | 0 | 17,699 | |||
| 2014 | 0 | 3,381,829 | 0 | 15,833 | |||
| 2015 | 0 | 4,824,947 | 0 | 27,317 | |||
| 2016 | 0 | 0 | 4,664,658 | 0 | 68,527 | ||
| 2017 | 0 | 0 | 5,105,885 | 0 | 212,069 | ||
| 2018 | 0 | 0 | 5,433,302 | 0 | 118,491 | ||
| 2019 | 4,891,885 | ||||||
| 2020 | 0 | 0 | 0 | 6,246,502 | 0 | 0 | |
| 2021 | 0 | 0 | 0 | 2,463,419 | 0 | 0 | |
| 2022 | 0 | 0 | 0 | 3,211,755 | 0 | 0 | |
| Saskatchewan | 2012 | 31,221 | 51,374 | ||||
| 2013 | 9,307 | 99,837 | |||||
| 2014 | 0 | 0 | 0 | 0 | 0 | 304,176 | |
| 2015 | 0 | 0 | 0 | 0 | 428,955 | ||
| 2016 | 0 | 1,965 | 0 | 0 | 565,762 | ||
| 2017 | 0 | 10,189 | 0 | 0 | 610,097 | ||
| 2018 | 0 | 6,141 | 0 | 0 | 143,057 | ||
| 2019 | 0 | 12,624 | 0 | 0 | 53,820 | ||
| 2020 | 0 | 0 | 25,327 | 0 | 0 | 13,180 | |
| 2021 | 0 | 0 | 32,449 | 0 | 0 | 31,082 | |
| 2022 | 0 | 0 | 293 | 0 | 0 | 4,450 | |
| Yukon | 2012 | 263 | 0 | 0 | 0 | 0 | 72,345 |
| 2013 | 0 | 0 | 0 | 0 | 0 | 5,100 | |
| 2014 | 82 | 6,150 | |||||
| 2015 | 95,248 | ||||||
| 2016 | 200,943 | ||||||
| 2017 | 369 | 113,917 | |||||
| 2018 | 1,196 | 0 | 0 | 0 | 0 | 7,751 | |
| 2019 | 1,196 | 0 | 0 | 0 | 0 | 7,751 | |
| 2020 | 0 | 0 | 0 | 788 | 0 | 0 | |
| 2021 | 2,276 | 0 | 0 | 0 | 0 | 35,538 | |
| 2022 | 556 | 0 | 0 | 0 | 0 | 1,271 |
Indicator: Forest diseasesFootnote 3
Tracking information of tree diseases. This is an important indicator that helps us better understand undesirable economic, social and ecological outcomes, including regeneration failure, volume loss and tree mortality.
Indicator details
Tree diseases are caused by pathogens, which are often fungi. However, fungi also provide many important benefits to forests including increasing water and nutrient uptake in trees, driving nutrient cycling as decomposers of wood, leaves and other materials, and as sources of food for microorganisms and animals.
New or unknown forest diseases can appear because of being recently introduced into Canada from other countries or because of being unnoticed due to historically low levels of infection. In 2023, several diseases were reported for the first time in Canada or in new regions in Canada.
- The invasive oak wilt disease was reported for the first time in Canada from three locations in Ontario.
- The sooty bark disease of maple, that is endemic to the Great Lakes region of North America and associated with droughts and heat waves, was officially reported for the first time in British Columbia.
- The aspen running canker disease, that was first described in Alaska in 2022, was found in the Yukon.
- A new canker disease of laurel willow was described in Alberta.
Why is this indicator important?
- Alien and native invasive forest diseases can cause widespread and severe damage to Canadian forests, threatening biodiversity, ecosystem services, forest-based industries and trade.
- Climate change can exacerbate diseases by causing conditions that weaken trees, expand the range of pathogens and promote infection.
What is the outlook?
- A changing climate will bring some uncertainty for Canadian forest health. For example, cool, wet springs promote leaf diseases while hot, dry summers aggravate root diseases.
- Expanding global trade increases the risk of biological invasions by pests and pathogens that may be present on traded commodities.
How government initiatives support sustainable forest management
- The Canadian Forest Service collaborates with the Canadian Food Inspection Agency to reduce the risk of pathogens in wood imports and exports and conducts research to reduce the effects of pathogens in commercial forests across Canada.
- Surveillance and early detection of forest pathogens are essential. Canada invests in research for proactive surveillance which includes the development of DNA-based detection tools and a network of aerial spore traps to intercept and respond to pathogens of concern.
- The Government of Canada has embarked on a collaborative project with the provincial governments of British Columbia, Alberta and Québec, supported by the 2 Billion Trees program to identify pathogen-free seed to ensure healthy seedlings for planting.
- Through good forest management practices, pathogens are managed by the provinces through matching tree species to the climate and soils, genetic improvement programs, and removal of dead trees.
- Canada is investing in research and tools that can be deployed to combat forest health challenges including genomics-based identification and surveillance, breeding trees for disease resistance, tolerance to drought and other stresses, assisted migration, and biological control agents.
Indicator: Forest firesFootnote 4
Annual data on total area burned and number of fires in the last 24 years. Understanding forest fires in Canada is important as they are a natural part of the forest ecosystem and help maintain the health and diversity of the forest but can also result in costly economic losses and provide public health and safety concerns.
Indicator details
Wildland fires in Canada burned more area, produced more smoke, triggered more evacuations and cost more to manage in 2023 than any previous year on record.
- Low snowpack, above-average temperatures, early snowmelt, and a dry spring brought fire-conducive conditions to much of the west, as did rapid drying in the east in May.
- The fire season started early, with the first large fire near Evansburg, Alberta, at the end of April. By the end of May, more than 1 million ha had burned in Alberta—an area greater than Banff National Park.
- In Nova Scotia, the Barrington Lake fire started on May 26 and over the next two weeks grew to become the largest in the province’s recorded history. At the same time, the Tantallon fire near Halifax prompted the evacuation of 16,000 people and destroyed 150 homes.
- In British Columbia, a lightning strike started the Donnie Creek fire on May 12. This fire burned all summer and into October. At 619,000 ha, it was the largest fire in British Columbia history and one of several wildland fires that survived the winter and re-emerged in the spring of 2024.
- In Québec, lightning storms ignited 182 wildland fires in one day at the beginning of June. By the end of the season, more than 4.5 million ha of forest burned in the province—more than the previous 20 years combined. Smoke from these fires inundated parts of Ontario and the northeastern United States.
- A group of wildland fires that were close to each other near the British Columbia-Alberta-Northwest Territories border merged to become the largest burned area of the year at over 1 million ha—the largest in Canada since 1950.
- The entire population of Canada was subjected to poor air quality at some time during the summer, with communities in southern Northwest Territories and northwestern Québec enduring hazardous smoke concentration levels (>18 times the safe PM2.5 threshold) for more than half of the summer (>60 days).
- Fire suppression efforts involved 5,800 Canadian firefighters, 2,100 personnel from the Canadian Armed Forces and 5,500 firefighters from 12 countries.
- Tragically, eight firefighters lost their lives in the line of duty, more than any year since 1971.
- A record 232,000 people from 200 communities were evacuated from their homes over the course of the season: some more than once. The largest evacuation order affected the 20,000 residents of Yellowknife. Along with other evacuated communities in the Northwest Territories, almost 70% of the population of the territory was out of their homes in late August. Meanwhile, the 2,100 residents of Fox Lake, Alberta, experienced the year’s longest duration evacuation—74 days.
- The most destructive fires were in British Columbia’s Okanagan Valley in late August. The McDougall Creek fire near Kelowna and the Bush Creek East fire in the Shuswap, together destroyed over 400 structures and caused $720 million in insured damages.
Burned area mapping
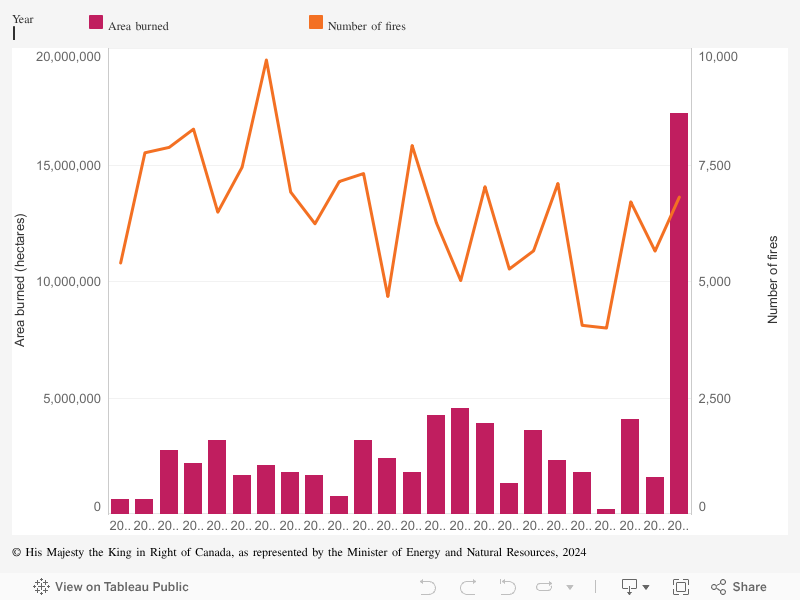
During the fire season, the area burned is estimated from fire perimeter maps made using a variety of methods, ranging from detailed (airborne infrared) to approximate (satellite hotspots). Using these methods, the total area burned in 2023 was 17.2 million ha. However, many of these perimeters include “islands” of unburned forest, water bodies, and barren land. Higher-resolution mapping using Sentinel and Landsat imagery indicates that the total burned area for 2023 was 15.0 million ha. Either way, this area is:
- larger than the island of Newfoundland
- almost twice the size of Lake Superior
- more than seven times the 20-year average
- double the previous record set in 1989
- more than 4% of Canada’s total forest area
Why is this indicator important?
- Wildland fires can damage or destroy homes and businesses, trigger evacuations, and disrupt people’s lives and livelihoods.
- Wildland fires produce large amounts of smoke, reducing air quality and visibility.
- An average of $1 billion is spent annually on fire management; the costs in 2023 were significantly higher.
- Research suggests that the extent of losses and the number of evacuations that First Nations populations experience could drastically increase in the coming decades. This may translate into major consequences, including structural and cultural losses, more land alterations, and more inherent social disruptions due to evacuations.
- Many First Nations reserves are located in forests prone to wildland fire and are often particularly vulnerable to emergencies due to their remoteness, limited access or limited ability to evacuate by road. Indigenous Peoples are 30% more likely to be impacted by wildland fires compared to non-Indigenous Canadians.
What is the outlook?
Wildland fire occurrence and spread vary significantly from year to year, but there are reasons why costs, damage and difficulty of control are increasing:
- There are more homes, businesses and infrastructure in the wildland-urban interface.
- There are more people living and working in forested areas and visiting forested areas for recreation.
- Increasing variability in climate results in more incidents of drought and high winds—conditions ideal for fire spread.
A look into the 2024 fire season: As of October 2024, fire management agencies reported that the total area burned was 5.4 million hectares, which is significantly below the 2023 total, but still well above the long-term, 25-year average. The most damaging fire of the season burned in Jasper National Park in July, triggering the evacuation of 25,000 people, consuming one-third of the buildings in the town of Jasper, and causing an estimated $1.23 billion in insured losses.
How government initiatives support sustainable forest management
- The Government of Canada is investing funds to support community preparedness and fire protection strategies in First Nations communities which are often located in remote areas at higher risk.
- Investing in Canada’s capacity to prepare for and respond to wildland fires. This includes funding in support of wildland fire prevention and mitigation, and the modernization of national wildfire information and decision-support systems.
- Investments by the federal government include support to train community-based firefighters as well as firefighters who are trained to work in urban areas affected by wildfires. There is also support for provinces and territories to procure specialized firefighting equipment.
- The development of a wildland fire dedicated satellite system, WildFireSat, will significantly enhance the ability to detect and monitor wildfires across the country, especially in Northern Canada (targeted to be used in 2029).
Forest area burned and number of forest fires in Canada, 2000-2023
Graph summary
The area burned and the number of forest fires per year in Canada from 2000 to 2023.
Graph data
| Year | Area burned (hectares) | Number of fires |
|---|---|---|
| 2000 | 634,155 | 5,397 |
| 2001 | 647,669 | 7,762 |
| 2002 | 2,763,606 | 7,878 |
| 2003 | 2,168,402 | 8,270 |
| 2004 | 3,182,999 | 6,488 |
| 2005 | 1,686,768 | 7,452 |
| 2006 | 2,100,681 | 9,754 |
| 2007 | 1,785,466 | 6,919 |
| 2008 | 1,664,925 | 6,239 |
| 2009 | 762,566 | 7,145 |
| 2010 | 3,177,967 | 7,316 |
| 2011 | 2,397,427 | 4,678 |
| 2012 | 1,811,690 | 7,918 |
| 2013 | 4,268,502 | 6,256 |
| 2014 | 4,545,658 | 5,020 |
| 2015 | 3,908,382 | 7,034 |
| 2016 | 1,319,606 | 5,267 |
| 2017 | 3,589,430 | 5,658 |
| 2018 | 2,328,845 | 7,103 |
| 2019 | 1,786,200 | 4,059 |
| 2020 | 218,235 | 4,001 |
| 2021 | 4,078,896 | 6,709 |
| 2022 | 1,585,083 | 5,653 |
| 2023 | 17,197,201 | 6,811 |
Indicator: Forest carbon emissions and removalsFootnote 5
Estimated annual net carbon emissions in Canada’s managed forests. Monitoring carbon emissions is important as carbon dioxide (CO2) and methane (CH4) are important contributors to global warming.
Indicator details
In 2022, the total net greenhouse gas (GHG) emissions—reported as carbon dioxide equivalent (CO2e)—from Canada’s managed forests and forest products were about 114 million tonnes (Mt). Managed forests are forest lands managed for timber production, conservation or fire suppression.
This total net emissions value is calculated by adding emissions/removals caused by human activities in Canada’s managed forests to emissions/removals caused by natural disturbances in Canada’s managed forests.
- In 2022, human activities in Canada’s managed forests, including the use and disposal of forest products, accounted for emissions of about 21 Mt CO2e in the atmosphere. Natural disturbances accounted for emissions of about 93 Mt CO2e, resulting in net emissions of about 114 Mt CO2e.
- Wildland fires are a significant driver of emissions from Canada’s managed forests.
Canada’s forests absorb carbon and emit atmospheric carbon dioxide (CO2), methane (CH4), carbon monoxide (CO) and nitrous oxide (N2O). In any given year, depending on the area of natural disturbances such as wildland fires, insect outbreaks and windthrows, Canada’s forests can either be a source of GHGs or a sink of atmospheric carbon.
Canada takes an approach that distinguishes forest emissions and removals in the managed forest into two components:
- Those under the influence of human activities
- Those associated with natural disturbances beyond human control
In keeping with international guidelines, Canada’s National GHG Inventory Report (NIR) focusses on the human activity component. The State of Canada’s Forests report provides a comprehensive estimate of emissions/removals for both components, including additional gas types not required in the NIR.
This year, Canada made a major improvement to its managed forest carbon estimates, reflecting new data that tells us pre-1990 harvested area is smaller than previously assumed. For more details, see the Sources and information section.
Why is this indicator important?
- Emissions of CO2, CH4, CO and N2O from forest land are important contributors to global warming.
- Canada’s forest sector provides renewable resources to the Canadian economy, resulting in emissions and removals, while also providing employment, aesthetic values, clean water, wildlife habitat and many other ecosystem services.
What is the outlook?
- The impacts of climate change on Canada’s future forest GHG balance are difficult to predict but will be characterized by large inter-annual variability.
- The area burned by wildland fires in 2023 was the largest in Canadian history. Wildfire will continue to be a significant driver of emissions from Canada’s forests.
- Natural disturbances significantly impact the ability of Canada’s managed forests to consistently absorb more CO2 than they emit.
- Changes in forest management and the increased use of long-lived wood products to store carbon in the built environment and use of wood products instead of emissions-intensive materials such as concrete, steel and fossil fuels can provide climate change mitigation opportunities.
- The data and models that are used to generate estimates of forest carbon emissions and removals are improved on an ongoing basis as new science and new measurements become available.
- The data and science that support continuous improvement of estimates are developed in partnership with academia, industry, non-governmental organizations and all orders of governments.
- Examples of recent consultations include the 2023 Blueprint for Forest Carbon Science in Canada and the 2023 in-country review by the United Nations Framework Convention on Climate Change Expert Review Team.
- Federal and provincial governments are investing in programs aimed at reducing fuel loads in Canada’s forests and to improve firefighting capabilities.
How government initiatives support sustainable forest management
- The new Forest Systems Information and Technology Enhancement (ForSITE) program is an investment in core operations to improve the Canadian Forest Service (CFS) capacity on national forest monitoring data and reporting. This will improve information on forest carbon and forest health, support Canada’s reputation and actions for sustainability, and facilitate market access for forest products.
- ForSITE leverages the federal government’s existing role in developing and sharing nimble, responsive, accurate, verified and climate change-informed forest and carbon data for all of Canada’s forests.
- The program will increase transparency and accessibility of forest monitoring, GHG estimation, accounting and reporting information, improving public confidence (both domestic and internationally) in Canada’s forests management practices
- The NRCan program, Enhancing Forest Climate Change Adaptation and Mitigation Strategies, will help to develop and disseminate knowledge and tools to improve the forest and forest sector adaptation to climate change. It will deliver analyses and projections for how forest carbon accounting and mitigation actions can make long-term contributions to meeting Canada’s greenhouse gas emission reduction targets.
- The federal program Green Construction through Wood (GCWood) promotes the use of wood in innovative buildings. Increased use of long-lived wood products store carbon in the built environment and use of wood products instead of emissions-intensive materials such as concrete, steel and fossil fuels can provide opportunities to mitigate climate change.
1. Net carbon emissions in Canada's managed forests: All areas, 1990–2022
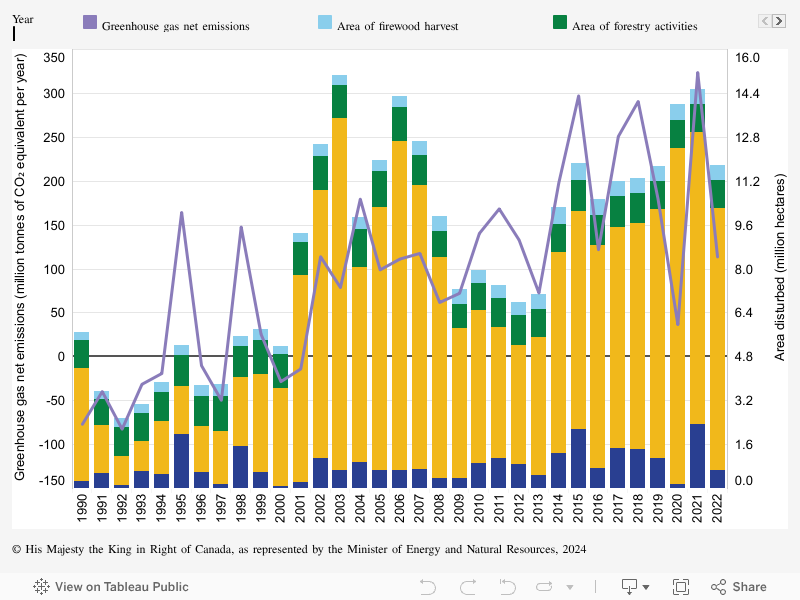
The total net emissions and removals from Canada’s managed forests, taking into account both human activities and natural disturbances, were about 114 Mt CO2e in 2022, making the forests a net source in 2022.
Graph summary
The net greenhouse gas emissions and the area disturbed per year in Canada’s managed forests for all area types between 1990 and 2022.
Graph data
| Year | Area disturbed (million hectares) | Greenhouse gas net emissions (million tonnes of CO₂ equivalent per year) | |||
|---|---|---|---|---|---|
| Area disturbed by insects | Area of forestry activities | Area of firewood harvest | Area burned | ||
| 1990 | 4.1 | 1.0 | 0.3 | 0.2 | -76.8 |
| 1991 | 1.7 | 1.0 | 0.3 | 0.6 | -39.7 |
| 1992 | 1.1 | 1.1 | 0.3 | 0.1 | -82.4 |
| 1993 | 1.1 | 1.0 | 0.4 | 0.6 | -31.3 |
| 1994 | 2.0 | 1.0 | 0.4 | 0.5 | -19.0 |
| 1995 | 1.7 | 1.1 | 0.3 | 2.0 | 164.3 |
| 1996 | 1.7 | 1.1 | 0.4 | 0.6 | -10.1 |
| 1997 | 1.9 | 1.3 | 0.4 | 0.1 | -49.5 |
| 1998 | 2.5 | 1.1 | 0.4 | 1.5 | 147.8 |
| 1999 | 3.6 | 1.2 | 0.4 | 0.6 | 25.7 |
| 2000 | 3.5 | 1.3 | 0.3 | 0.1 | -28.3 |
| 2001 | 7.6 | 1.2 | 0.3 | 0.2 | -13.9 |
| 2002 | 9.8 | 1.2 | 0.4 | 1.1 | 113.9 |
| 2003 | 12.8 | 1.2 | 0.4 | 0.7 | 78.9 |
| 2004 | 7.1 | 1.4 | 0.4 | 0.9 | 179.5 |
| 2005 | 9.6 | 1.3 | 0.4 | 0.6 | 99.0 |
| 2006 | 12.0 | 1.2 | 0.4 | 0.7 | 111.3 |
| 2007 | 10.4 | 1.1 | 0.5 | 0.7 | 117.7 |
| 2008 | 8.1 | 0.9 | 0.5 | 0.4 | 61.9 |
| 2009 | 5.5 | 0.9 | 0.5 | 0.4 | 72.3 |
| 2010 | 5.5 | 1.0 | 0.5 | 0.9 | 140.5 |
| 2011 | 4.8 | 1.1 | 0.5 | 1.1 | 168.4 |
| 2012 | 4.3 | 1.1 | 0.5 | 0.9 | 133.0 |
| 2013 | 5.0 | 1.0 | 0.5 | 0.5 | 72.7 |
| 2014 | 7.3 | 1.0 | 0.6 | 1.3 | 197.9 |
| 2015 | 7.9 | 1.1 | 0.6 | 2.2 | 297.1 |
| 2016 | 8.1 | 1.1 | 0.6 | 0.7 | 121.9 |
| 2017 | 8.1 | 1.1 | 0.5 | 1.5 | 250.9 |
| 2018 | 8.2 | 1.1 | 0.6 | 1.4 | 290.7 |
| 2019 | 9.1 | 1.0 | 0.6 | 1.1 | 179.9 |
| 2020 | 12.3 | 1.0 | 0.6 | 0.1 | 36.7 |
| 2021 | 10.6 | 1.0 | 0.5 | 2.3 | 323.7 |
| 2022 | 9.5 | 1.0 | 0.6 | 0.7 | 113.7 |
2. Net carbon emissions in Canada's managed forests: Areas subject to human activities, 1990–2022
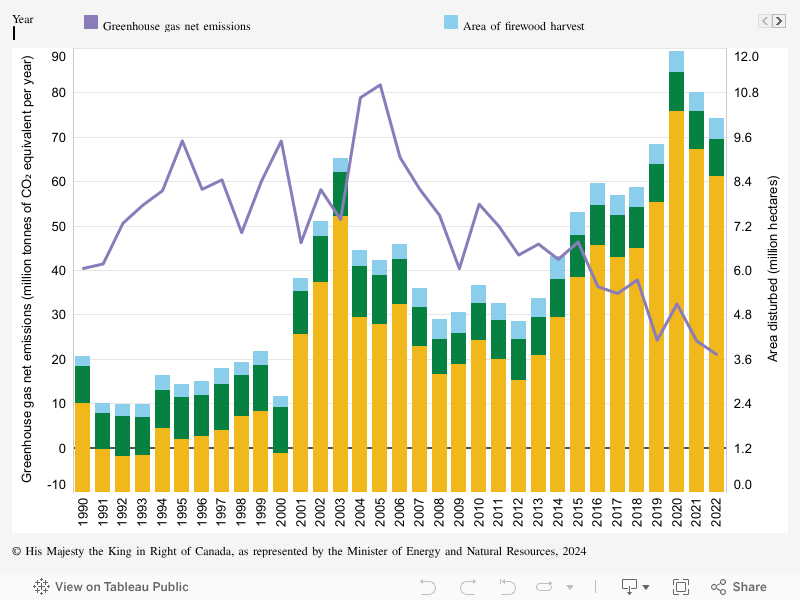
Human activities in Canada’s managed forests, such as harvesting, slash pile burning, prescribed burning, regeneration and firewood collection, as well as the use and disposal of harvested wood products, were a net source of about 21 Mt CO2e in 2022.
Graph summary
The net greenhouse gas emissions and the area disturbed per year in Canada’s managed forests for areas subject to human activities between 1990 and 2022.
Graph data
| Year | Area disturbed (million hectares) | Greenhouse gas net emissions (million tonnes of CO₂ equivalent per year) | ||
|---|---|---|---|---|
| Area of forestry activities | Area disturbed by low mortality insects | Area of firewood harvest | ||
| 1990 | 1.0 | 2.4 | 0.3 | 40.5 |
| 1991 | 1.0 | 1.2 | 0.3 | 41.5 |
| 1992 | 1.1 | 1.0 | 0.3 | 50.6 |
| 1993 | 1.0 | 1.0 | 0.4 | 54.7 |
| 1994 | 1.0 | 1.7 | 0.4 | 58.0 |
| 1995 | 1.1 | 1.4 | 0.3 | 69.2 |
| 1996 | 1.1 | 1.5 | 0.4 | 58.3 |
| 1997 | 1.3 | 1.7 | 0.4 | 60.4 |
| 1998 | 1.1 | 2.1 | 0.4 | 48.5 |
| 1999 | 1.2 | 2.2 | 0.4 | 60.1 |
| 2000 | 1.3 | 1.1 | 0.3 | 69.2 |
| 2001 | 1.2 | 4.3 | 0.3 | 46.3 |
| 2002 | 1.2 | 5.7 | 0.4 | 58.2 |
| 2003 | 1.2 | 7.5 | 0.4 | 51.5 |
| 2004 | 1.4 | 4.7 | 0.4 | 78.9 |
| 2005 | 1.3 | 4.5 | 0.4 | 81.8 |
| 2006 | 1.2 | 5.1 | 0.4 | 65.5 |
| 2007 | 1.1 | 3.9 | 0.5 | 58.3 |
| 2008 | 0.9 | 3.2 | 0.5 | 52.4 |
| 2009 | 0.9 | 3.5 | 0.5 | 40.4 |
| 2010 | 1.0 | 4.1 | 0.5 | 54.9 |
| 2011 | 1.1 | 3.6 | 0.5 | 50.0 |
| 2012 | 1.1 | 3.0 | 0.5 | 43.5 |
| 2013 | 1.0 | 3.7 | 0.5 | 45.9 |
| 2014 | 1.0 | 4.7 | 0.6 | 42.5 |
| 2015 | 1.1 | 5.8 | 0.6 | 46.4 |
| 2016 | 1.1 | 6.7 | 0.6 | 36.4 |
| 2017 | 1.1 | 6.4 | 0.5 | 34.8 |
| 2018 | 1.1 | 6.6 | 0.6 | 37.9 |
| 2019 | 1.0 | 7.8 | 0.6 | 24.3 |
| 2020 | 1.0 | 10.3 | 0.6 | 32.5 |
| 2021 | 1.0 | 9.3 | 0.5 | 24.1 |
| 2022 | 1.0 | 8.5 | 0.6 | 21.1 |
3. Net carbon emissions in Canada's managed forests: Areas subject to natural disturbances, 1990–2022
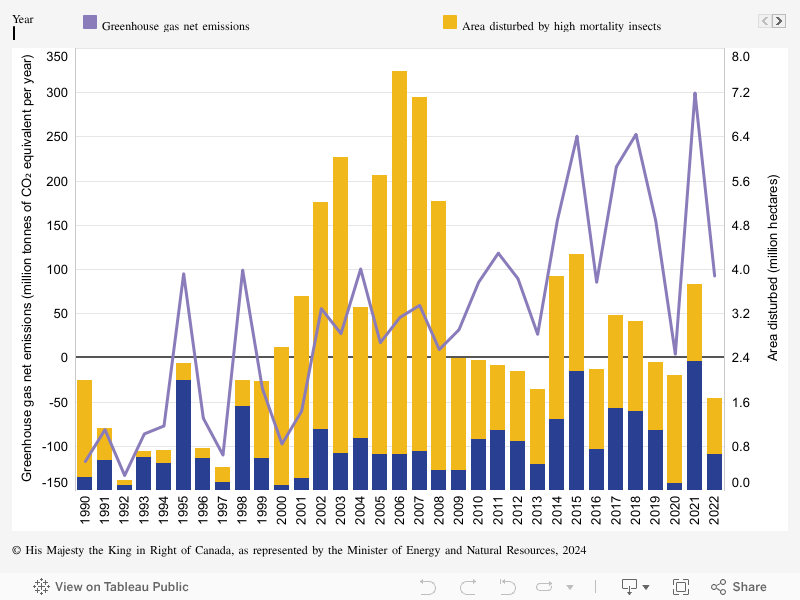
Emissions from natural disturbances display high interannual variability. In 2021, about 300 Mt CO2e were emitted, and in 2022, about 93 Mt CO2e were emitted.
Graph summary
The net greenhouse gas emissions and the area disturbed per year in Canada’s managed forests for areas subject to natural disturbances between 1990 and 2022.
Graph data
| Year | Area disturbed (million hectares) | Greenhouse gas net emissions (million tonnes of CO₂ equivalent per year) | |
|---|---|---|---|
| Area burned | Area disturbed by high mortality insects | ||
| 1990 | 0.2 | 1.7 | -117.3 |
| 1991 | 0.6 | 0.6 | -81.1 |
| 1992 | 0.1 | 0.1 | -133.0 |
| 1993 | 0.6 | 0.1 | -86.0 |
| 1994 | 0.5 | 0.2 | -77.0 |
| 1995 | 2.0 | 0.3 | 95.1 |
| 1996 | 0.6 | 0.2 | -68.3 |
| 1997 | 0.1 | 0.3 | -109.9 |
| 1998 | 1.5 | 0.5 | 99.2 |
| 1999 | 0.6 | 1.4 | -34.4 |
| 2000 | 0.1 | 2.5 | -97.4 |
| 2001 | 0.2 | 3.3 | -60.2 |
| 2002 | 1.1 | 4.1 | 55.7 |
| 2003 | 0.7 | 5.4 | 27.4 |
| 2004 | 0.9 | 2.4 | 100.6 |
| 2005 | 0.6 | 5.1 | 17.2 |
| 2006 | 0.7 | 6.9 | 45.8 |
| 2007 | 0.7 | 6.4 | 59.4 |
| 2008 | 0.4 | 4.9 | 9.4 |
| 2009 | 0.4 | 2.0 | 31.8 |
| 2010 | 0.9 | 1.4 | 85.6 |
| 2011 | 1.1 | 1.2 | 118.5 |
| 2012 | 0.9 | 1.3 | 89.6 |
| 2013 | 0.5 | 1.3 | 26.7 |
| 2014 | 1.3 | 2.6 | 155.4 |
| 2015 | 2.2 | 2.1 | 250.7 |
| 2016 | 0.7 | 1.5 | 85.6 |
| 2017 | 1.5 | 1.7 | 216.1 |
| 2018 | 1.4 | 1.6 | 252.8 |
| 2019 | 1.1 | 1.2 | 155.6 |
| 2020 | 0.1 | 1.9 | 4.2 |
| 2021 | 2.3 | 1.4 | 299.6 |
| 2022 | 0.7 | 1.0 | 92.6 |