

Gold is a precious metal commonly used for investments and jewellery (rings, necklaces, watches, etc.). Its superior electrical conductivity and resistance to corrosion also make it an important input in various electronic and technology applications.
Key facts
- Gold is Canada’s most valuable mined commodity, with a production value of $16.9 billion in 2024.
- Gold is mined in 10 Canadian provinces and territories, mostly in Ontario and Quebec, which together accounted for 68% of Canada’s total gold output in 2024.
- In 2024, Canada ranked as the fourth-largest gold producer globally, with its mines yielding nearly 200 tonnes of gold.
Learn more about gold
 Uses
Uses
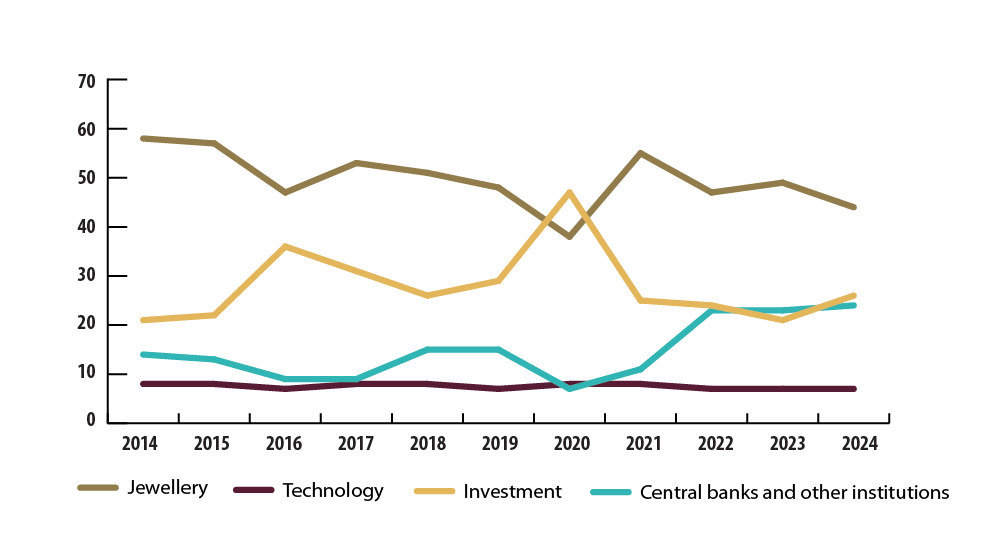
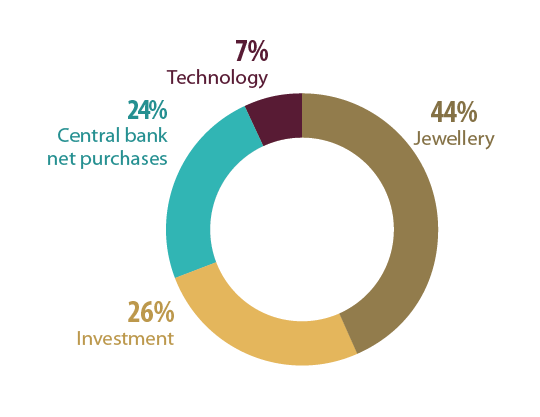
Jewellery remained the largest source of global gold demand in 2024, representing 44% of total usage, or about 2,027 tonnes. Investment demand accounted for 26%, reflecting gold’s continued appeal during periods of economic uncertainty. Central banks increased their holdings to a record 24% of total demand, driven by geopolitical tensions and inflation concerns. Meanwhile, demand from technology applications held steady at 7%, supported by micro-circuitry use in electronics and the growing adoption of artificial intelligence.
Gold uses, 2015–2024 (p)
Text version
This line graph illustrates global gold demand by sector from 2015 to 2024. The jewellery sector consistently dominated, accounting for between 38% and 58% of total demand, though it declined by 5% in 2024 compared to 2023. Investment demand fluctuated widely over the period, ranging from 21% to 47%, and ended at 26% in 2024. Demand from the technology sector remained relatively stable, between 7% and 8%, closing at 7% in 2024. Meanwhile, demand from central banks and other institutions ranged from 7% to 24%, reaching a new high of 24% in 2024.
Gold demand, 2024 (p)
Text version
This chart illustrates global gold demand in 2024. Jewellery accounted for the largest share at 44%, followed by investment at 26%. Central bank net purchases accounted for 24%, while technology represented 7% of total demand.
 Production
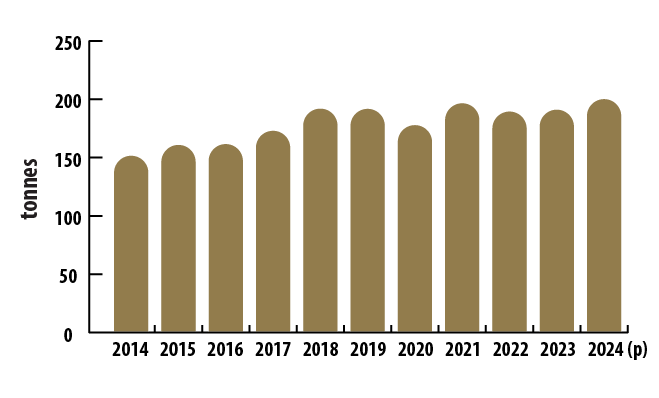
Gold production from Canadian mines has steadily increased over the past decade, reaching 200 tonnes in 2024—a 5% rise from the previous year and 25% higher than in 2015.
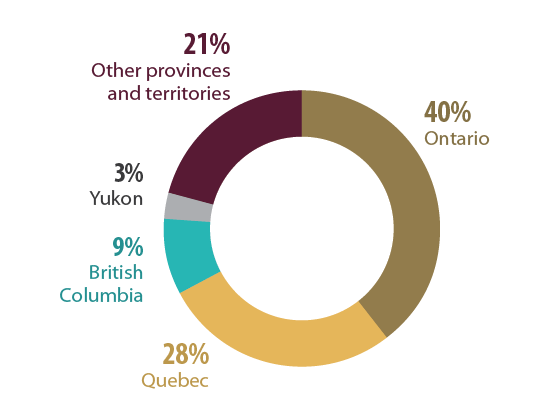
Ontario and Quebec together accounted for 68% of Canada’s total gold output in 2024, with production up by 3% and 1%, respectively, from 2023. British Columbia, representing 9% of national production, saw a 6% decline, while Yukon, which accounted for 3%, experienced a 3% increase. The remaining provinces and territories collectively accounted for 21% of total output and recorded a 20% surge compared with 2023.
Canadian gold production, by region, 2024 (p)
Text version
This chart illustrates Canada’s gold mine production for 2024. Ontario led with 79.9 tonnes (40%), followed by Quebec with 55.5 tonnes (28%), British Columbia with 17.6 tonnes (9%), Yukon with 6.0 tonnes (3%). The remaining provinces and territories collectively produced 41.1 tonnes (21%) in 2024.
Canadian gold production, 2015–2024 (p)
Text version
This bar graph illustrates Canada’s annual gold mine production from 2015 to 2024. Production began at 161 tonnes in 2015 and increased steadily over the decade, with minor declines in 2019 and 2020 before rebounding in 2021. After a slight dip in 2022, production rose again in 2023 and reached 200 tonnes in 2024.
.png) International context
International context
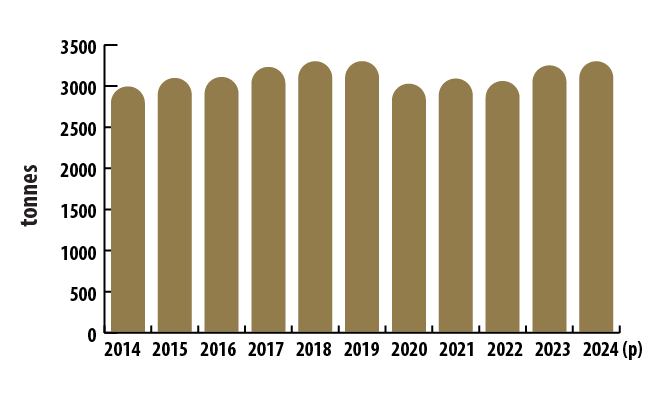
Global gold mine production was estimated at 3,300 tonnes in 2024, up 2% from 2023.
The top five gold-producing countries accounted for over 40% of the world’s annual gold output in 2024. Canada ranked fourth, with 6.1% of global mine production.
| Ranking | Country | Tonnes | Percentage of total |
|---|---|---|---|
| 1 | China | 380 | 11.5% |
| 2 | Russia | 310 | 9.4% |
| 3 | Australia | 290 | 8.8% |
| 4 | Canada | 200 | 6.1% |
| 5 | United States | 160 | 4.8% |
| - | Other countries | 1,960 | 59.4% |
| World total | 3,300 | 100.0% |
World gold mine production, 2015–2024 (p)
Text version
This bar graph illustrates global annual gold mine production from 2015 to 2024. Production totalled 3,097 tonnes in 2015 and gradually increased to 3,301 tonnes by 2019. It then declined to 3,027 tonnes in 2020 before rising to 3,090 tonnes in 2021. After a slight dip to 3,060 tonnes in 2022, production increased to 3,250 tonnes in 2023 and reached 3,300 tonnes in 2024.
World reserves
Gold mineral ore reserve estimations are based on ore that can be considered reasonably, economically, and technically extractable at the time of estimation. According to the U.S. Geological Survey, world reserves of gold ore were estimated at 64,000 tonnes in 2024.
| Ranking | Country | Tonnes (thousands) |
|---|---|---|
| 1 | Australia | 12.0 |
| 2 | Russia | 12.0 |
| 3 | South Africa | 5.0 |
| 4 | Indonesia | 3.6 |
| 5 | Canada | 3.2 |
| 6 | China | 3.1 |
| 7 | United States | 3.0 |
| 8 | Peru | 2.5 |
| - | Other countries | 19.6 |
| Total | 64.0 |
 Trade
Trade
Exports
- In 2024, the value of Canadian gold exports reached a record $40.2 billion, up 33% from $30.2 billion in 2023. The surge was driven by higher gold prices and strong demand from central banks seeking to diversify reserves and hedge against inflation and geopolitical uncertainty. The market outlook suggests that if interest rates decline, gold demand could strengthen further as lower rates reduce the opportunity cost of holding non-yielding assets such as gold compared with interest-bearing investments such as bonds.
- The United Kingdom was Canada’s largest gold export destination in 2024, accounting for $21.8 billion, or 54% of total exports. The United Kingdom is a major importer of gold because of its role as a global financial hub for gold trade, where international investors purchase and sell gold via the London Bullion Market Association.
- The United States ranked second, with $9.2 billion (23%) in gold exports in 2024, followed by Switzerland with $5.2 billion (13%).
- Most of Canada’s gold exports are in the form of unwrought gold. In 2024, these exports rose to 380 tonnes valued at $39.1 billion, up from 339 tonnes worth $27.7 billion in 2023.
Imports
- In 2024, the value of gold imports in Canada was $19.5 billion, up from $17.7 billion in 2023.
- Canada imported 350 tonnes of unwrought gold in 2024, valued at $19.2 billion, compared to 388 tonnes in 2023, valued at $17.5 billion.
 Prices
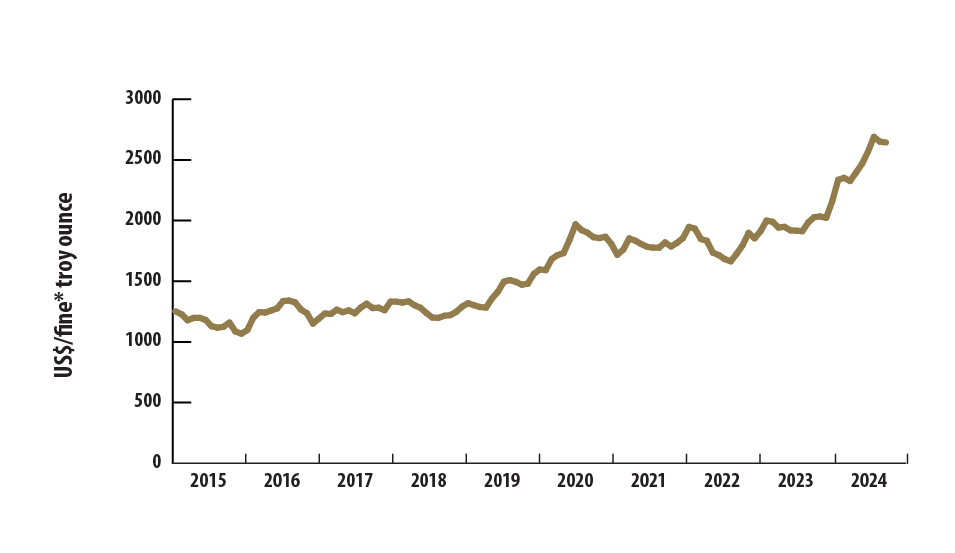
Gold prices have experienced considerable fluctuations over the past decade, ranging from as low as US$1,068 per troy ounce in December 2015 to a peak of US$2,690 per troy ounce in December 2024.
This increase was driven by strong demand from central banks and investors seeking to diversify reserves and hedge against inflation and economic uncertainty, a trend that began during the COVID-19 pandemic.
Gold prices, monthly average, 2015–2024
(US$/troy ounceFootnote *)
Text version
This line graph illustrates the monthly average gold price in United States dollars per troy ounce from 2015 to 2024. Prices fell to a low of US$1,068 in December 2015 before rising steadily from early 2016 through mid-2019. Gold prices then accelerated, reaching a new peak of US$1,968 in August 2020. After a slight decline, prices fluctuated but remained relatively stable around US$1,800 in 2022, before averaging US$1,942 in 2023. In 2024, gold prices climbed further, averaging US$2,387 per troy ounce and peaking at US$2,690 in October.
 Recycling
Gold is continually being recycled, often in the form of old jewellery that is melted down for reuse. A major motivation for consumers to sell or hold on to their gold jewellery is the price of gold in their respective currencies.
When gold prices rise, it usually increases the supply that is available for scrap (recycled gold). The recycled gold supply was 1,370 tonnes in 2024, an 11% increase from 2023.
Recovering gold from end-of-life electronics is an additional and major contributor to the global scrap supply.
Notes and sources
(p) preliminary
Totals may be different because of rounding.
All dollars are Canadian unless otherwise indicated.
Uses
- Gold uses, 2015–2024 (p)
- World Gold Council
- Gold demand, 2024 (p)
- World Gold Council
Production
- Canadian gold production, by region, 2024 (p)
- Statistics Canada
- Suppression of confidential data by Statistics Canada renders production numbers for some provinces unavailable.
- Canadian gold production, 2015–2024 (p)
- Natural Resources Canada; Statistics Canada
International context
- World gold mine production, by country, 2024 (p)
- Natural Resources Canada; Statistics Canada (Canadian Statistics)
- U.S. Geological Surveys
- World gold mine production, 2015–2024 (p)
- Natural Resources Canada; Statistics Canada (Canadian Statistics)
- U.S. Geological Surveys
- World reserves of gold, by country, 2024 (p)
- U.S. Geological Surveys
Trade
- Imports and exports of Canadian gold, 2024 (p)
- Natural Resources Canada; Statistics Canada
- Mineral trade includes ores, concentrates, and semi- and final-fabricated mineral products.
Prices
- Gold prices, monthly average, 2015–2024
- The London Bullion Market Association (PM Fix)
Recycling
- Recycled Gold Supply, 2024
- Metals Focus
- World Gold Council