

Zinc is one of the world’s most widely used metals, valued for its corrosion resistance, particularly in the protection and manufacturing of steel products.
Key facts
- The primary use of zinc is in the galvanizing process, which protects iron and steel from rusting.
- Most zinc in Canada is produced from mines in Ontario and Manitoba, but it is also mined as a co-product in Quebec and Yukon. Canada refines zinc at processing facilities in British Columbia and Quebec.
- World mine production of zinc was approximately 12.0 million tonnes in 2024.
Learn more about zinc
 Uses
Uses
The primary use of zinc is in the galvanizing process, which protects iron and steel from rusting. Zinc can also be alloyed with other metals and used for die-casting into shapes such as door handles, alloyed with copper to make brass, and alloyed with copper and tin to make bronze.
Brass fittings made with zinc are used across Canada in plumbing and heat exchange equipment.
Zinc can also be added to fertilizers to increase crop yields, made into zinc oxide (an ingredient in skin cream), and used in tire manufacturing.
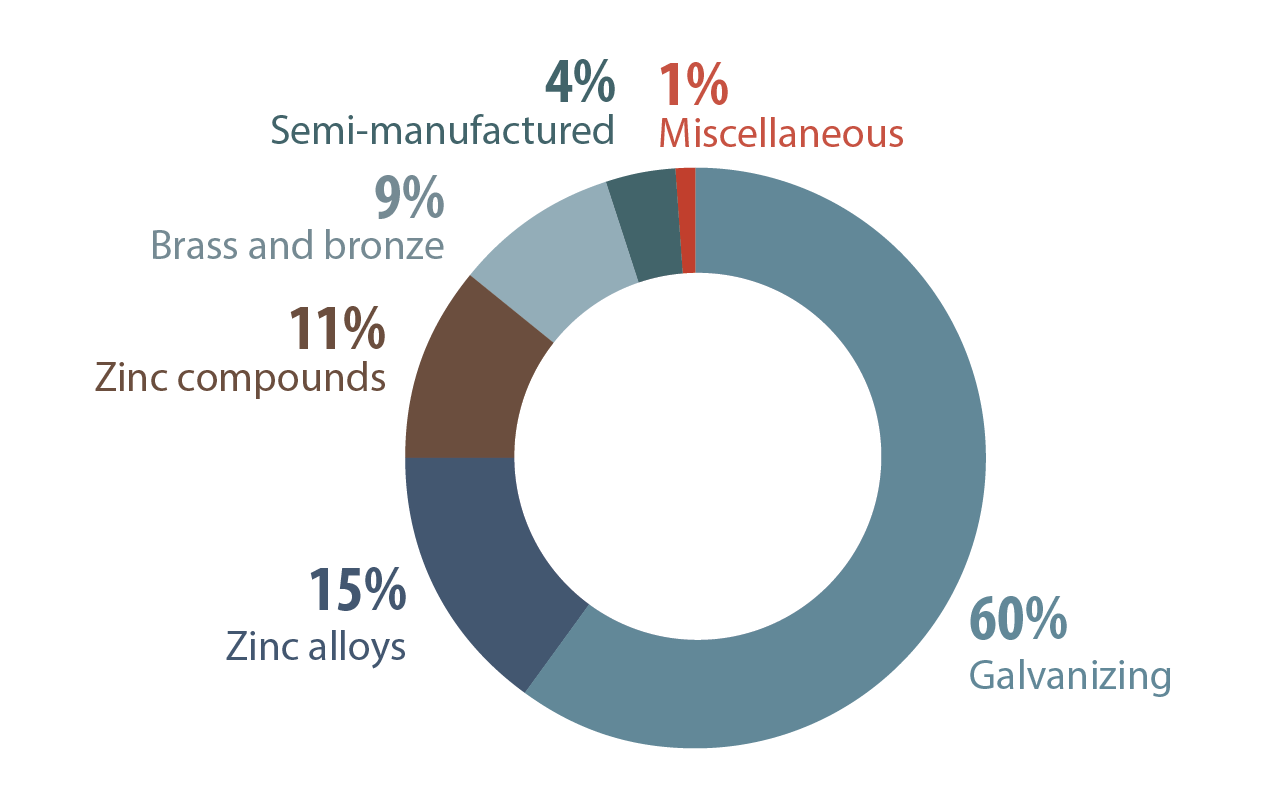
Zinc, global uses, 2024
Text version
This pie chart shows the major global uses of zinc in 2024. The largest use is for galvanizing (60%), followed by zinc alloy production (15%), zinc compounds (11%), brass and bronze (9%), semi-manufactured products (4%), and other miscellaneous products (1%).
 Production
In 2024, mined zinc production in Canada increased 18% to 129,202 tonnes from 109,507 tonnes in 2023. Canadian mined zinc production has been generally decreasing over the past decade.
Data for Canada’s refined zinc metal production is unavailable after 2022 for confidentiality reasons but is estimated to be between 516,000 and 526,000 tonnes per year. Zinc metal is produced at refineries in British Columbia and Quebec. Refined zinc production is higher compared to mined production since concentrates are imported for processing, notably from Alaska to British Columbia.
Germanium and indium are also recovered as by-products from zinc refining in Canada.
Consult a map of producing Canadian mines
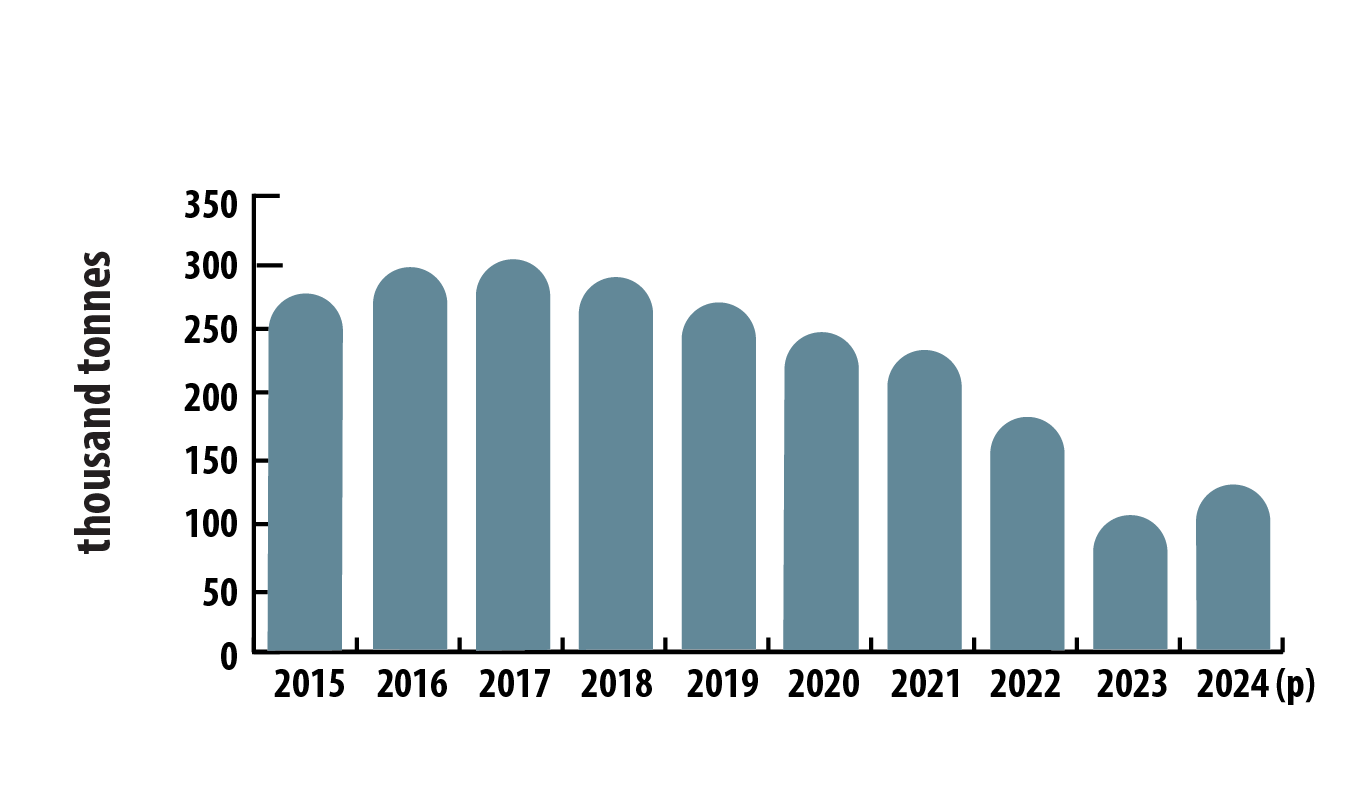
Canadian mine production of zinc, 2015–2024 (p)
Text version
This bar graph shows Canada’s annual mine production of zinc from 2015 to 2024. Production was 275,410 tonnes in 2015 and increased slightly to 301,210 tonnes in 2016 and 305,314 tonnes in 2017. Output then declined steadily, reaching a decade low of 109,507 tonnes in 2023, before rising slightly to 129,202 tonnes in 2024.
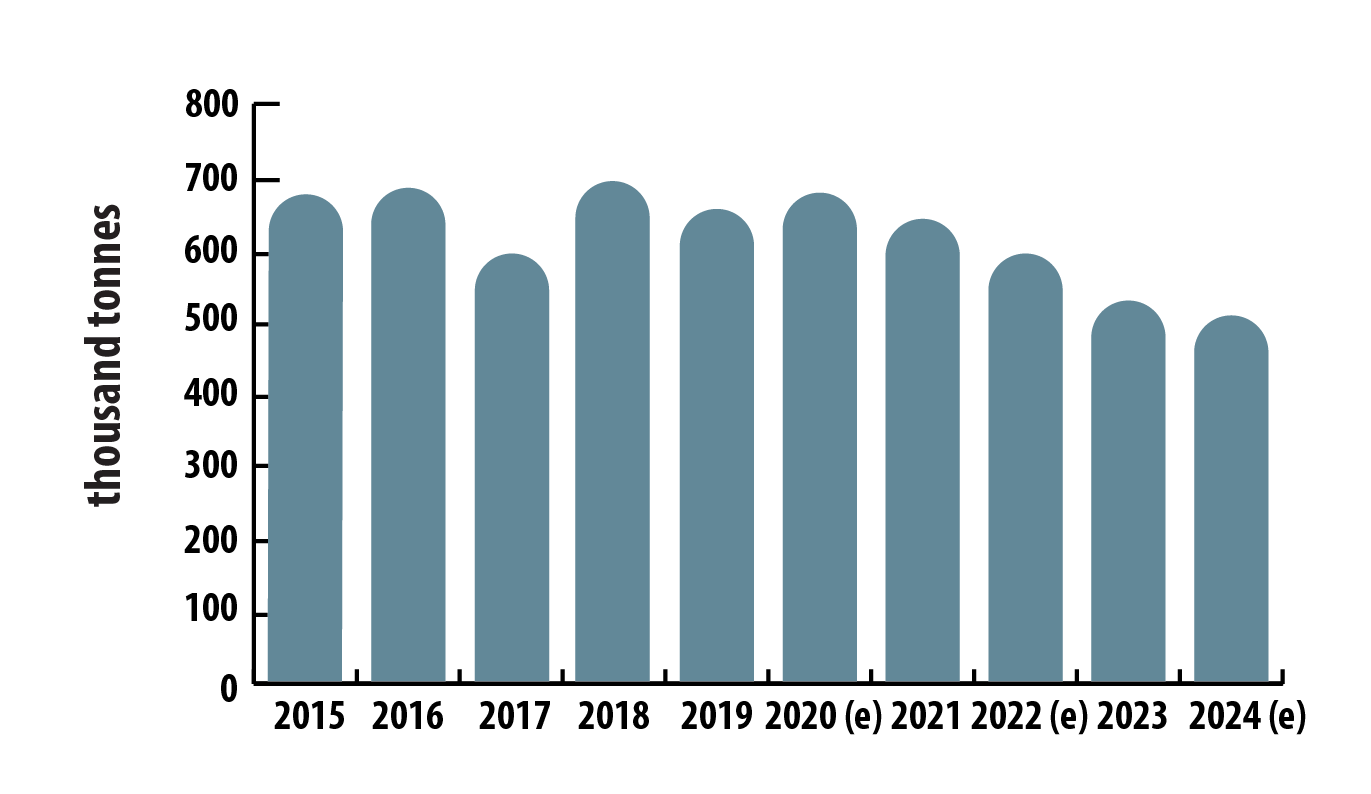
Canadian production of refined zinc, 2015–2024
Text version
This bar graph shows Canada’s refined zinc production from 2015 to 2024. Production was 683,118 tonnes in 2015 and increased slightly to 691,389 tonnes in 2016. In 2017, production declined sharply to a decade low of 598,438 tonnes before rebounding to a decade high of 696,591 tonnes in 2018. Production then decreased to 654,971 tonnes in 2019 but rose to an estimated 680,245 tonnes in 2020. In the following years, production steadily declined to 640,718 tonnes in 2021, 599,900 tonnes in 2022, 531,600 tonnes in 2023, and 521,000 tonnes in 2024.
 International context
World mine production of zinc totalled 12.0 million tonnes in 2024, a 1% decrease from the previous year. China was the largest producer, accounting for 4.0 million tonnes, or 33% of global output. Canada produced about 1% of the world’s mined zinc in 2024.
| Ranking | Country | Thousand tonnes | Percentage of total |
|---|---|---|---|
| 1 | China | 4,000 | 33.3% |
| 2 | Peru | 1,300 | 10.8% |
| 3 | Australia | 1,100 | 9.2% |
| 4 | India | 860 | 7.2% |
| 5 | United States | 750 | 6.3% |
| 6 | Mexico | 700 | 5.8% |
| 7 | Bolivia | 510 | 4.3% |
| 8 | Kazakhstan | 370 | 3.1% |
| 9 | Russia | 310 | 2.5% |
| 10 | Sweden | 240 | 2.0% |
| Other countries | 1,700 | 14.2% | |
| World total (rounded) | 12,000 | 100.0% |
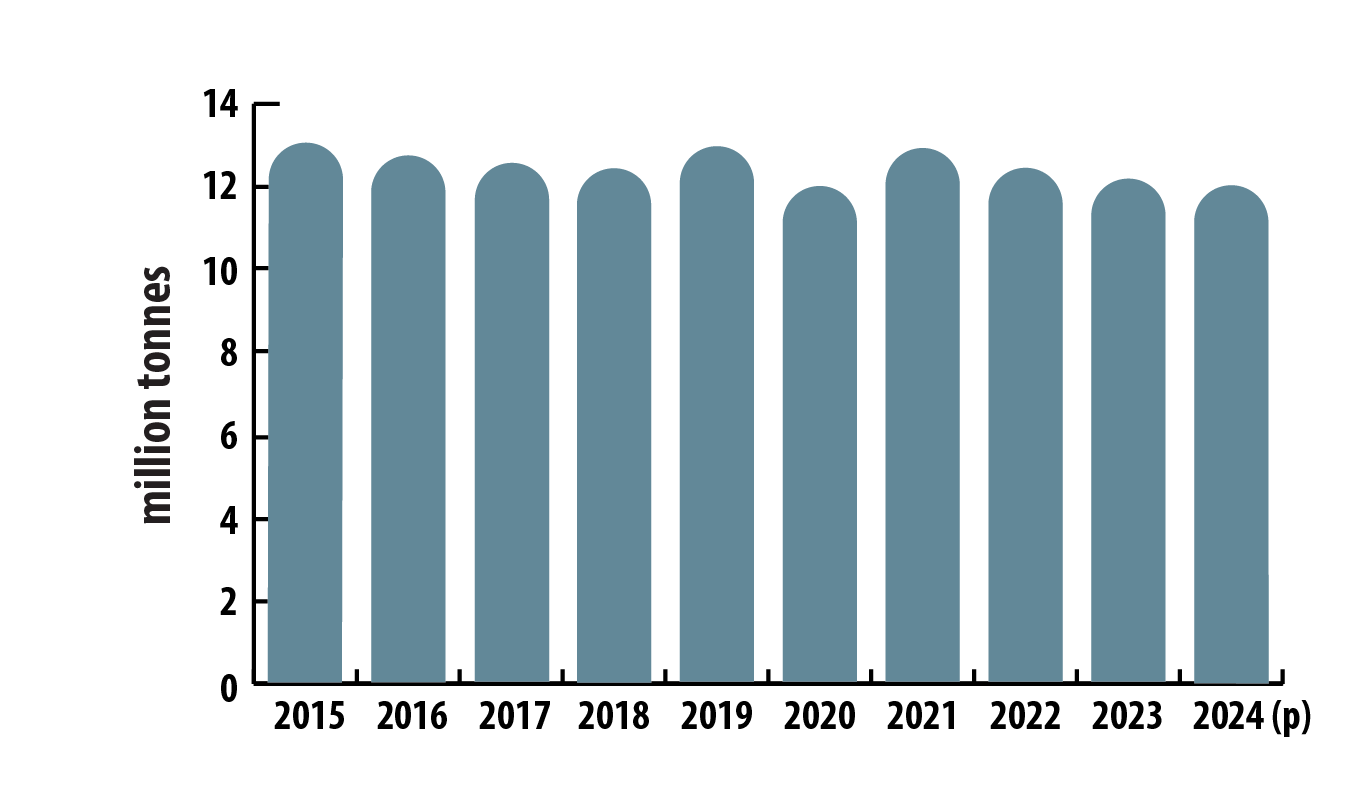
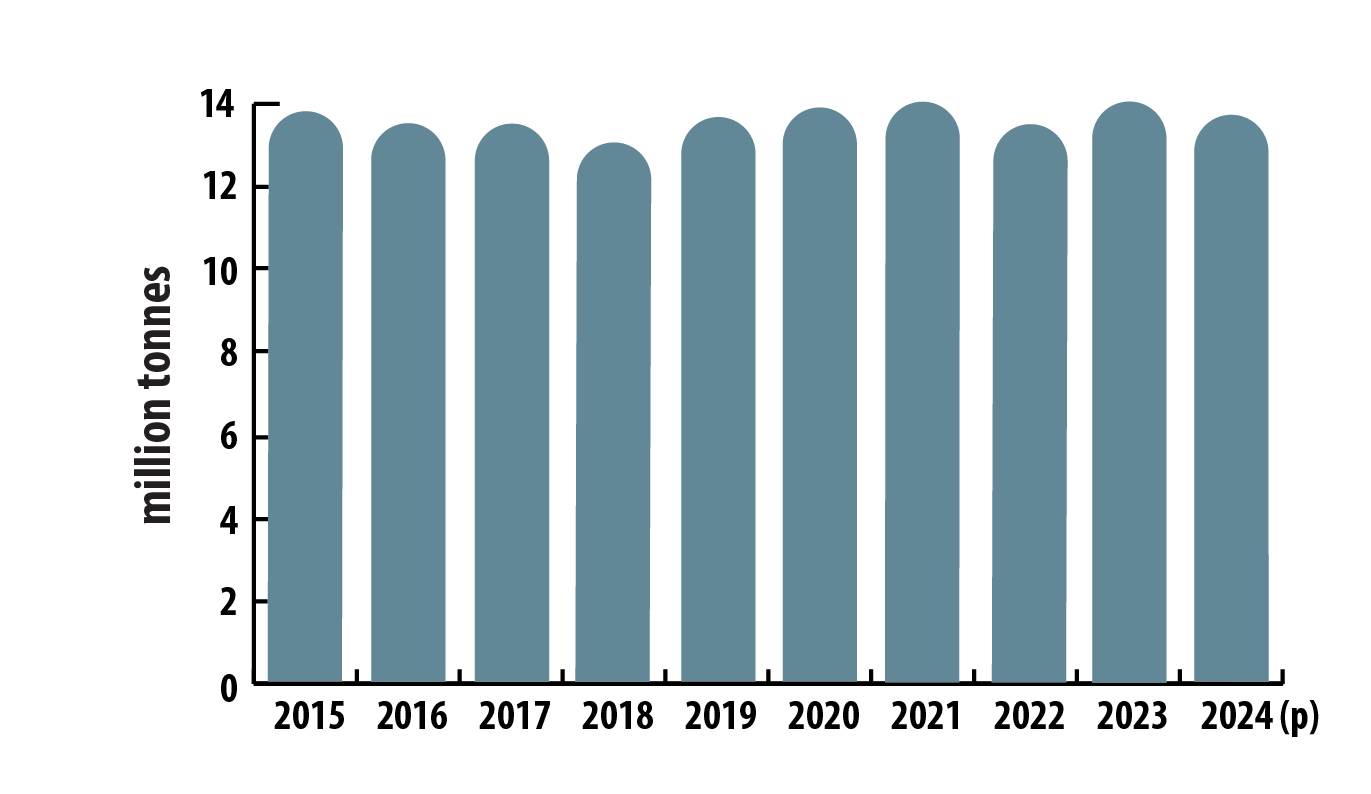
World mine production of zinc, 2015-2024 (p)
Text version
This bar graph shows the world’s annual mine production of zinc from 2015 to 2024. Production was 12.8 million tonnes in 2015 and decreased annually until it reached 12.5 million tonnes in 2018. Production increased slightly to 12.6 million tonnes in 2019, before decreasing to a decade low of 12.1 million tonnes in 2020. Production then rebounded to 13.0 million tonnes in 2022, before declining again to 12.1 million tonnes in 2023 and 12.0 million tonnes in 2024.
Global production of refined zinc was estimated at 13.7 million tonnes in 2024, a 2% decrease from 2023. While data for Canada was not available for 2023 or 2024, Canada accounted for 4.5% of global production in 2022.
World production of refined zinc, 2015–2024 (p)
Text version
This bar graph shows the world’s annual production of refined zinc from 2015 to 2024. Production was 13.8 million tonnes in 2015 and declined each year between 2016 and 2018 to 13.1 million tonnes. It then rose to a decade high of 14.1 million tonnes in 2021. Production decreased to 13.5 million tonnes in 2022, rebounded to 13.9 million tonnes in 2023, and edged down again to 13.7 million tonnes in 2024.
World zinc reserves
The world’s zinc reserves were estimated at approximately 230 million tonnes in 2024, according to the U.S. Geological Survey. Australia, China, Russia, Peru, and Mexico were among the nations with the largest zinc reserves.
World zinc reserves, by country, 2024 (p)
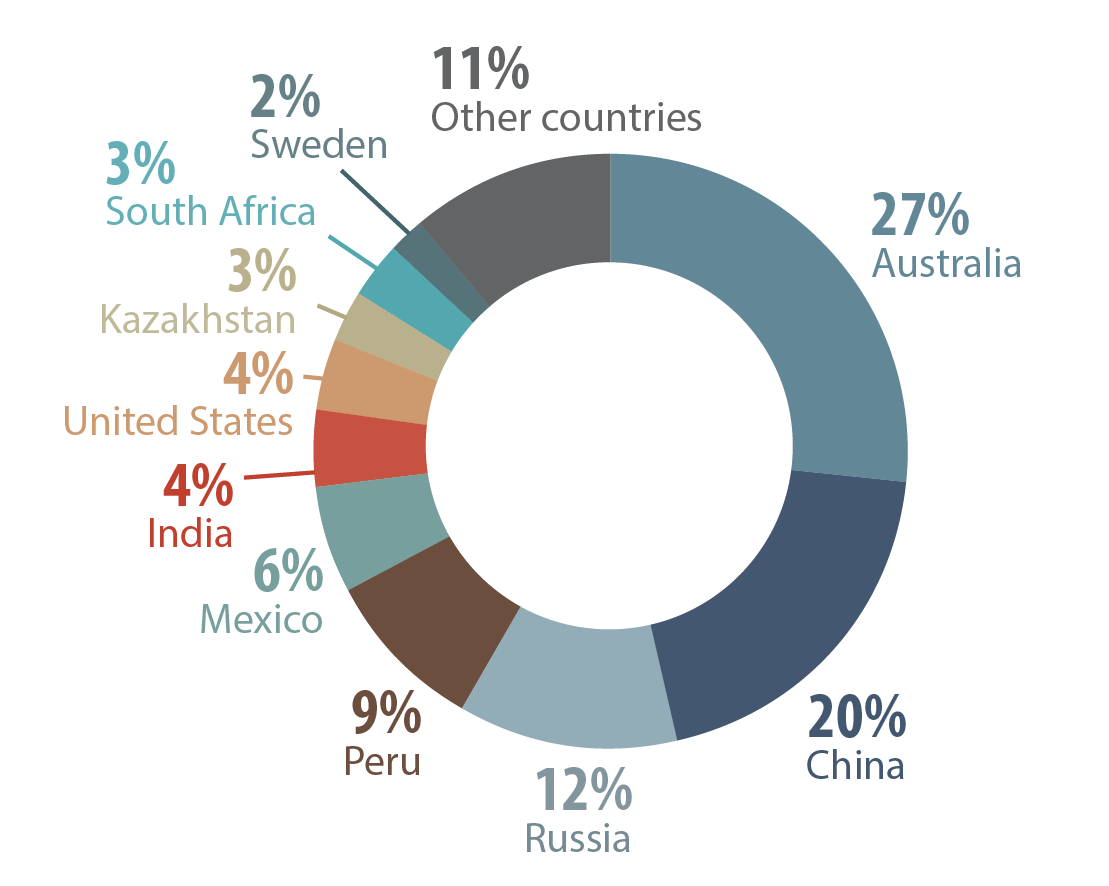
Text version
This pie chart shows the estimated world reserves of zinc in 2024, by country and in percentages. Australia had the largest share with 27%, followed by China (20%), Russia (12%), Peru (9%), Mexico (6%), India (4%), the United States (4%), Kazakhstan (3%), South Africa (3%), Sweden (2%), and Canada and other countries (11%).
 Trade
Trade
Exports
- Canadian exports of zinc and zinc products were valued at $2.0 billion in 2024.
- In 2024, Canada exported 508,943 tonnes of zinc products, including ore concentrate, zinc oxide, unwrought zinc, and zinc metal products. This represents a 9% decrease from 2023.
- The United States was the primary destination, accounting for 91% of Canada’s zinc exports, while combined exports to Switzerland, Belgium, Taiwan, and Malaysia represented 7%.
Imports
- In 2024, Canada imported $1.3 billion worth of zinc products.
- Canadian smelters imported 460,132 tonnes of zinc concentrates in 2024, a 20% decrease from 2023.
- Zinc concentrates accounted for 83% of the value of Canada’s zinc imports.
- The United States was the leading source of zinc concentrates (52%), followed by Australia (17%), Peru (14%), Mexico (7%), and Bolivia (4%).
 Prices
Average monthly zinc prices rose from US$2,777 per tonne in January 2024 to US$3,106 per tonne in April. Prices then declined to an annual low of US$2,622 per tonne in October and remained relatively stable for the rest of the year, ending at US$2,655 per tonne in December. Overall, the average annual price increased 6% compared with 2023.
Zinc, average monthly prices, 2015–2024
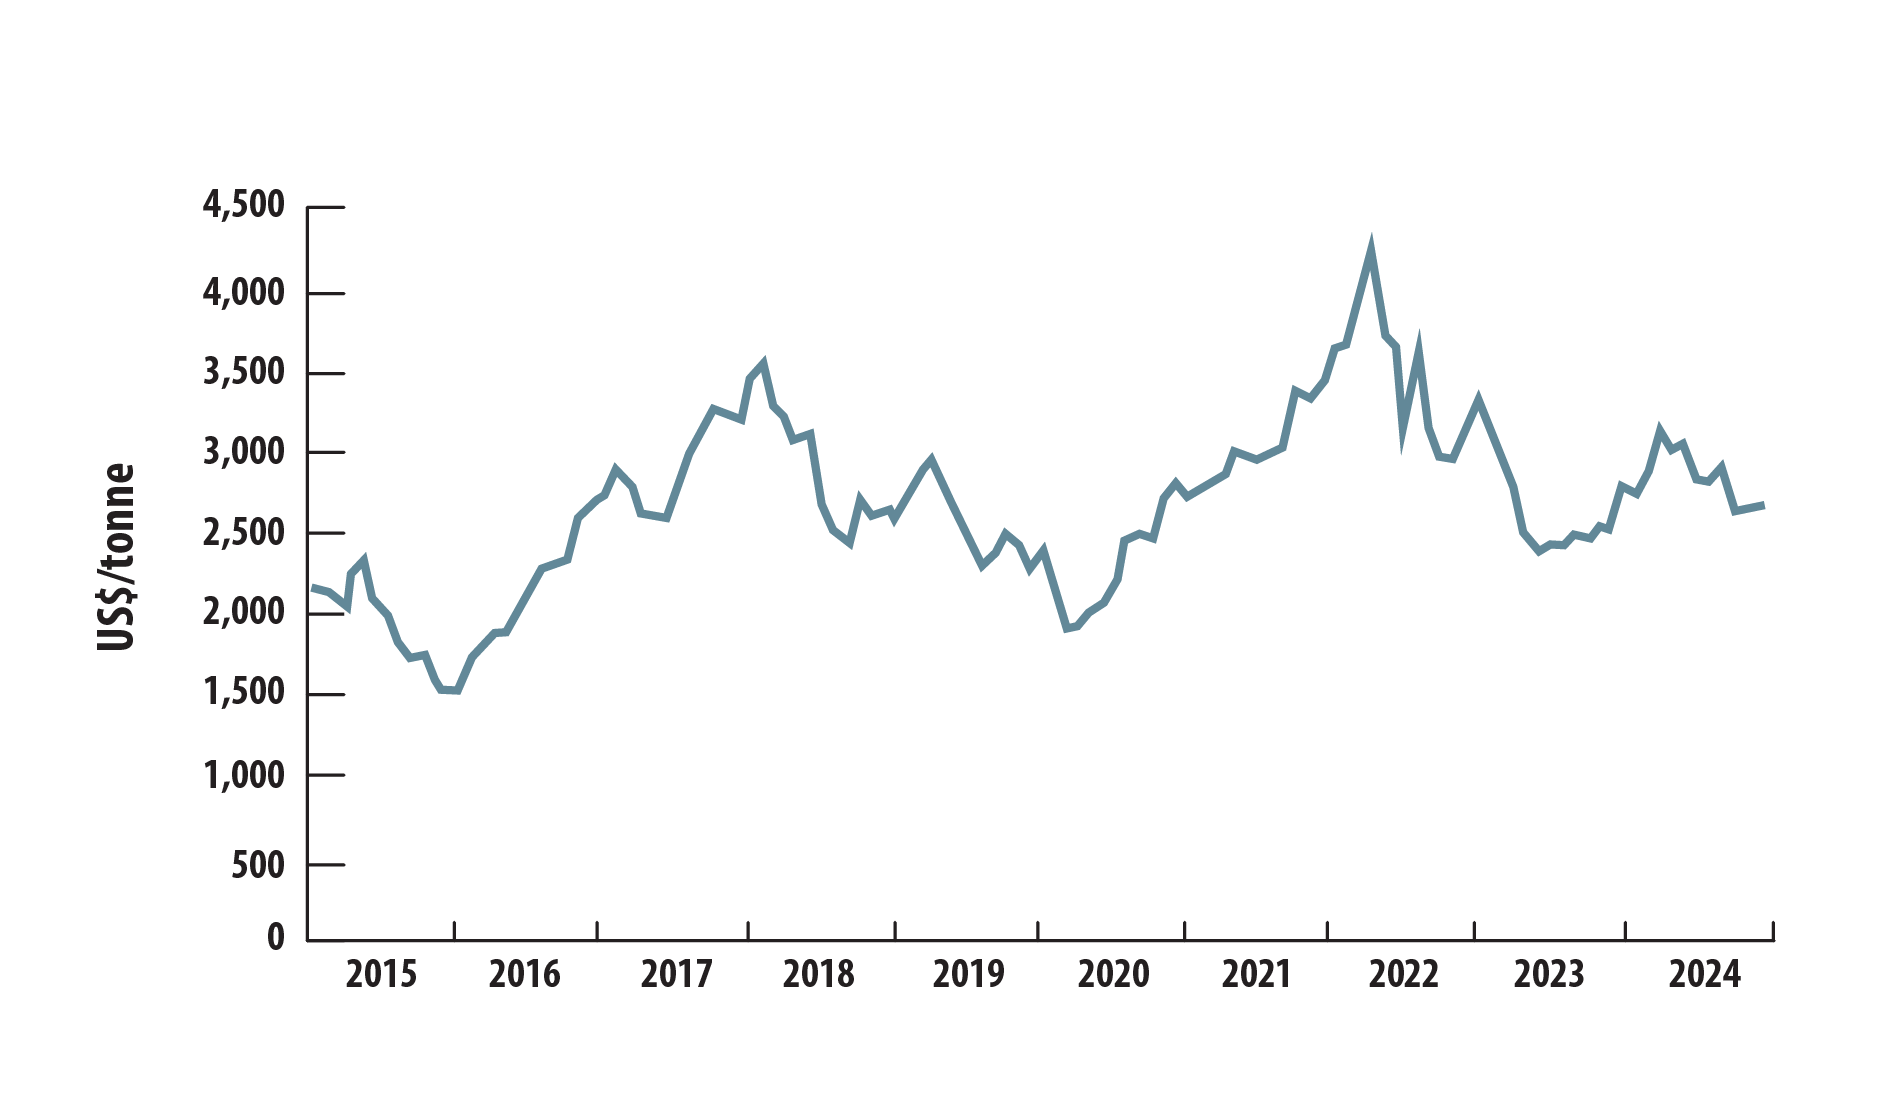
Text version
This line graph shows the monthly average zinc price in United States dollars per tonne from 2015 to 2024. The average annual price in 2015 was US$1,932 per tonne. In January 2016, prices reached a decade low of US$1,520 per tonne before rising to US$3,533 in February 2018. They then trended downward to US$1,903 in April 2020, followed by a steady increase to a decade high of US$4,360 in April 2022.
Prices subsequently declined to US$3,129 by December 2022 and to US$2,502 in December 2023. In 2024, prices climbed to a high of US$3,106 in April before falling to US$2,655 by December.
Despite these fluctuations, average annual zinc prices show an overall upward trend—from US$1,932 per tonne in 2015 to US$2,825 in 2024, a 46% increase. The monthly average prices for 2024 were US$2,777 (January), US$2,714 (February), US$2,837 (March), US$3,106 (April), US$3,004 (May), US$3,034 (June), US$2,819 (July), US$2,800 (August), US$2,889 (September), US$2,622 (October), US$2,644 (November), and US$2,655 (December).
 Recycling
Zinc is 100% recyclable without any loss of its chemical or physical properties. Each year, about 20 million tonnes of zinc enter first use, of which 39% comes from recycled sources. Key sources of recycled zinc include scrap galvanized steel and zinc from batteries. Products such as galvanized steel have a long service life, which influences the volume of recyclable material available to the market in any given year.
Notes and sources
(p) preliminary
Totals may be different because of rounding.
All dollars are Canadian unless otherwise indicated.
Uses
- The World Zinc Factbook 2024
- International Lead and Zinc Study Group
Production
- Annual reports from Teck Resources Limited and Glencore Canada
- Canadian mine production of zinc, 2015–2024
- Natural Resources Canada
- Canadian production of refined zinc, 2015–2024
- Statistics Canada, Table 16-10-0019-01
- Data for January 2020 and July 2022 to December 2024 were suppressed by Statistics Canada to meet the confidentiality requirements of the Statistics Act.
- Refined zinc production in January 2020 is estimated based on the average of reported monthly production from February 2020 to January 2021. Similarly, production for July to December 2020 is estimated based on the average of reported monthly production from July 2021 to June 2022.
- Data for 2023 and 2024 are estimated based on company reports.
- Statistics Canada, Table 16-10-0019-01
International context
- World mine production of zinc, by country, 2024 (p)
- U.S. Geological Survey
- Natural Resources Canada; Statistics Canada (Canadian Statistics)
- World mine production of zinc, 2015–2024 (p)
- U.S. Geological Survey
- Natural Resources Canada; Statistics Canada (Canadian Statistics)
- World production of refined zinc, 2015–2024 (p)
- U.S. Geological Survey
- Natural Resources Canada; Statistics Canada
- World zinc reserves, by country, 2024 (p)
- U.S. Geological Survey
Trade
- Imports and exports of Canadian zinc, 2024 (p)
- Natural Resources Canada; Statistics Canada
- Mineral trade includes ores, concentrates, and semi- and final-fabricated mineral products.
Prices
- Zinc, average monthly prices, 2015–2024
- World Bank Commodities
Recycling
- International Zinc Association