

Potash refers to a group of minerals and chemicals that contain potassium (chemical symbol K), a vital nutrient for plants and a key component in fertilizers.
It is produced primarily as potassium chloride (KCl), also known as muriate of potash (MOP). Because of variations in potassium content among deposits, potash often measured and reported in terms of potassium oxide (K2O) equivalence for consistency.
Key facts
- Potash is primarily used to produce fertilizer.
- Canada is the world’s largest producer and exporter of potash.
- Canada has the world’s largest potash reserves, with 1.1 billion tonnes of potash (potassium oxide equivalent).
Learn more about potash
 Uses
Uses
Potash is used primarily in fertilizers (about 95%) to support plant growth, increase crop yield and disease resistance, and enhance water preservation. Small quantities are used in manufacturing potassium-bearing chemicals such as:
- detergents
- ceramics
- pharmaceuticals
- water conditioners
- alternatives to de-icing salt
Potassium is an essential element of the human diet, required for the growth and maintenance of tissues, muscles, and organs and for the electrical activity of the heart. There is no substitute for potassium as a vital nutrient for plants, animals and humans.
 Production
Potash is mined in Canada by conventional underground mining methods or by injecting water underground and extracting the resulting brine (solution mining).
Canada’s 10 active mines are in Saskatchewan, and in 2024, they produced an estimated 25 million tonnes of MOP, an increase of about 2.1 million tonnes from the previous year.
Four companies account for all potash production in Canada: Nutrien Ltd., The Mosaic Company, Compass Minerals, and German fertilizer producer K+S Potash Canada.
BHP is advancing stages 1 and 2 of the Jansen potash project in Saskatchewan. The first stage is expected to start production in 2027 and is projected to yield about 4.2 million tonnes of potash annually. The second stage is anticipated to start production in 2031 and double the capacity of the mine to reach 8.5 million tonnes a year when fully operational.
Consult a map of producing Canadian mines
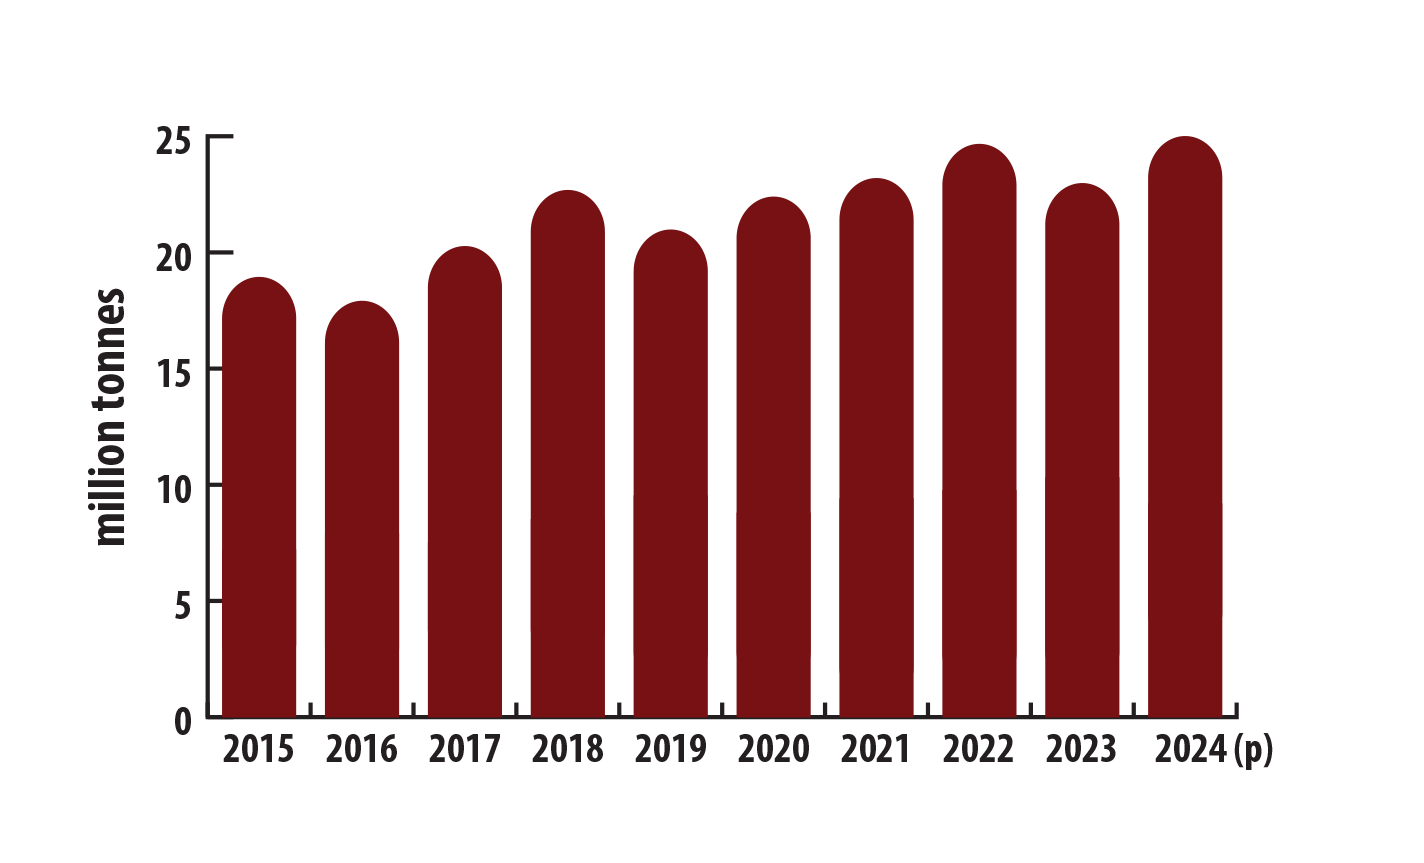
Canadian production of potash (potassium chloride), 2015–2024 (p)
Text version
This bar chart illustrates Canada’s annual potash mine production from 2015 to 2024. Production was 18.8 million tonnes in 2015, decreased slightly to 17.9 million tonnes in 2016, and then rose to 22.7 million tonnes by 2018. After falling to 20.9 million tonnes in 2019, production increased steadily to a peak of 24.5 million tonnes in 2022 before declining to 22.9 million tonnes in 2023. Preliminary data for 2024 indicate a 9.1% year-over-year increase to 25 million tonnes.
 International context
Find out more about potash production on an international scale.
| Ranking | Country | Tonnes (thousands) | Percentage of total |
|---|---|---|---|
| 1 | Canada | 24,962 | 32.8% |
| 2 | Russia | 16,600 | 21.8% |
| 3 | Belarus | 12,100 | 15.9% |
| 4 | China | 6,508 | 8.6% |
| 5 | Israel | 3,707 | 4.9% |
| - | Other countries | 12,199 | 16.0% |
| Total | 76,076 | 100.0% |
Global potash production was estimated at 76.1 million tonnes in 2024. Canada remained the world’s largest producer, contributing 32.8% of the global supply.
Canada, Russia and Belarus typically dominate global potash production, together accounting for 70.5% in 2024. After a decline in 2022, production rebounded in 2023 and 2024, with both Canada and Russia reaching record highs, while Belarusian output recovered near to its 2021 peak.
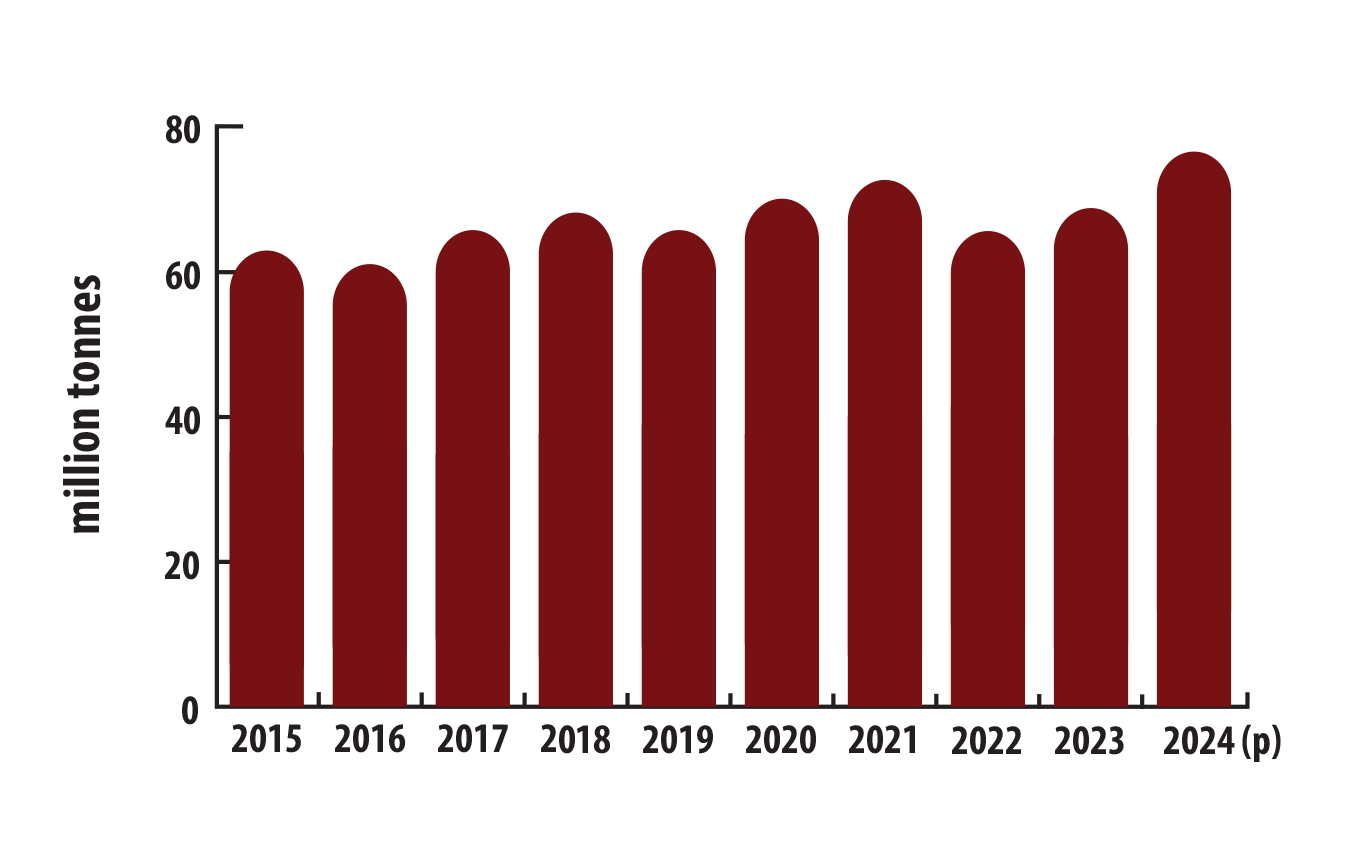
World production of potash (potassium chloride), 2015–2024 (p)
Text version
This bar chart illustrates global potash production from 2015 to 2024. Production was about 62.3 million tonnes in 2015 and rose to 71.9 million tonnes by 2021. It then declined to 64.6 million tonnes in 2022 before rebounding to 68.1 million tonnes in 2023 and reaching 76.1 million tonnes in 2024.
In 2024, global potash reserves were estimated at more than 4.8 billion tonnes (potassium oxide equivalent). Canada holds the largest share, with known reserves of 1.1 billion tonnes. The following table lists countries with the largest potash reserves globally.
| Ranking | Country | Recoverable ore (million tonnes) |
Potassium oxide equivalent (million tonnes) |
|---|---|---|---|
| 1 | Canada | 4,500 | 1,100 |
| 2 | Laos | N/A | 1,000 |
| 3 | Russia | N/A | 920 |
| 4 | Belarus | 3,300 | 750 |
| 5 | United States | 970 | 220 |
| 6 | China | N/A | 180 |
| - | Other countries | >1,500 | >630 |
| Total | >10,000 | >4,800 |
 Trade
Trade
Canada leads the world in potash exports, shipping about 22.9 million tonnes in 2024, which accounts for over 39% of global exports. The leading destinations of Canadian exports of potash were the United States (53%), Brazil (14%) and China (6%).
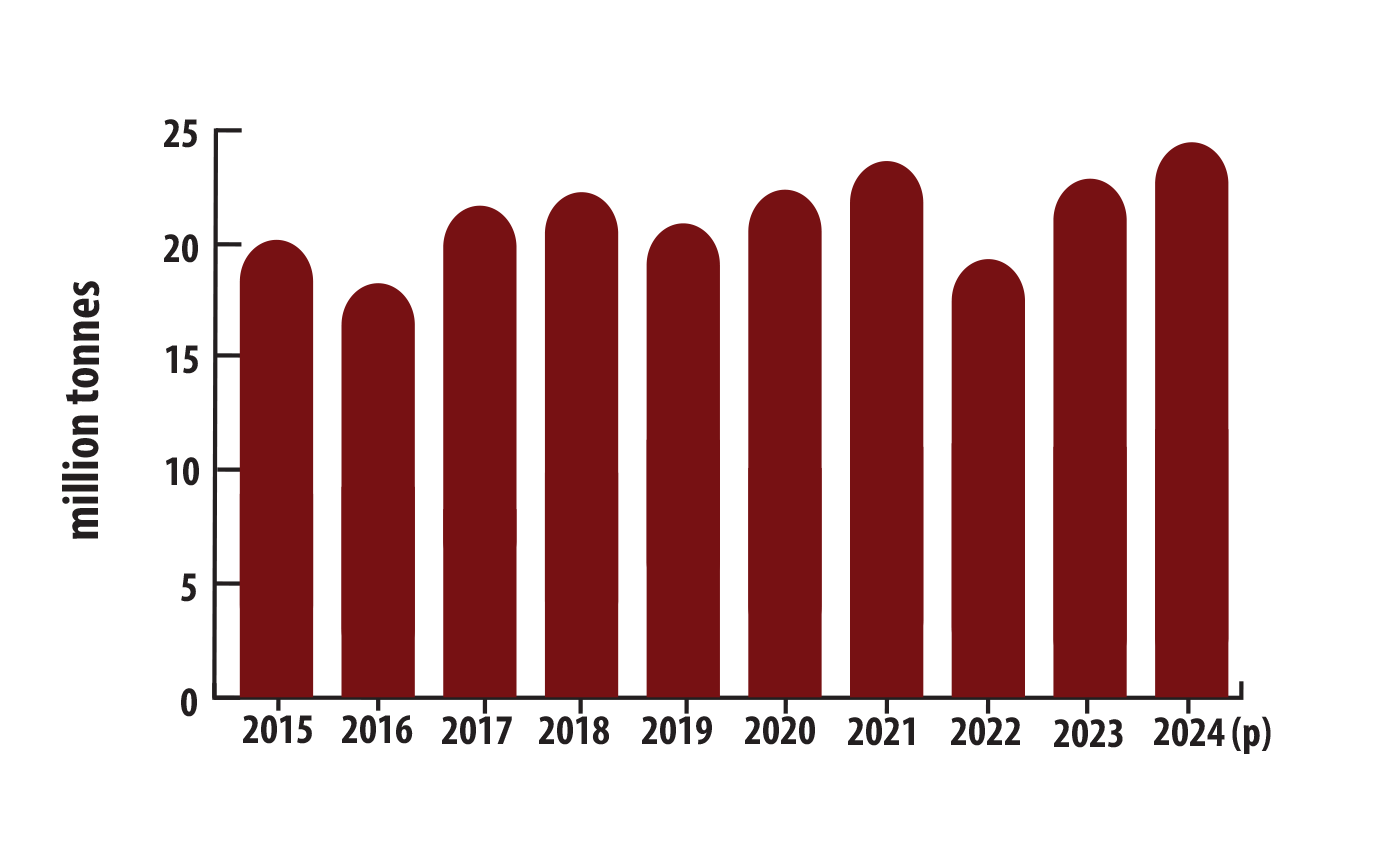
Canadian exports of potash (potassium chloride), 2015–2024 (p)
Text version
This bar chart illustrates Canadian potash exports from 2015 to 2024. Exports were 17.9 million tonnes in 2015, declining to 16.0 million tonnes in 2016 before rising to a decade high of 21.9 million tonnes in 2018. After falling to 19.6 million tonnes in 2019, exports stabilized around 21.5 million tonnes in the following years, then increased to a record 22.9 million tonnes in 2024.
In 2024, Canada, Belarus and Russia accounted for almost 77% of global potash exports.
| Ranking | Country | Tonnes (thousands) | Percentage of total |
|---|---|---|---|
| 1 | Canada | 22,916 | 38.7% |
| 2 | Russia | 11,590 | 19.6% |
| 3 | Belarus | 11,074 | 18.7% |
| 4 | Israel | 3,411 | 5.8% |
| 5 | Germany | 3,225 | 5.5% |
| - | Other countries | 6,964 | 11.8% |
| Total | 59,210 | 100% |
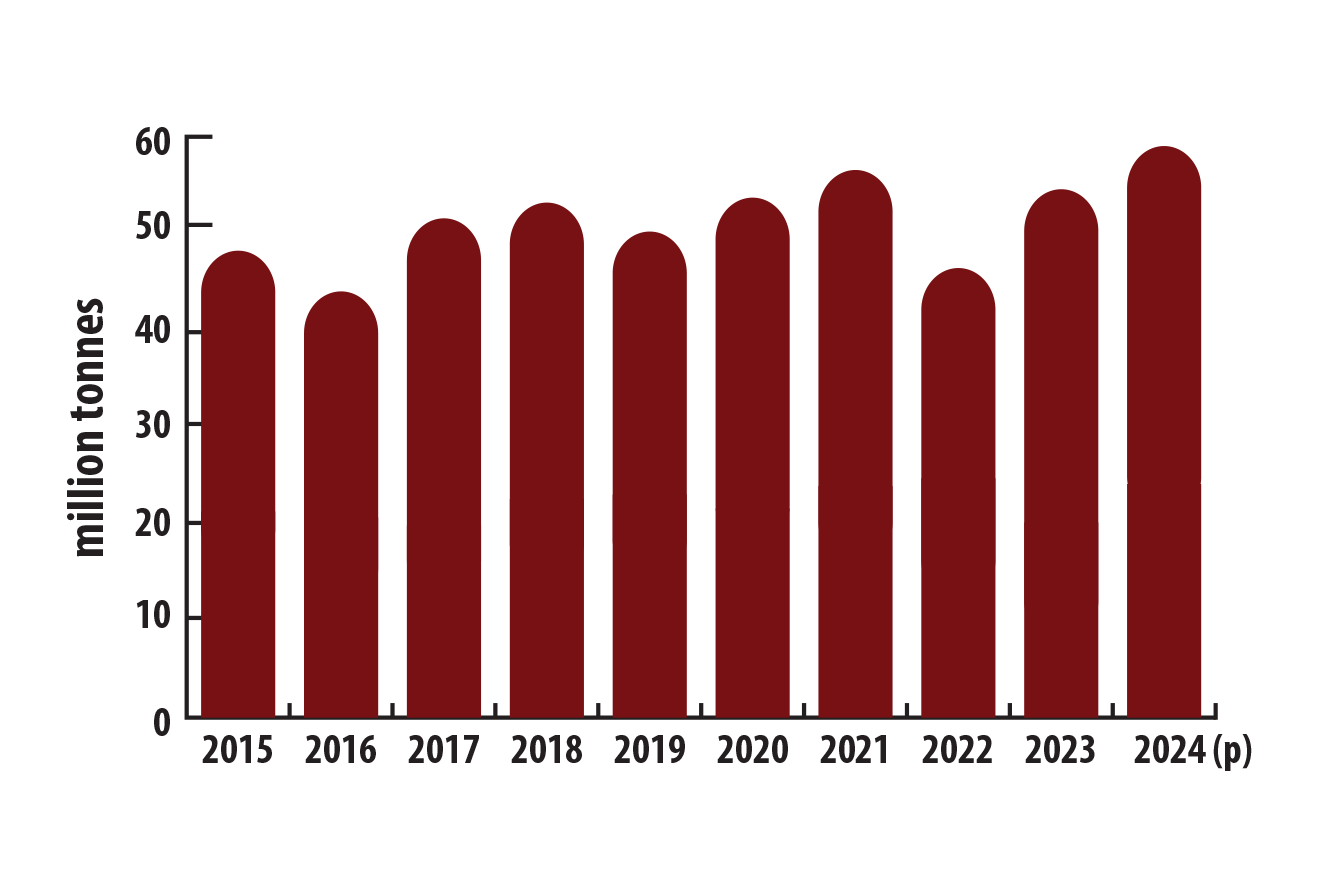
World exports of potash (potassium chloride), 2015–2024 (p)
Text version
This bar chart illustrates global potash exports from 2015 to 2024. Exports were about 48.3 million tonnes in 2015, declining to 44.1 million tonnes in 2016 before rebounding to a peak of nearly 56.3 million tonnes in 2021. In 2022, exports fell sharply by about 10 million tonnes because of geopolitical events, including the Russian invasion of Ukraine. By 2024, global potash exports had nearly recovered, reaching 59.2 million tonnes.
 Prices
Potash prices continued to trend downward through 2024, reaching US$278 per tonne in October. By June 2023, they had already fallen to US$328 per tonne as supply concerns eased.
Prices had moderated in the latter half of 2022 but remained above historical averages after peaking at US$1,202 per tonne in April, driven by geopolitical tensions and the Russian invasion of Ukraine. In 2021, strong global demand had pushed prices up sharply to US$807 per tonne. Before that, potash prices had been relatively low through 2020, following a decline from 2013 to 2016.
Potassium chloride prices, MOP prices, 2015–2024
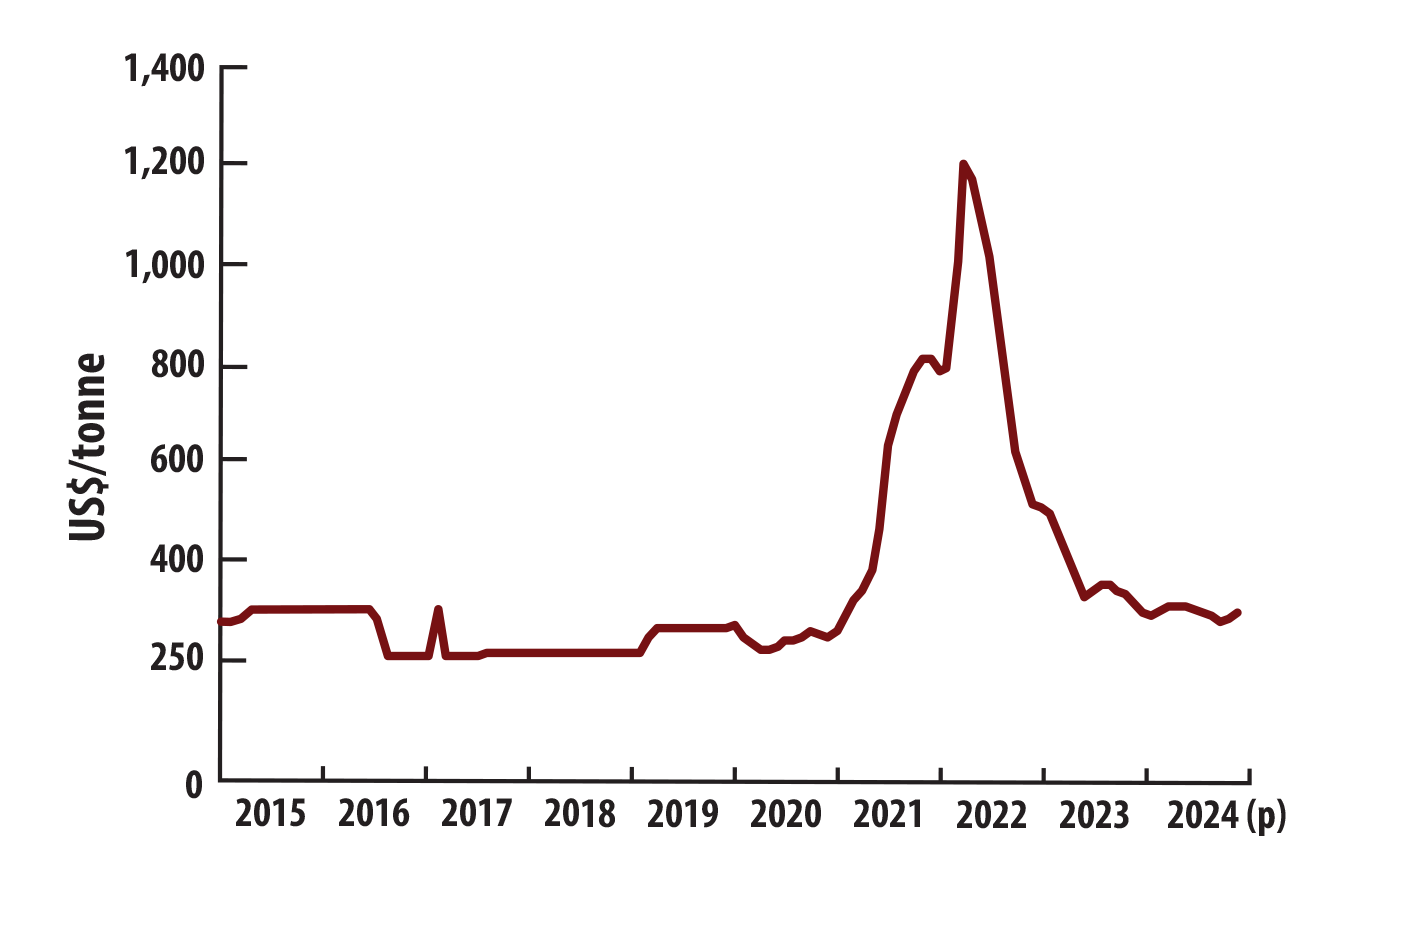
Text version
This line chart illustrates monthly potassium chloride prices in United States dollars per tonne from 2015 to 2024. In 2015, prices averaged US$296 per tonne and remained stable before falling to a low of US$206 per tonne in late 2016. Prices then surged in late 2021, peaking at US$1,202 per tonne in April 2022, before declining sharply to US$311 per tonne by the end of 2023. In 2024, prices averaged US$295 per tonne.
Notes and sources
(p) preliminary
f.o.b. free on board
Totals may be different because of rounding.
Production
- Canadian production of potash (potassium chloride), 2015–2024 (p)
- Natural Resources Canada
International context
- World production of potash (potassium chloride), by country, 2024 (p)
- Natural Resources Canada; CRU
- World production of potash (potassium chloride), 2015–2024 (p)
- Natural Resources Canada; CRU
- World reserves of potash (potassium oxide equivalent), by country, 2024 (p)
- Mineral Commodity Summaries 2024, U.S. Geological Survey
Trade
- Canadian exports of potash (potassium chloride), 2015–2024 (p)
- Natural Resources Canada
- World exports of potash (potassium chloride), 2024 (p)
- Natural Resources Canada; CRU
- World exports of potash (potassium chloride), 2015–2024 (p)
- Natural Resources Canada; CRU
Prices
- Potassium chloride prices, MOP prices, 2015–2024
- f.o.b. Vancouver, January 2015 to December 2019
- Brazil CFR granular spot price from January 2020 onward
- The World Bank