

The platinum group metals (PGM) consist of six metallic elements that share similar physical and chemical properties and often occur together in the same mineral deposits. These metals are:
- platinum
- palladium
- rhodium
- ruthenium
- osmium
- iridium
Key facts
- Canada is a major global producer of PGMs, ranking third in palladium production and fourth in platinum production.
- In 2024, Canada’s mine production of PGMs was about 746,000 troy ounces, with about three quarters originating from mines in Ontario.
- Recycling accounts for a notable portion of the global supply of PGMs.
Learn more about platinum group metals
 Uses
Uses
PGMs are highly valued for their exceptional catalytic properties, which allow them to accelerate or initiate chemical reactions without being consumed in the process.
Their most important application is in catalytic converters, a critical component of exhaust systems in internal combustion vehicles. Platinum and palladium are central to autocatalysts, where they reduce harmful tailpipe emissions from cars, buses, and trucks—making a major contribution to cleaner air. Rhodium is often added to these systems (three-way catalysts) to further reduce nitrogen oxide (NOx) emissions in gasoline-powered vehicles.
PGMs also have other important applications in the clean-energy transition. Platinum, iridium, and ruthenium play a vital role in hydrogen production and fuel cell technologies.
Platinum also has wide industrial applications, spanning chemicals, glass manufacturing, electronics, medical devices, petroleum refining, and jewellery. Palladium serves many similar purposes, particularly in the chemical, electronics, and dental sectors.
Although both platinum and palladium are also investment commodities, this represents a relatively small share of their overall demand.
Meanwhile, iridium and ruthenium are essential to a range of chemical, electronic, and electrochemical applications.
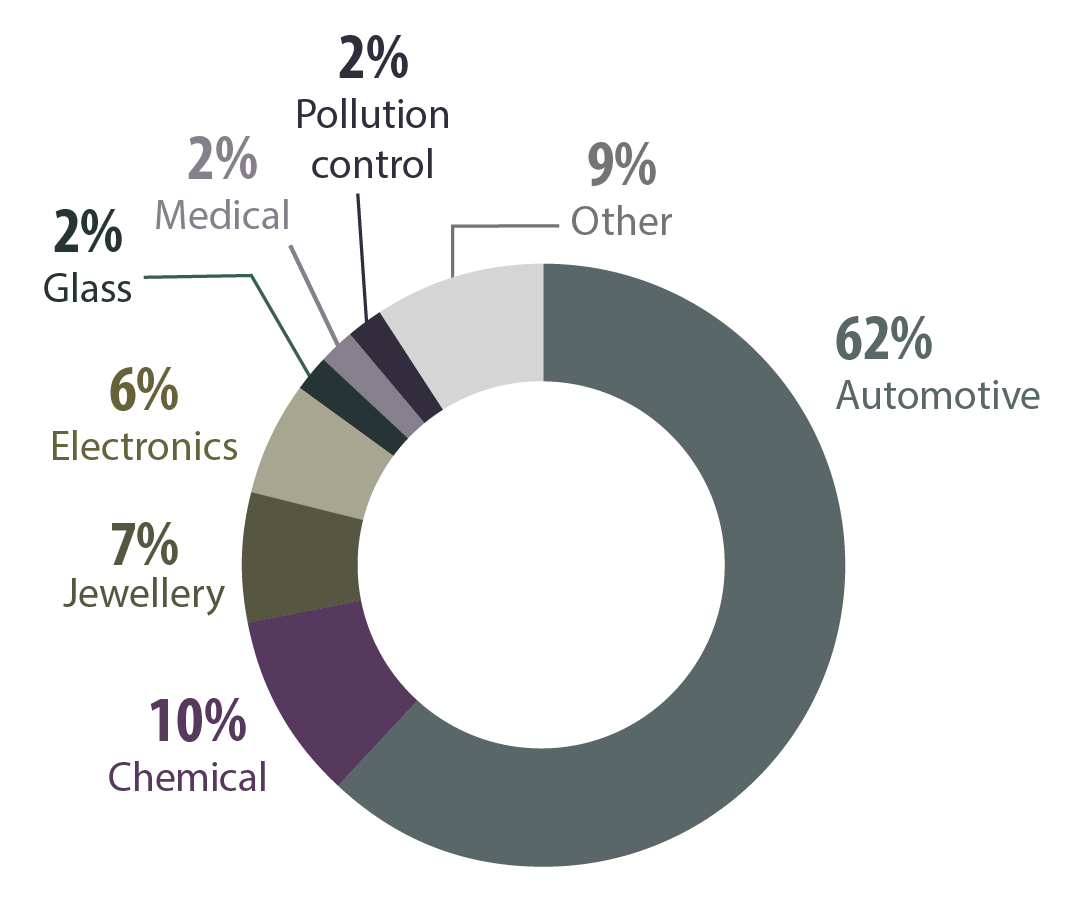
Platinum group metals, global uses, 2024
Text version
This circular chart illustrates the primary industrial applications of PGMs in 2024. The automotive sector represented the largest share at 62%, followed by chemical (10%), jewellery (7%), electronics (6%), glass (2%) medical (2%), pollution control (2%), and various other uses (9%).
 Production
In 2024, Canadian mines produced 746,000 troy ounces of PGMs. Most of the production came from Ontario, which accounted for 74% of the total, while the remaining production occurred in Quebec, Manitoba, and Newfoundland and Labrador.
Canada has one dedicated PGM mine, the Lac des Iles mine near Thunder Bay, Ontario. Additionally, PGMs are recovered as co-products at numerous primary nickel mines across the country. Currently, there are three advanced exploration projects in northern Ontario specifically targeting PGMs as their primary commodities.
Consult a map of producing Canadian mines and advanced projects
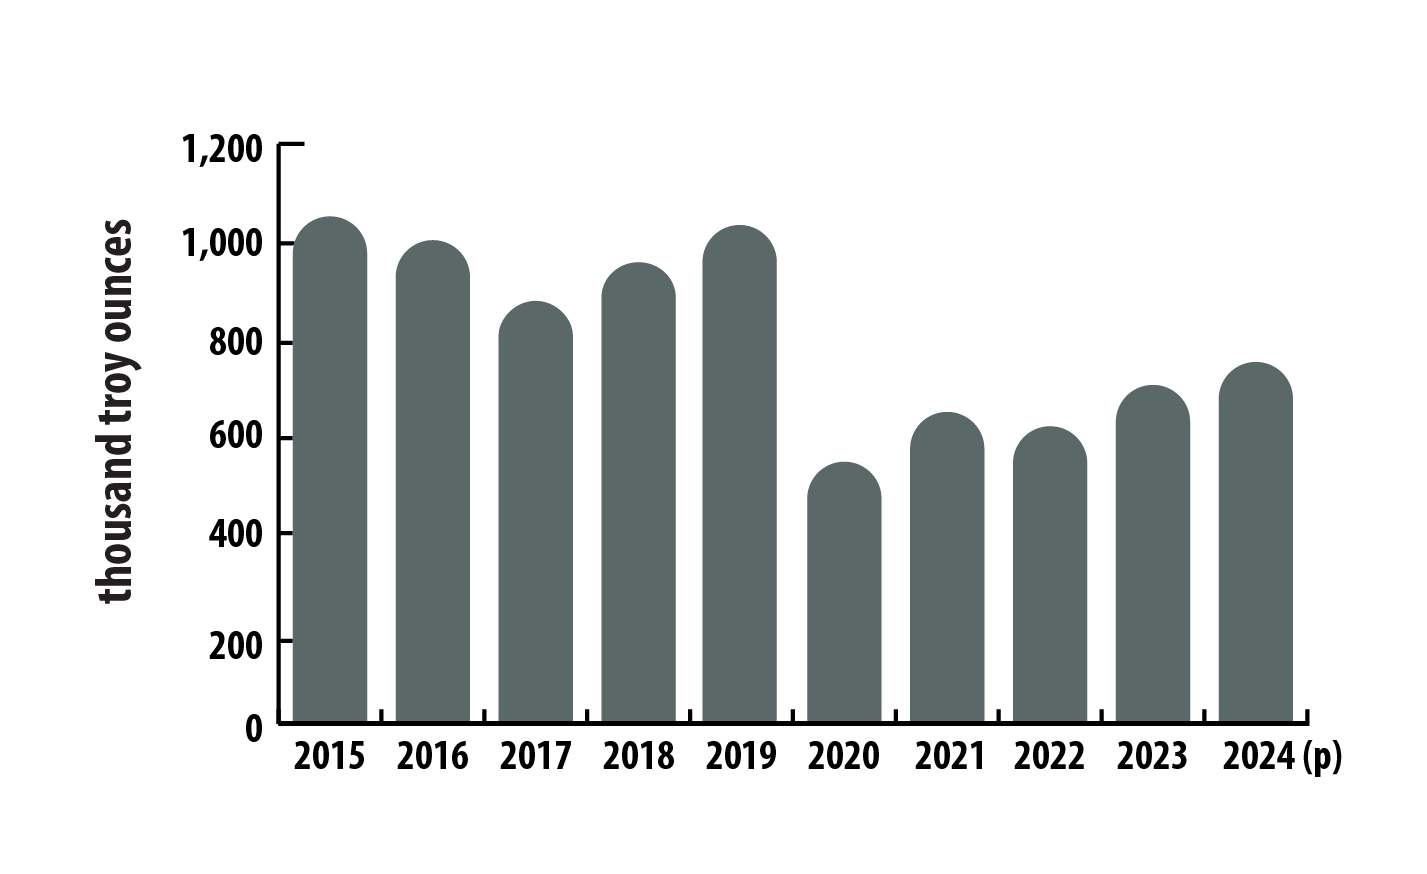
Canadian mine production of platinum group metals, 2015–2024 (p)
Text version
This bar graph illustrates Canada’s annual PGM mine production from 2015 to 2024. Production was 1.07 million troy ounces in 2015, falling to 879,000 troy ounces in 2017. It then rose to 1.04 million troy ounces in 2019 before dropping sharply to 541,000 troy ounces in 2020. Output rebounded to 655,000 troy ounces in 2021, dipped slightly to 626,000 troy ounces in 2022, and then increased to 702,000 troy ounces in 2023 and 746,000 troy ounces in 2024.
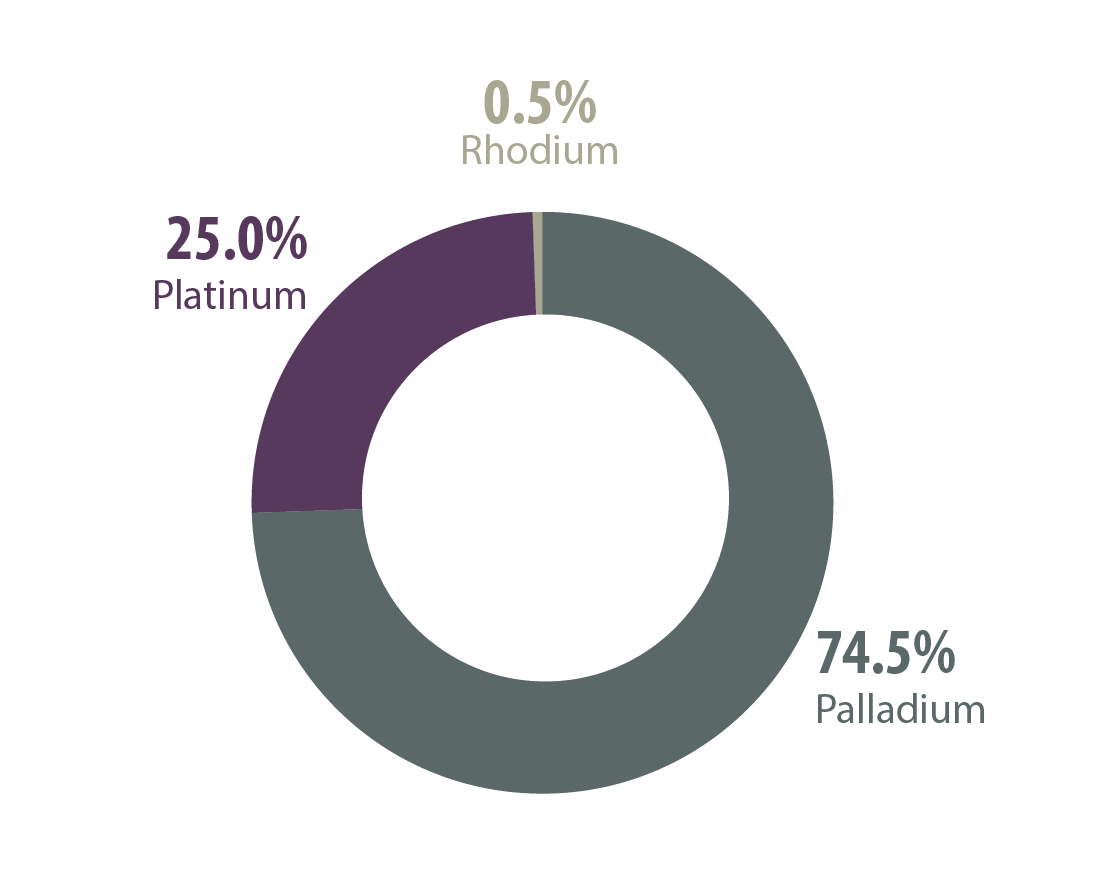
Canadian mine production of platinum group metals, by element, 2024 (p)
Text version
This chart illustrates the breakdown of Canadian PGM mine production by element in 2024: palladium (74.5%), platinum (25.0%), and rhodium (0.5%).
 International context
Canada is the fourth-largest producer of mined PGMs in the world, accounting for about 5.6% of global production. An estimated 17.7 million troy ounces of PGMs was supplied globally in 2024, 74% of which was from mined sources, and the balance was from recycling and scrap sources.
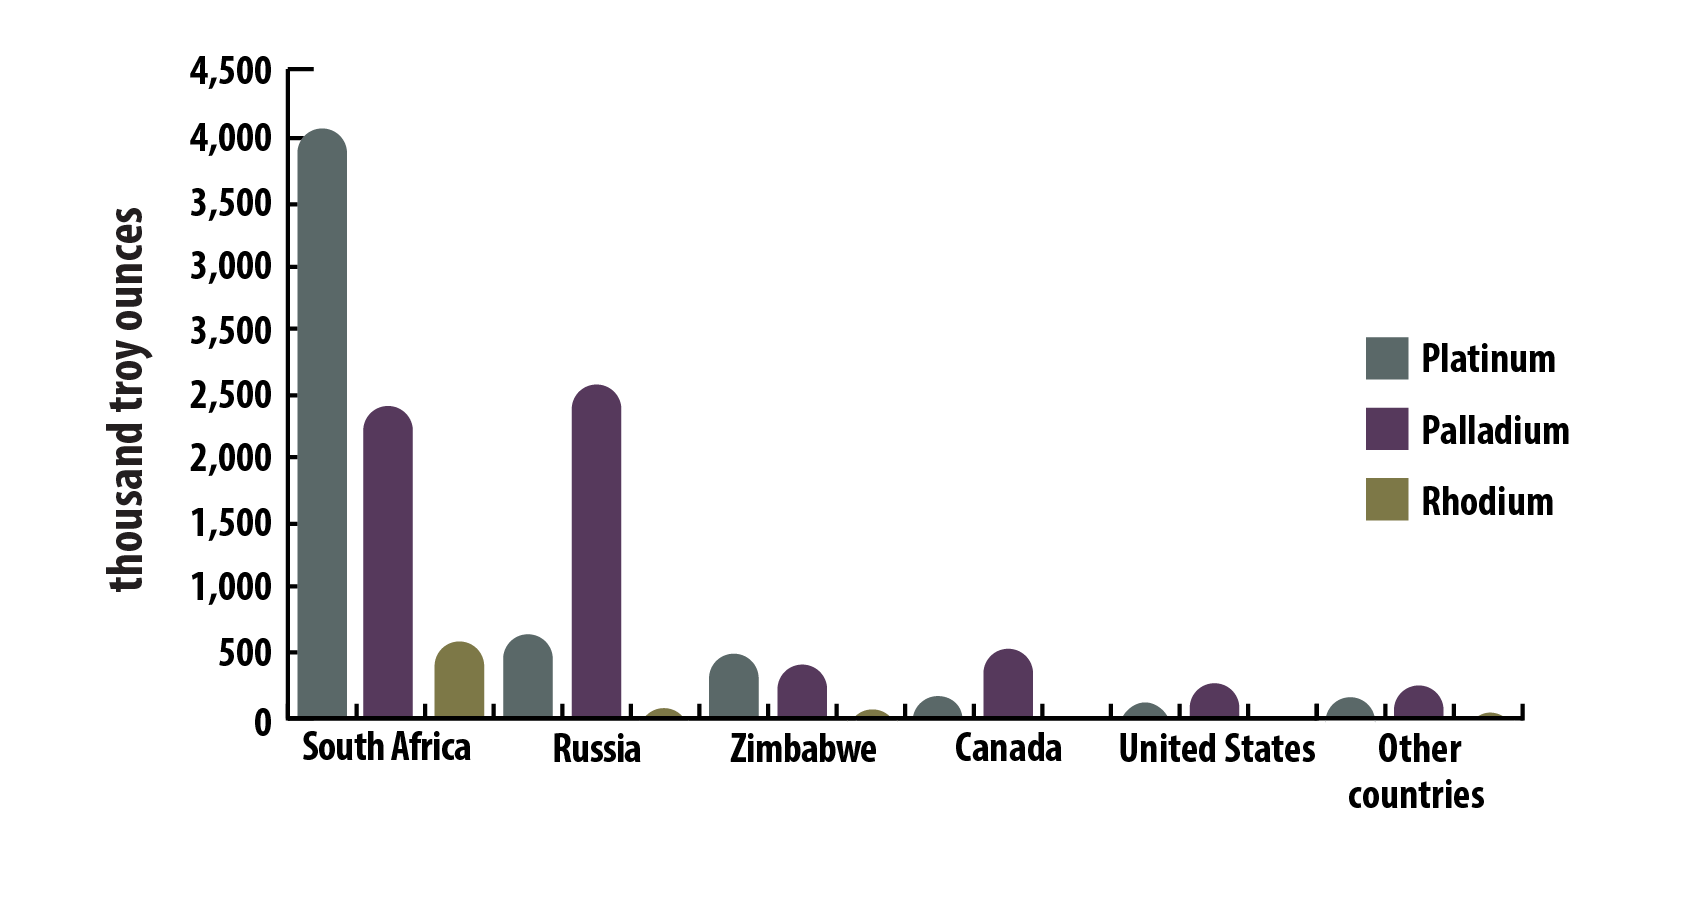
World mine production of platinum group metals, by country, 2024 (p)
Text version
This bar graph illustrates the estimated global production of platinum, palladium, and rhodium in 2024, measured in thousands of troy ounces, by country. The top producers are:
- South Africa: platinum (4,112,000 oz.), palladium (2,420,000 oz.), rhodium (586,000 oz.)
- Russia: platinum (650,000 oz.), palladium (2,750,000 oz.), rhodium (57,000 oz.)
- Zimbabwe: platinum (507,000 oz.), palladium (419,000 oz.), rhodium (45,000 oz.)
- Canada: platinum (183,000 oz.), palladium (546,000 oz.), rhodium (4,000 oz.)
- United States: platinum (64,000 oz.), palladium (257,000 oz.)
- Other countries: platinum (207,000 oz.), palladium (262,000 oz.), rhodium (22,000 oz.)
| Rank | Country | Palladium (kg) | Platinum (kg) | Total |
|---|---|---|---|---|
| 1 | South Africa | 72,000 | 120,000 | 192,000 |
| 2 | Russia | 75,000 | 18,000 | 93,000 |
| 3 | Zimbabwe | 15,000 | 19,000 | 34,000 |
| 4 | Canada | 17,000 | 5,700 | 22,700 |
| 5 | United States | 8,000 | 2,000 | 10,000 |
| - | Other countries | 4,200 | 4,600 | 8,800 |
| Total | - | 191,200 | 169,300 | 360,500 |
World production of platinum group metals, including recycling, 2015–2024 (p)
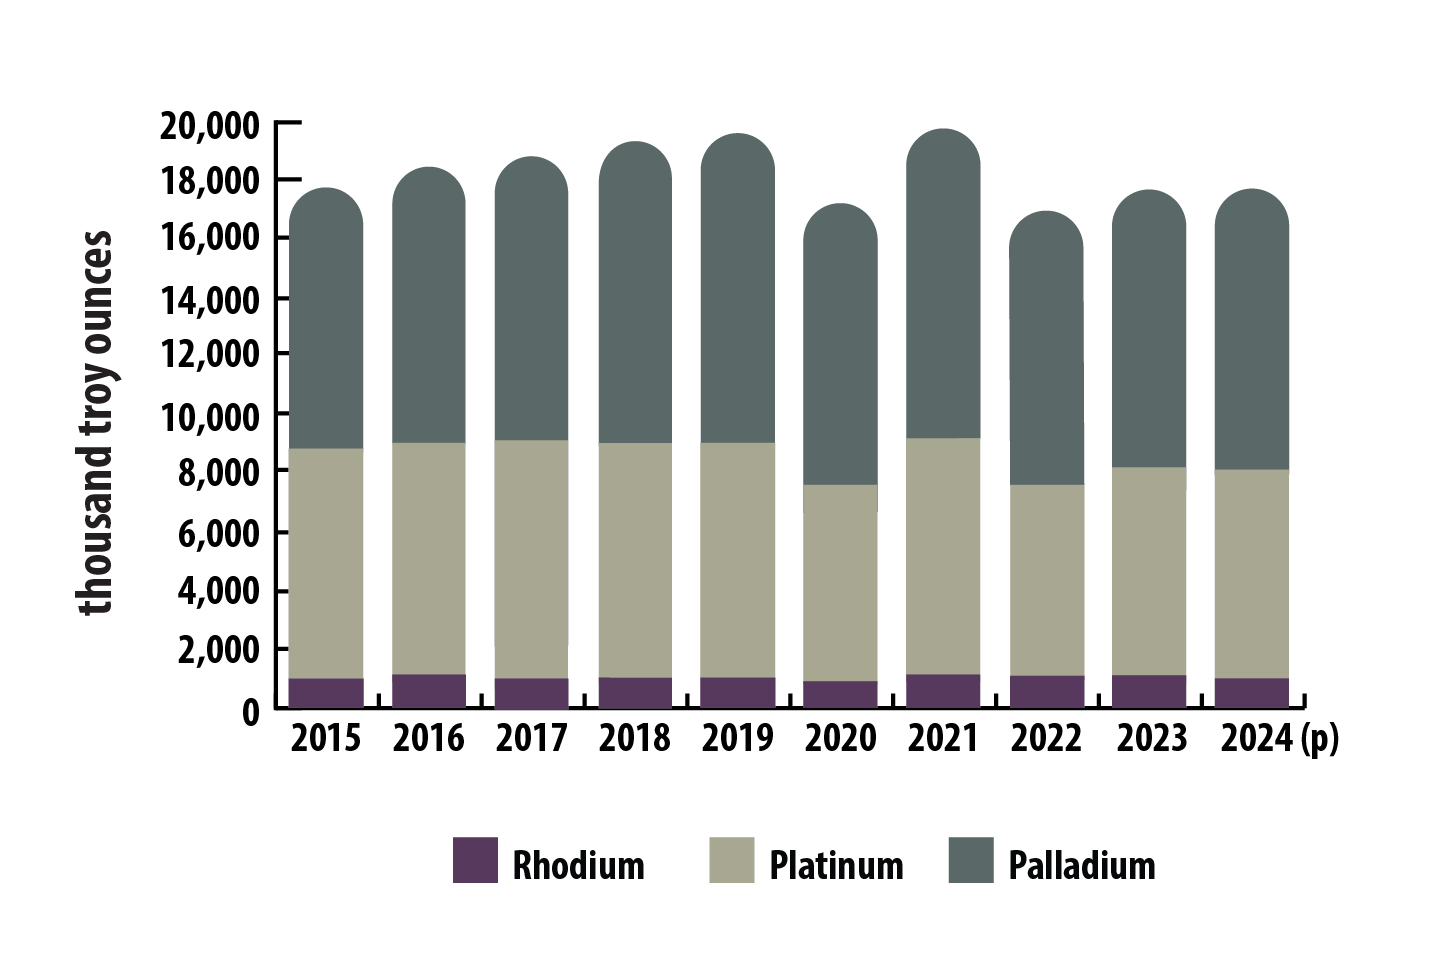
Text version
This bar graph illustrates the global annual production of PGMs from 2015 to 2024, including platinum, palladium, and rhodium. In 2015, production stood at 17.7 million troy ounces, rising to a peak of 19.8 million troy ounces in 2019. However, production dropped to 16.9 million troy ounces in 2020 because of supply chain disruptions caused by the COVID-19 pandemic. In 2021, production rebounded by 13%, reaching 19.2 million troy ounces, but then declined by 11% in 2022 to 17.0 million troy ounces. Production increased slightly to 17.6 million troy ounces in 2023 and held steady at 17.7 million troy ounces in 2024.
In 2024, global proven reserves of PGMs were estimated at 81,330 tonnes, or 2.6 billion troy ounces, with the majority located in South Africa. Canada holds the fifth-largest known PGM reserves globally, totalling 310 tonnes, or roughly 10 million troy ounces.
| Rank | Country | Tonnes | Percentage of total |
|---|---|---|---|
| 1 | South Africa | 63,000 | 77.5% |
| 2 | Russia | 16,000 | 19.7% |
| 3 | Zimbabwe | 1,200 | 1.5% |
| 4 | United States | 820 | 1.0% |
| 5 | Canada | 310 | 0.4% |
| - | Other countries | N/A | N/A |
| Total | - | 81,330 | 100.0% |
 Trade
Trade
Exports
In 2024, Canada’s domestic exports of refined (Stage 2) and semi-fabricated (Stage 3) platinum group metal (PGM) products totaled 6,096 kg, valued at $333 million. This represents a 13% decrease in volume and a 17% decline in value compared to 2023.
Palladium-based products dominated, accounting for 89% of the volume and 91% of the value. Platinum-based products made up the remaining 11% of volume and 9% of value, while rhodium-based products represented less than 0.1% of both.
The United States was the primary destination, receiving 67% of the total export value, followed by Switzerland at 33%. Quebec led the country in PGM exports, contributing $302 million (91% of the total), while Ontario accounted for $30 million (9%).
Imports
In 2024, Canada imported 19,946 kg of refined (Stage 2) and semi-fabricated (Stage 3) PGM) products, valued at $1.1 billion. This marked a 24% decrease in volume and a 31% decline in value compared to 2023.
Palladium accounted for most imports, representing 79% of the volume and 65% of the value. Platinum made up 14% of the volume and 11% of the value, while rhodium accounted for 6% of the volume but a much higher share of the value at 23%. Together, iridium, osmium, and ruthenium comprised 1% of the volume and 2% of the value.
Imports were sourced primarily from South Africa, which supplied 59% of the total import value. Other key suppliers included the United States (21%), South Korea (6%), Belgium (5%), Germany (4%), Switzerland (3%), and the United Kingdom (1%).
 Prices
Platinum prices remained relatively stable in 2024, with monthly averages fluctuating between US$900 and US$1,000 per troy ounce. Prices bottomed at US$894 in February and peaked at US$1,014 in May. The annual average price was US$955 per troy ounce, virtually unchanged from 2022 and 2023.
Palladium prices also stabilized in 2024, ranging between US$920 and US$1,070 per troy ounce. Prices hit a low of US$925 in June and a high of US$1,069 in October. The annual average fell to US$983 per troy ounce, down sharply from US$1,338 in 2023 and nearly equal to platinum. Palladium, which held a price premium over platinum from 2018 to 2023, has steadily declined since 2021 amid expectations of weaker demand because of the shift from internal combustion engine vehicles toward electric vehicles.
Rhodium prices stabilized in 2024 following a sharp decline the previous year.
Platinum, monthly average prices, 2015–2024
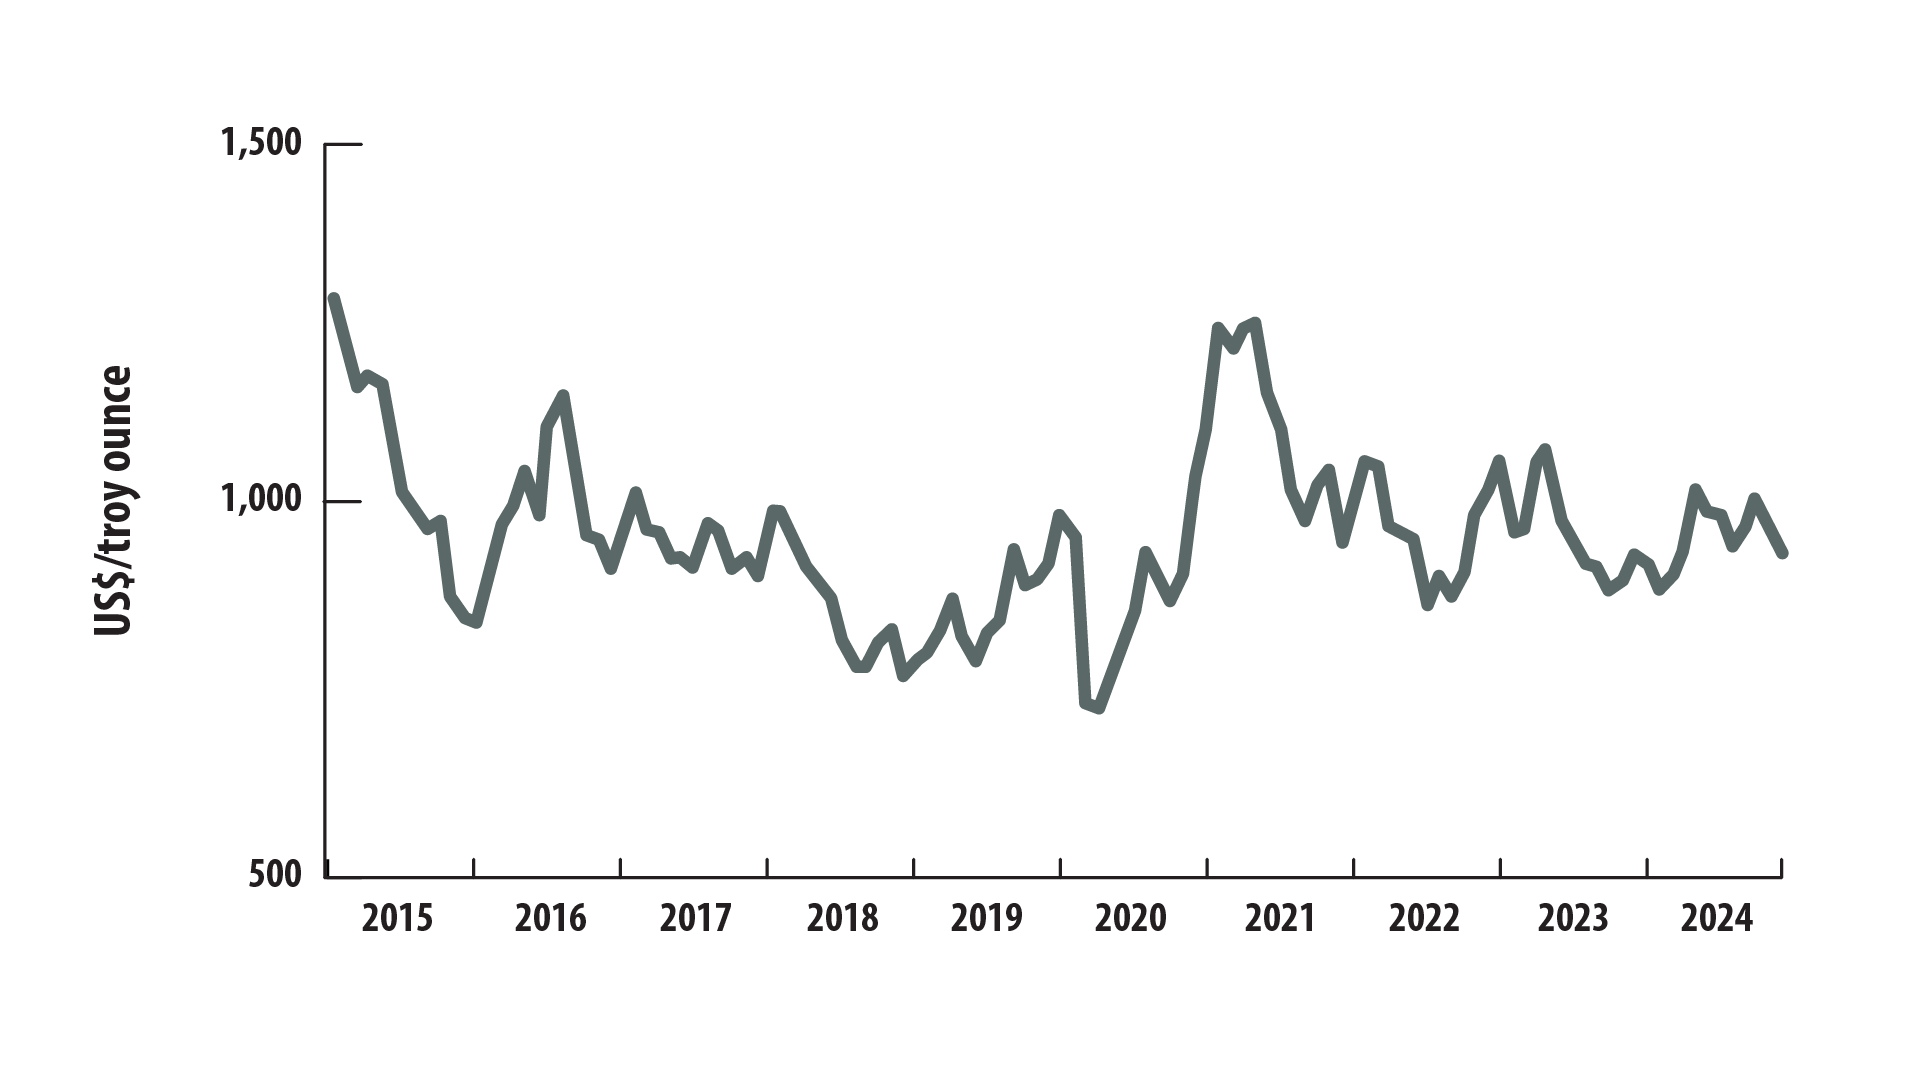
Text version
This line graph shows the monthly average price of platinum, in United States dollars per troy ounce, from 2015 to 2024. In 2015, the annual average price was $1,053 per troy ounce, declining through 2016. Between 2016 and 2020, prices remained relatively stable, ranging from $750 to just over $1,100 per troy ounce.
Prices peaked in 2021 at just over $1,200, with the annual average rising to $1,091 per troy ounce, before falling to $962 in 2022. From 2022 to 2024, prices again stabilized within a range of $850 to just over $1,050. In 2024, monthly prices fluctuated between $894 and $1,014 per troy ounce, resulting in an annual average of $955—virtually unchanged from the previous two years.
Palladium, monthly average prices, 2015–2024
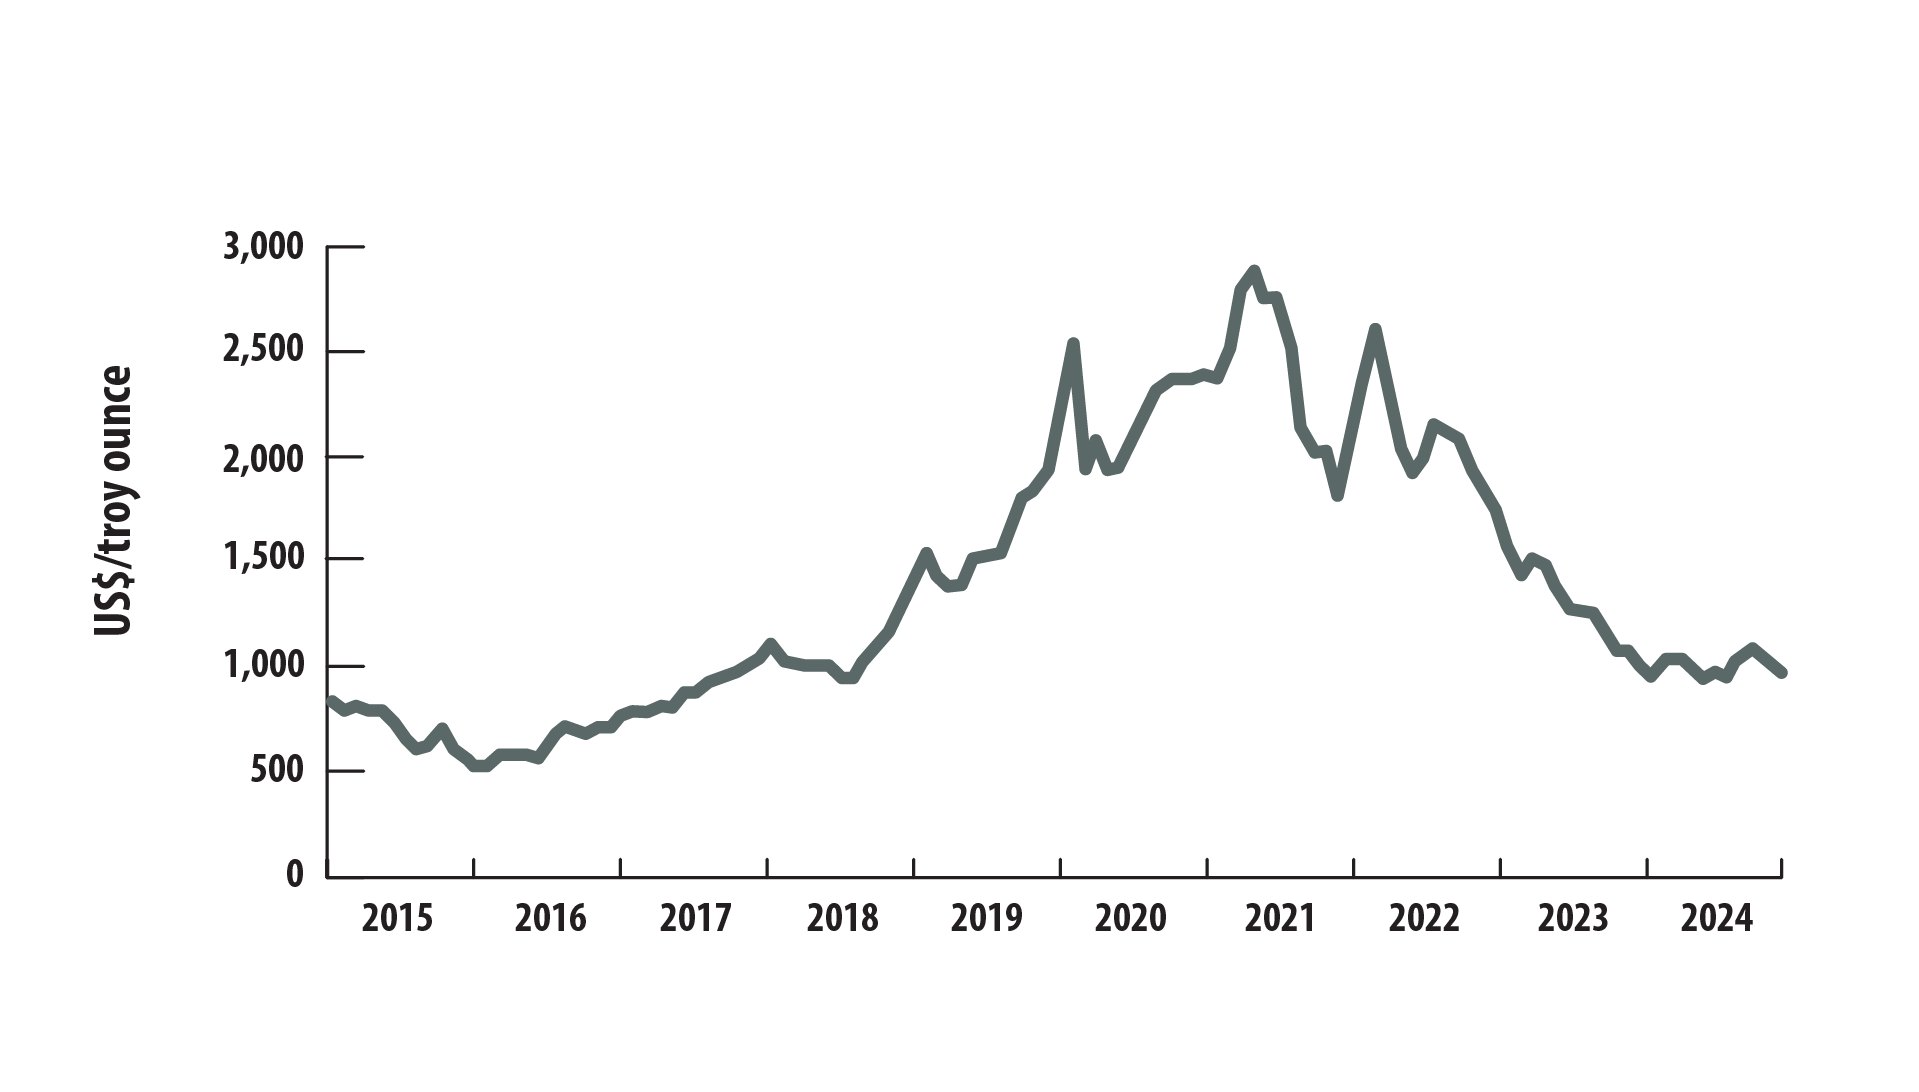
Text version
This line graph shows the monthly average price of palladium, in United States dollars per troy ounce, from 2015 to 2024. In 2015, the annual average price was $693 per troy ounce. Prices remained relatively stable through 2016, fluctuating between $498 and $800.
Starting in 2017, palladium prices rose steadily, with annual averages climbing to $869 in 2017, $1,036 in 2018, and $1,572 in 2019. In early 2020, prices reached a peak of $2,525 per troy ounce before dropping to $1,902 by May amid the onset of the COVID-19 pandemic. From 2020 to 2022, prices were highly volatile, with monthly averages ranging between $1,789 and $2,870. Annual averages over this period were $2,177 in 2020, $2,397 in 2021, and $2,108 in 2022.
In 2023, prices declined steadily, falling from $1,732 in January to a low of $1,050 in November, for an annual average of $1,338. In 2024, palladium prices stabilized, fluctuating between $925 and $1,069, with an annual average of $983.
 Recycling
In 2024, 4.6 million troy ounces of PGMs were recovered globally from the recycling of products such as autocatalytic converters, electrical scrap, and jewellery. Recycling accounted for 26% of the total global supply of PGMs in 2024, with the balance coming from mining. The high value of PGMs, combined with their significant concentrations in recyclable materials, drives substantial levels of PGM recycling.
World supply of platinum group metals, by source, 2024
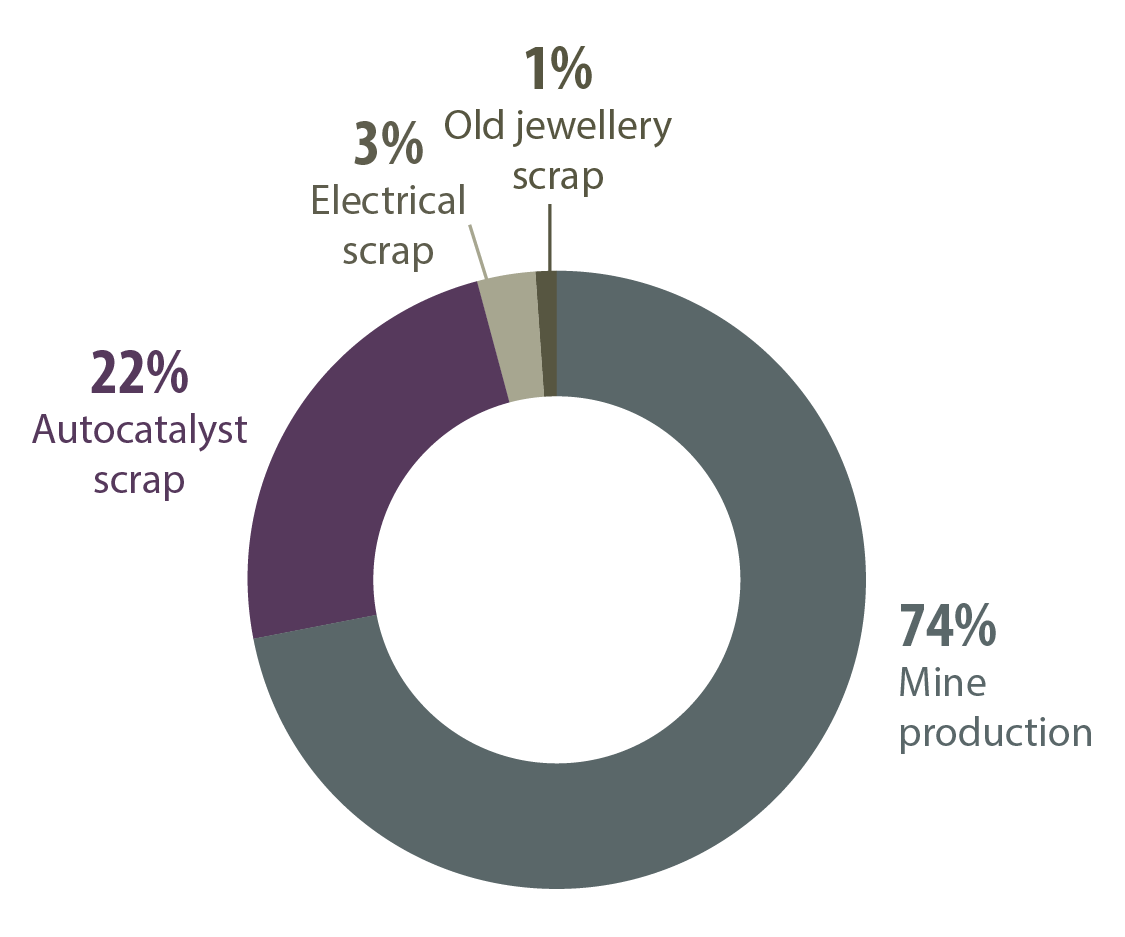
Text version
This pie chart illustrates the global supply of PGMs by source in 2024, expressed as a percentage. The primary source was mine production, which constituted 74% of the total supply. Recycling sources included autocatalyst scrap at 22%, electrical scrap at 3%, and old jewellery scrap at 1%. In total, recycled materials accounted for 26% of the overall production.
Notes and sources
(p) preliminary
Totals may be different because of rounding.
All dollars are Canadian unless indicated otherwise.
Uses
- Platinum group metals, global uses, 2024
- Johnson Matthey, PGM market report, May 2025
Production
- Canadian mine production of platinum group metals, 2015–2024 (p)
- Natural Resources Canada
- Canadian mine production of platinum group metals, by element, 2024 (p)
- Johnson Matthey, PGM market report, May 2025
- United States Geological Survey; Mineral Commodity Summaries 2025
International context
- World mine production of platinum group metals, by country, 2024 (p)
- Johnson Matthey, PGM market report, May 2025
- World mine production of platinum and palladium, by country, 2024 (p)
- United States Geological Survey; Mineral Commodity Summaries 2025
- World production of platinum group metals, including recycling, 2015–2024 (p)
- Johnson Matthey, PGM market report, May 2025
- World reserves of platinum group metals, by country, 2024 (p)
- U.S. Geological Survey
Trade
- Natural Resources Canada
- Mineral trade includes unwrought, powders, and semi-fabricated mineral products (HS codes: 711011, 711019, 711021, 711029, 711031, 711039, 711041, 711049).
Prices
- Johnson Matthey, PGM market report, May 2025
- Platinum, monthly average prices, 2015–2024
- World Bank
- Palladium, monthly average prices, 2015–2024
- London Metal Exchange
Recycling
- World supply of platinum group metals, by source, 2024
- Johnson Matthey PGM market report, May 2025