

Iron ore is a combination of minerals from which metallic iron can be extracted economically.
Key facts
- Canada is the world’s eighth-largest producer of iron ore.
- Canada’s iron ore is mined in Quebec, Newfoundland and Labrador, and Nunavut.
- Canada has some of the highest-grade iron ore in the world that is suitable for making green steel.
Learn more about iron ore
 Uses
Uses
Approximately 98% of iron ore is used to make steel. The remaining 2% serve various other applications, including powdered iron for certain types of steel, auto parts and catalysts; radioactive iron for medicine; and iron blue in paints, inks, cosmetics, and plastics.
Iron ore, global uses, 2024
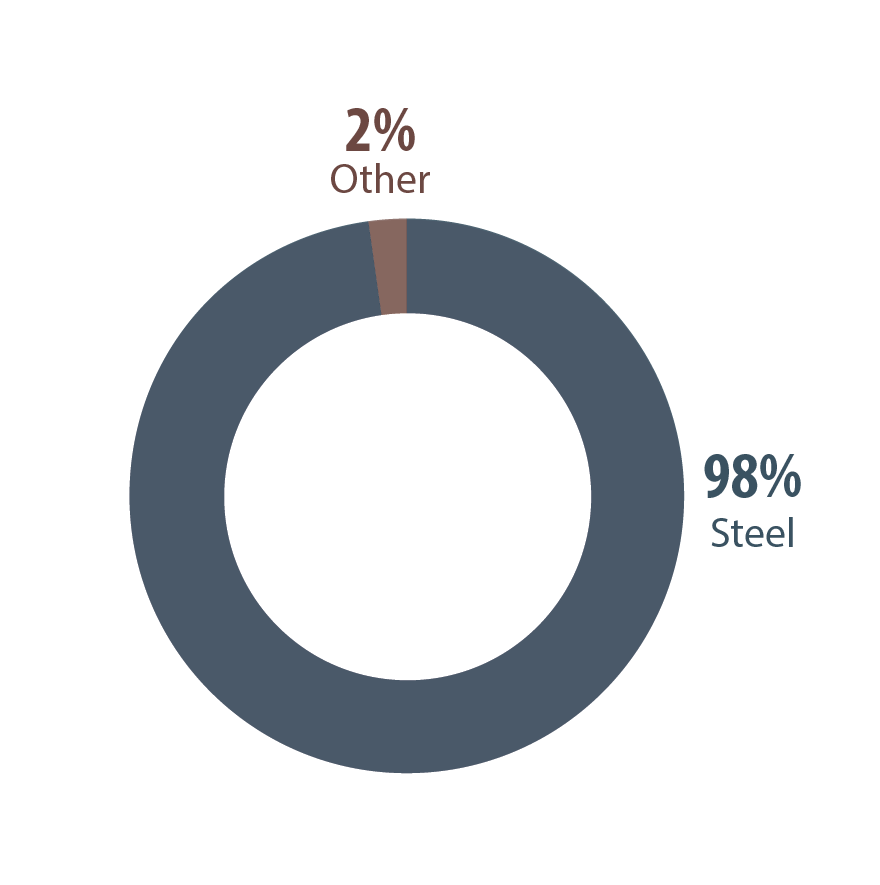
Other: powdered iron, iron 59, iron blue, black iron oxide
Text version
This pie chart illustrates the primary global uses of iron ore, with 98% dedicated to steel production. The remaining 2% covers various other applications, including powdered iron, radioactive iron (iron 59), iron blue and black iron oxide.
 Production
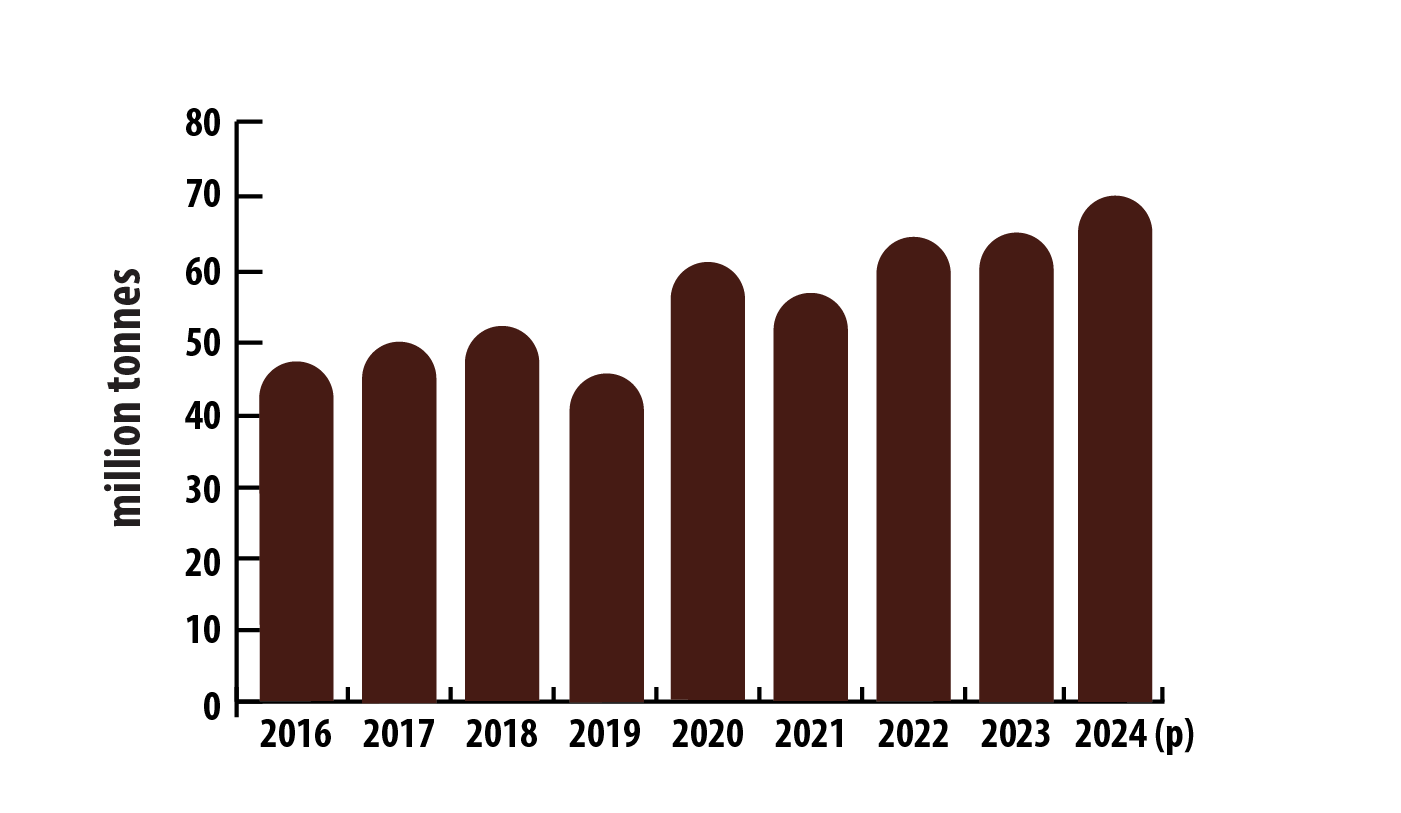
In 2024, Canadian mine production of iron ore in concentrate and pellets reached 70 million tonnes, marking a 7% increase from the previous year.
Canada's estimated crude steel production for 2024 remained steady at 12 million tonnes, showing no significant change from 2023.
Canadian mine production of iron ore, 2015–2024 (p)
Text version
This bar graph illustrates Canada’s annual iron ore mine production from 2015 to 2024. Production was lowest in 2015 at 46.2 million tonnes, then rose steadily to a peak of 60.8 million tonnes in 2020. Output declined in 2021 to 57.3 million tonnes and then rose gradually to 64.2 million tonnes in 2022, 65.2 million tonnes in 2023, and 70.0 million tonnes in 2024.
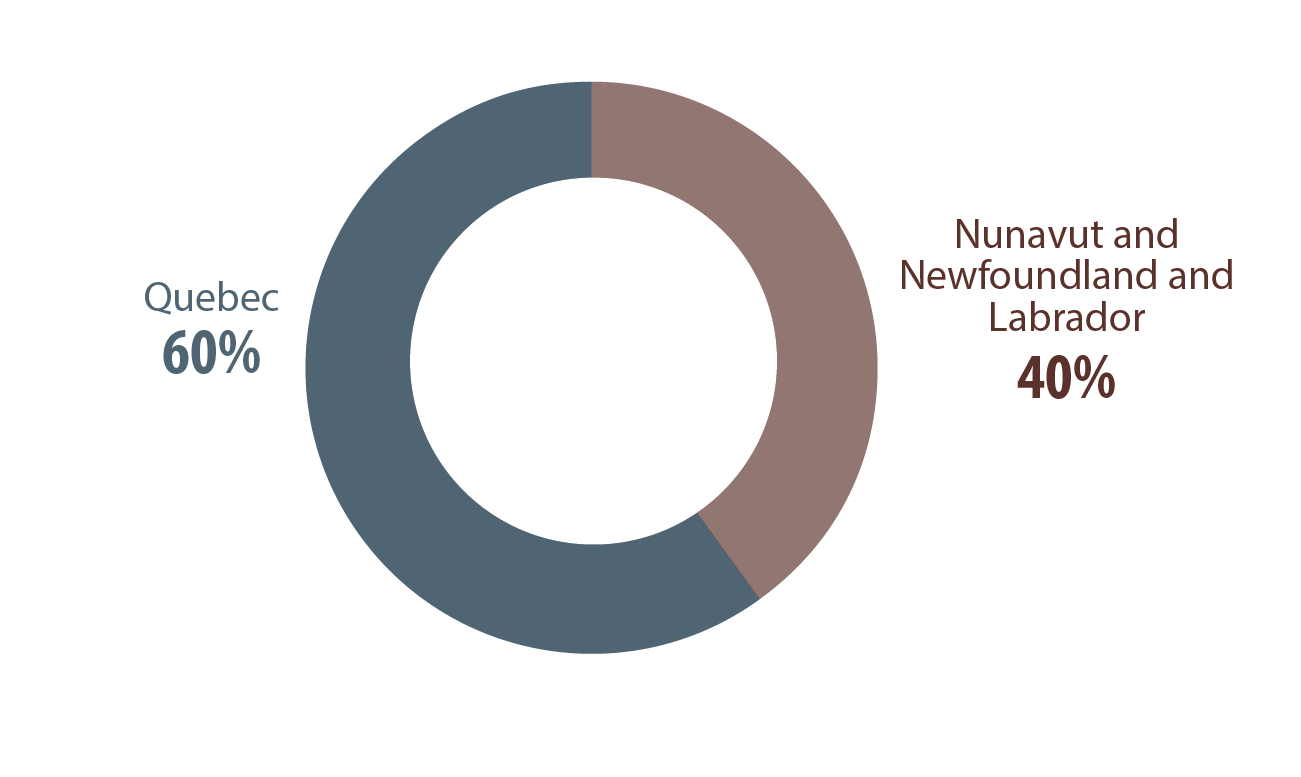
Most of Canada's iron ore comes from the Labrador Trough region bordering Quebec and Newfoundland and Labrador. Iron ore is also produced by the Mary River Mine in Nunavut.
Canadian mine production of iron ore, by province and territory, 2024 (p)
Text version
This graph illustrates Canada’s iron ore concentrate production by province and territory in 2024. Quebec led with 41.8 million tonnes, representing 60% of total production. The remaining 40% came from Nunavut and Newfoundland and Labrador, though individual figures for these jurisdictions are not published because of confidentiality requirements in the data.
Consult a map of producing Canadian mines
 International context
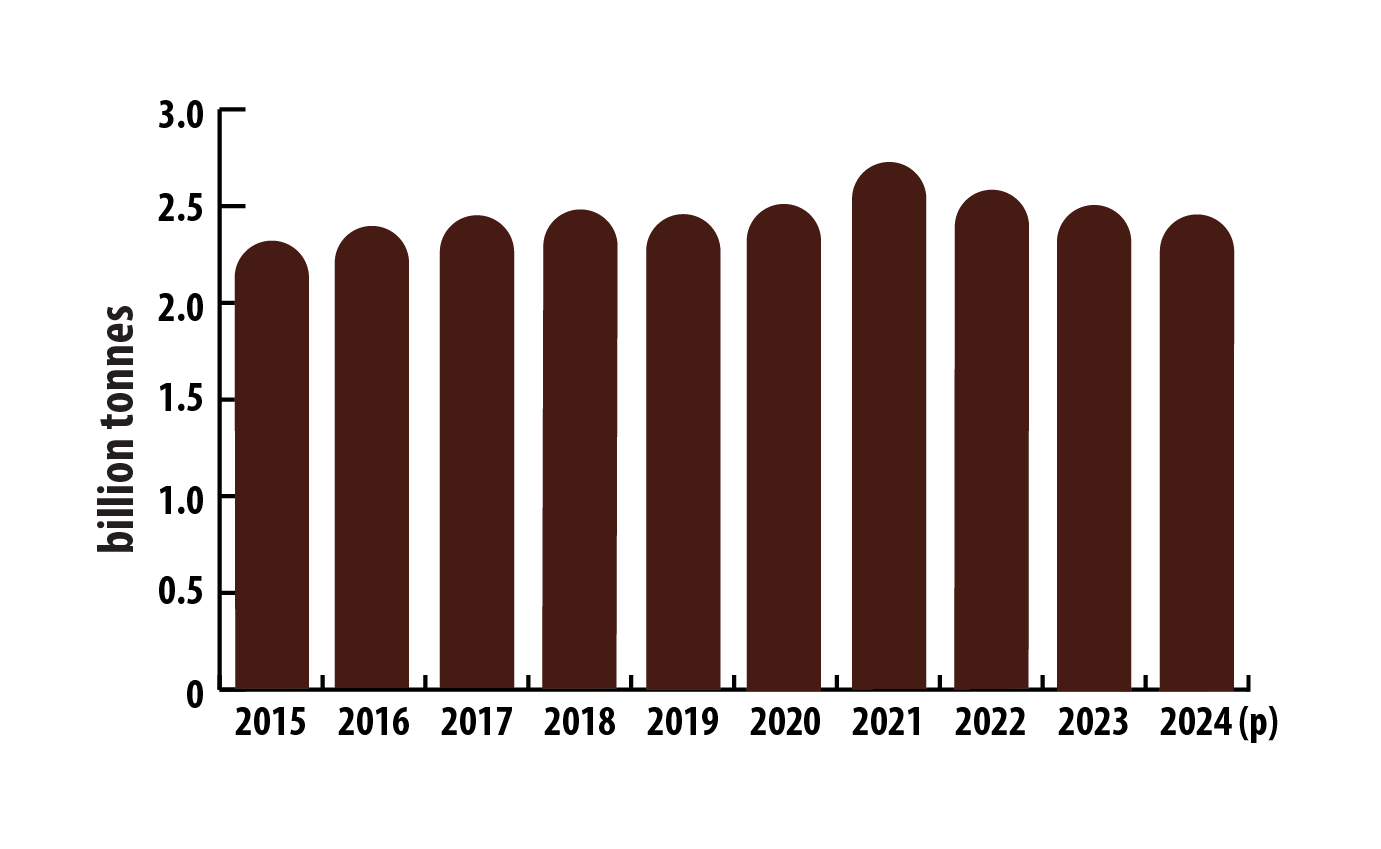
In 2024, global production of iron ore reached an estimated 2.5 billion tonnes, a 1% decline from 2023. The top four producers collectively contributed over three-quarters of the world's iron ore. Australia was the largest producer, accounting for 37% of the total. Canada ranked as the eighth-largest iron ore producer globally and sixth in terms of reserves.
| Ranking | Country | Million tonnes | Percentage of total |
|---|---|---|---|
| 1 | Australia | 930 | 37.2% |
| 2 | Brazil | 440 | 17.6% |
| 3 | China | 270 | 10.8% |
| 4 | India | 270 | 10.8% |
| 5 | Russia | 91 | 3.6% |
| 6 | Iran | 90 | 3.6% |
| 7 | South Africa | 66 | 2.6% |
| 8 | Canada | 54 | 2.2% |
| 9 | United States | 48 | 1.9% |
| 10 | Ukraine | 42 | 1.7% |
| - | Other countries | 199 | 8.0% |
| Total | 2,500 | 100.0% |
World mine production of iron ore, 2015–2024 (p)
Text version
This bar graph illustrates annual global iron ore mine production from 2015 to 2024. Production was 2,365 million tonnes in 2015 and rose steadily to a decade high of 2,680 million tonnes in 2021. It then declined to 2,500 million tonnes in 2022, increased slightly to 2,533 million tonnes in 2023, and fell back to 2,500 million tonnes in 2024.
World reserves
| Ranking | Country | Million tonnes | Percentage of total |
|---|---|---|---|
| 1 | Australia | 58,000 | 29.0% |
| 2 | Russia | 35,000 | 17.5% |
| 3 | Brazil | 34,000 | 17.0% |
| 4 | China | 20,000 | 10.0% |
| 5 | Ukraine | 6,500 | 3.3% |
| 6 | Canada | 6,000 | 3.0% |
| 7 | India | 5,500 | 2.8% |
| 8 | Iran | 3,800 | 1.9% |
| 9 | United States | 3,600 | 1.8% |
| - | Other countries | 27,600 | 13.8% |
| Total | 200,000 | 100.0% |
 Trade
Trade
Exports
In 2024, Canada exported 60.9 million tonnes of iron ore, worth $8.8 billion, compared to 58.2 million tonnes valued at $8.9 billion in 2023. The increase in volume, coupled with a lower export value, reflects declining prices in 2024. Of the total export volume, iron ore pellets comprised 41%, while the remaining 59% were other concentrates (non-agglomerated).
Imports
In 2024, Canada imported 8.0 million tonnes of iron ore, valued at $1.1 billion, virtually unchanged from 8.1 million tonnes valued at $1.1 billion in 2023. Of the total imported volume, 99% were pellets, with the remainder consisting of other concentrates. Nearly all pellets came from the United States, while concentrates were imported primarily from the United States (33%), Australia (31%) and Sweden (28%). These non-agglomerated concentrates are used in producing blast furnace pellets and metallization pellets.
 Prices
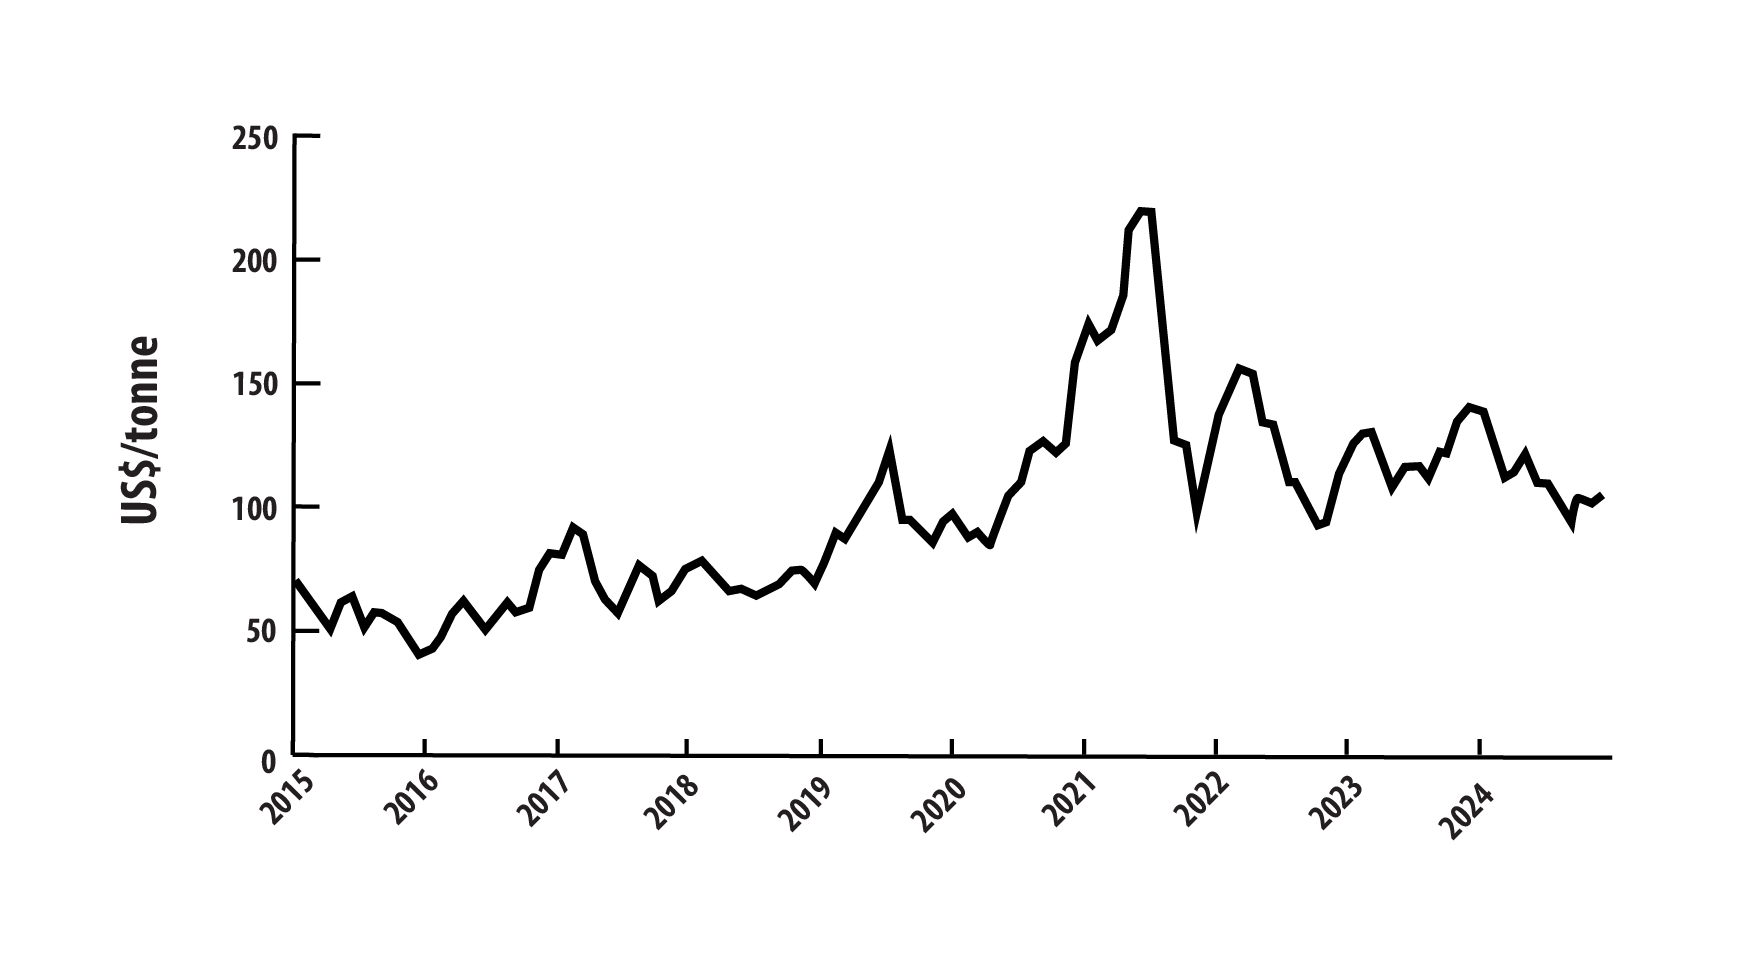
Iron ore prices have been highly volatile, falling from US$68 per tonne in January 2015 to a decade low of US$41 by year end, peaking at US$214 in mid-2021, and ending 2024 at US$102 per tonne.
These price variations reflect changing demand trends from steel manufacturers, driven primarily by activity in China.
Iron ore prices, monthly average, 2015–2024
Text version
This line graph shows average monthly iron ore prices in United States dollars per tonne from 2015 to 2024.
In January 2015, iron ore prices peaked at US$68 per tonne but fell sharply to a decade low of US$41 per tonne by December 2015. A moderate recovery in 2016 and 2017 raised prices to US$89 per tonne in February 2017 before a decline to US$72 per tonne by year end.
In 2019, prices rose from US$76 per tonne in January to US$120 per tonne in July, then stabilized around US$90 per tonne, which held through to May 2020. The next changes were a decade high of US$214 per tonne in June 2021 followed by a drop to US$96 per tonne by November 2021. In 2018, prices averaged US$70 per tonne.
Prices rebounded to US$152 per tonne in March 2022 but fell to US$93 per tonne by October, closing the year at US$112 per tonne. In 2023, they ended at US$137 per tonne. In 2024, prices declined again, bottoming at US$93 in September before slightly recovering to US$102 by year end.
 Recycling
Steel is entirely recyclable and can be reprocessed indefinitely without compromising quality. Recycling steel offers significant savings in both energy and raw materials. Each tonne of recycled steel scrap conserves over 1,400 kilograms of iron ore, 740 kilograms of coking coal, and 120 kilograms of limestone.
Despite the availability of steel scrap, there is not enough scrap available to meet the total demand for new steel products. Since 1960, the energy required to produce a tonne of steel has decreased by about 60%, particularly because of the increased use of electric arc furnaces that utilize steel scrap.
In 2024, Canada exported 4.6 million tonnes of steel scrap, valued at $2.6 billion, compared to 4.8 million tonnes worth $2.8 billion in 2023. Imports of steel scrap totaled 721 thousand tonnes, valued at $304 million, down from 759 thousand tonnes worth $371 million in 2023.
Notes and sources
(p) preliminary
Totals may be different because of rounding.
All dollars are Canadian unless otherwise indicated.
Uses
- Iron ore, global uses, 2024
- Iron – Minerals Education Coalition
Production
- Canadian estimated crude steel production
- World Steel Association
- Canadian mine production of iron ore, 2015–2024 (p)
- Natural Resources Canada; Statistics Canada
- Canadian mine production of iron ore, by province and territory, 2024 (p)
- Natural Resources Canada; Statistics Canada
- company reports
International context
- World mine production of iron ore, by country, 2024 (p)
- Natural Resources Canada; U.S. Geological Survey; Statistics Canada
- World mine production of iron ore, 2015–2024 (p)
- U.S. Geological Survey
- World reserves of crude iron ore, by country, 2024 (p)
- U.S. Geological Survey
Trade
- Natural Resources Canada; Statistics Canada
- Mineral trade includes ores, concentrates, and semi- and final-fabricated mineral products.
Prices
- Iron ore prices, monthly average, 2015–2024
- World Bank
Recycling
- World Steel Organization, Circular Economy
- Natural Resources Canada; Statistics Canada
- Waste and scrap of steel, steel alloys and cast iron