
Help us improve!
Take our short survey to share your thoughts on the Atlas of Canada.
Discover a selection of interactive maps by Atlas theme.
On this page
Climate and environment

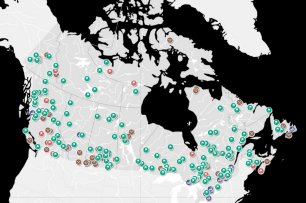
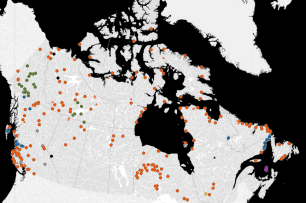
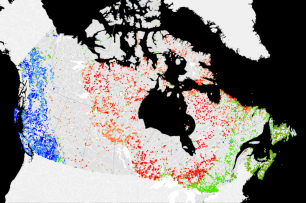
2023 Forest Fires
This map shows a time-lapse of wildfires between April 19th and September 9th of 2023. Season-to-date wildfire hotspot data were combined and processed to generate the map. During the 2023 season, the most destructive recorded to date, there were 6,132 fires by September 5th.
Energy and economy
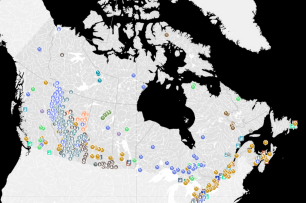
Critical Minerals
This interactive map shows Canada's advanced critical mineral projects, active mines, and processing facilities. Use the map to find critical mineral sites and to consult the list of the commodities they process, produce or consider producing. The mining projects presented in this map are those with mineral reserves or resources (measured or indicated), and their potential viability supported by a preliminary economic assessment or by a prefeasibility or feasibility study.
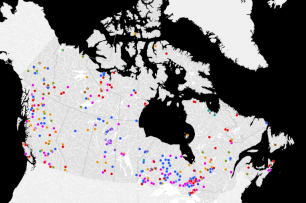
Minerals and Mining
This interactive map shows Canada's principal producing mines for the given reference year. It includes locations for significant metallic, non-metallic and industrial mineral mines, coal mines, oil sands mines, oil and gas fields, and significant metallurgical facilities across Canada. This map also includes the top 100 exploration and deposit appraisal projects for the given reference year.
Indigenous Mining Agreements
This interactive map shows Indigenous Mining Agreements across the country and specific information on exploration projects and mines, Indigenous communities, and the types of agreements signed between communities and mining companies. These agreements improve the partnerships related to exploration and mine development and have also been successful in securing benefits for many Indigenous communities.
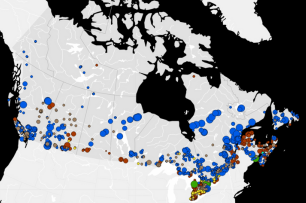
Clean Energy Resources and Projects (CERP) in Canada
This interactive map shows Canada's extensive clean-energy resources and projects. Clean energy includes renewable energy, electric vehicles, nuclear energy, biofuels, and carbon capture and storage (CCS). CCS is considered clean energy because it can significantly reduce global CO2 emissions resulting from fossil fuel–based power generation and from emission-intensive industrial processes like oil refining and the production of iron and steel, cement, and chemicals.
Remote Communities Energy Database
This interactive map gives information about the generation and use of electricity and other energy sources for all remote communities in Canada. Communities are identified as being remote if they are not currently connected to the North American electrical grid nor to the piped natural gas network; and are a permanent or long-term (5 years or more) settlement with at least 10 dwellings.
Land and water
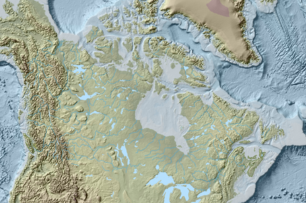
Relief map of Canada
This map shows Canada's relief and bathymetry. Canada's relief is shown by a colour ramp to show elevation ranges. Water depth (ocean bathymetry) is shown using colour tints.
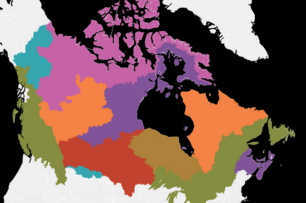
Major Drainage Areas of Canada
The Major Drainage Areas (MDA), as portrayed in this map, are part of the Standard Drainage Area Classification (SDAC) which was developed by Natural Resources Canada, in partnership with Statistics Canada, and Environment and Climate Change Canada.
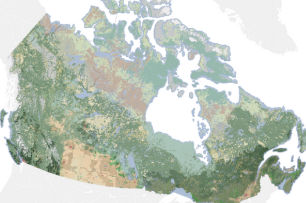
2020 Land Cover of Canada
The Canada Centre for Mapping and Earth Observation (CCMEO) has used satellite imagery to create a land cover map of Canada at a resolution of 30 metres. This map is part of the 2010, 2015, 2020 Land Cover Map series.
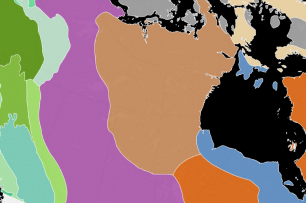
Physiographic Regions of Canada
This map shows Canada's physiographic regions, each of which has its own topography and geology. Physiographic regions are large areas that share similar relief and landforms shaped by common geomorphic processes and geological history. Physiographic regions are often used to describe Canada's geography to show regional differences in climate, vegetation, population and the economy. This map shows the location of seven physiographic regions, twenty-one sub-regions and their divisions with accompanying descriptive images and text.
Canadian Geochronology Knowledgebase
This map represents a compilation of publicly available geochronological information for Canada, with data compiled from federal, provincial, and territorial government publications and reports, university theses, books, and journal articles.
People and places
Territorial Evolution from 1867 to 2017
This map presents the history of the political boundaries in Canada, from Confederation in 1867 to 2017.