
(published in June 2024)
Mineral exploration plays a key role in ensuring the long-term viability of Canada’s mining industry. It results in the discovery and development of mineral deposits that may become mines of minerals and metals used in many products we rely on in our daily lives. The deposits are often in remote and northern communities, and establishing mines in these communities creates local jobs.
Learn about the latest trends in mineral exploration in Canada:
Overview
Following a decline in exploration and deposit appraisalFootnote 1 spending in 2020, there was a significant rebound in activities in 2021, with spending surging 72% to $3.8 billion. This positive momentum continued into 2022, when exploration reached the second-highest level of spending on record at $4.4 billion. However, in 2023, spending receded to $3.9 billion due to tightening financial conditions driven by macroeconomic headwinds and geopolitical tensions, alongside a pullback in metal prices, particularly nickel and lithium, due to oversupply.
Despite the pullback in spending in 2023, long-term forecasts call for spending growth driven partly by the anticipated surge in demand for the clean energy transition. Global commitments toward net-zero emissions will require vast amounts of the minerals and metals used in technologies such as electric vehicles (EV), wind turbines, solar panels, and energy storage and distribution networks.
The burgeoning EV market has exerted considerable pressure on the supply chains of the metals essential for vehicle batteries, including graphite, nickel, lithium and cobalt. According to the International Energy Agency, demand for some energy transition minerals is anticipated to increase more than twentyfold by 2040. This reality is reflected in spending on exploration and development for battery metals, which surged from 2020 to mid-2022.
Additionally, mineral and metal prices substantially increased after Russia invaded Ukraine in 2022, with several metal prices reaching unprecedented highs as economies around the world sought to secure alternative sources of supply. Russia is a major producer of precious, base and industrial metals and has a significant metals trade with Europe and Asia. Supply chain disruptions and economic sanctions contributed to an increase in prices for several commodities, including palladium, nickel, aluminum and potash.
However, in 2023, prices generally trended downward, with prices for commodities such as lithium and nickel seeing a collapse from their 2022 highs. The amount spent on mineral exploration and deposit appraisal activities depends largely on market conditions and commodity prices. Figure 1 shows how expenditure variations in Canada and globally have been consistent with price trends over the past decade as well as during the recent peaks.
Figure 1: Expenditures; by company type, and spending and price indices; 2014 to 2024
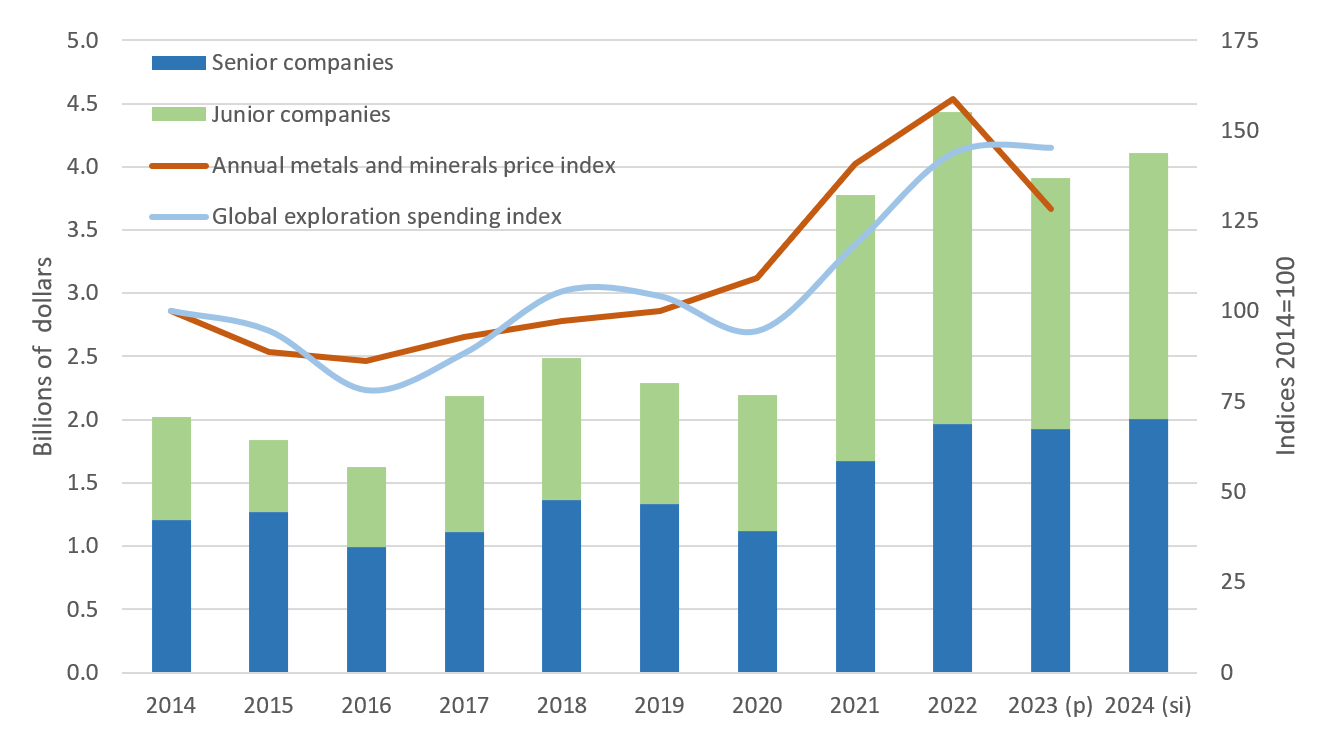
Sources: Natural Resources Canada, Institut de la statistique du Québec, Bank of Canada, S&P Global Market Intelligence
p = preliminary expenditures, si = spending intentions
Figure 1 — Text version
This bar chart shows exploration and deposit appraisal expenditures by type of company from 2014 to 2024. Each bar is divided into two segments: one for senior companies and one for junior companies. A line graph depicting the Bank of Canada’s metals and minerals price index is superimposed over the bar graph. A second line graph shows the global exploration spending index. The combined chart shows the strong correlation between metal and mineral prices and exploration and deposit appraisal spending.
Metal and mineral prices reached a cyclical peak in the early 2010s, fuelled by rapid economic expansion in China and other emerging markets. Subsequently, prices declined as supply outpaced demand. A gradual recovery began in 2016, extending into 2019, only to be disrupted in early 2020 by the economic lockdowns imposed due to the COVID-19 pandemic. Metal prices recovered later that same year and continued to increase, especially for base and clean energy metals, as EV sales continued to increase, reaching a peak in April 2022. Since then, prices have declined but remain high compared to historical averages.
Looking ahead to 2024, spending intentions for mineral exploration and deposit appraisals are anticipated to rise by 5.1% to $4.1 billion amidst expectations of central banks initiating interest rate cuts and easing financial conditions.
Gold is projected to remain Canada’s leading commodity sought, but to a lesser degree, as more exploration spending is directed toward critical minerals:
- for 2024, spending intentions in the Other metals group, which includes lithium, cobalt and rare earth elements, are expected to rise by 5.7%, following a remarkable 109% year-over-year increase in 2023
- uranium and base metals, which include critical minerals such as copper, nickel and zinc, are expected to account for 32.9% of projected investments in 2024, a significant increase from 20% in 2020
Exploration expenditures are anticipated to rise across most provinces and territories in 2024. Notably, Alberta is expected to see the most significant increase at 44.6%, followed by Northwest Territories (27.4%), Manitoba (26.2%), Nunavut (23.3%) and Ontario (20.0%). Conversely, British Columbia is projected to experience the largest decline for the second consecutive year (-28.9%), followed by Nova Scotia (-15.1%), Yukon (-10.5%) and New Brunswick (-7.6%).
In 2023, both junior exploration companies and senior mining companies decreased their exploration spending by 19% and 2%, respectively. However, in 2024, their expenditures are anticipated to rebound, with junior companies expected to increase spending by 6% and senior companies by 4%.
Exploration spending by junior companies tends to be more volatile due to their reliance on equity markets and susceptibility to broader market and economic conditions.
Although exploration spending is at historically high levels, operating and development costs are increasing, limiting the reach of each exploration dollar. Factors such as a tight labour market, elevated fuel prices, general inflationary pressures and persistent supply chain disruptions caused by the COVID-19 pandemic have collectively strained the finances of mining and exploration companies in recent years. Canada’s consumer price index surged to 6.8% in 2022, a record increase in over 20 years, and continued to rise by gaining 3.9% in 2023.
While senior companies have partially offset the impacts of rising costs with increased revenues from higher prices, junior companies remain vulnerable to inflationary pressures, particularly during periods of declining equity markets.
Figure 2: Exploration spending and inflation rate, 2006 to 2023
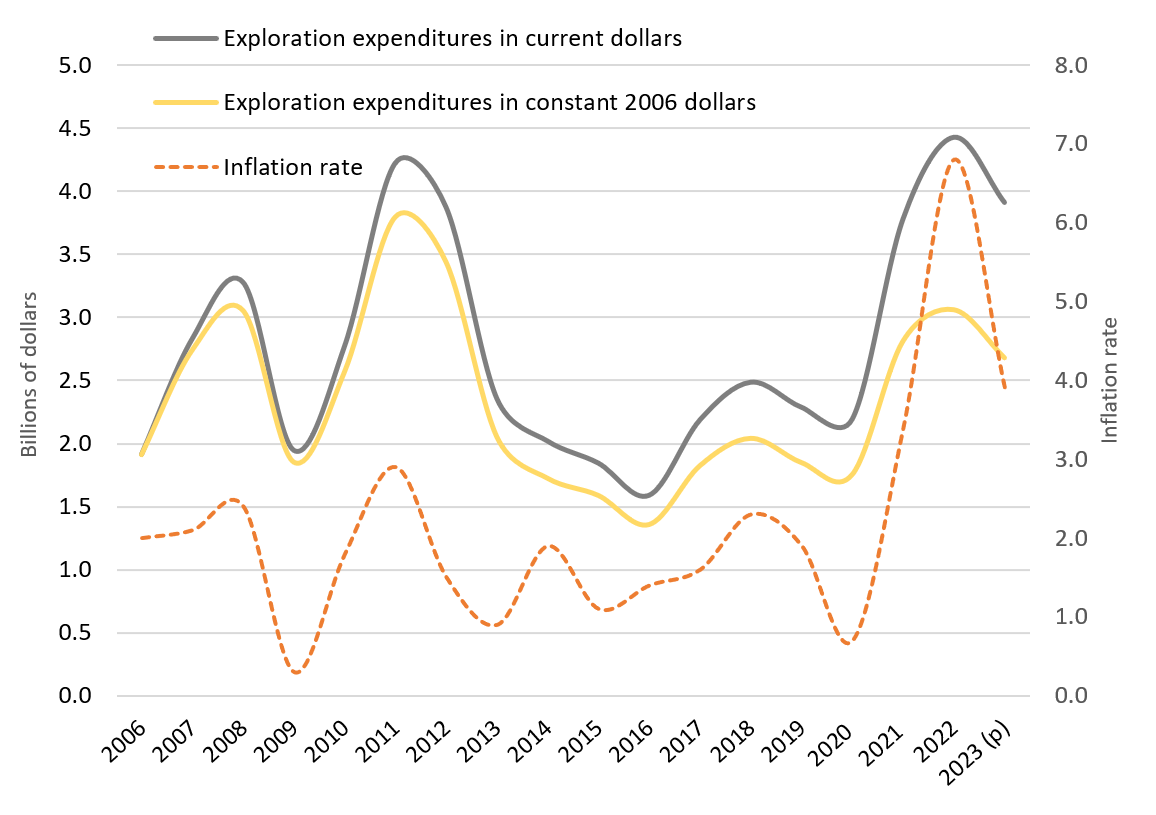
Sources: Natural Resources Canada, Institut de la statistique du Québec, Statistics Canada
p = preliminary expenditures
Figure 2 — Text version
This line graph shows the trend in exploration expenditures in constant and current dollars in relation to the evolution of the inflation rate. The graph illustrates the impact of inflation on exploration and deposit appraisal expenditures.
Junior and senior companies
In 2023, the number of junior companies decreased by 5% to 675, coinciding with a 19% decline in their combined spending, which amounted to $2.0 billion. Despite this downturn, expenditures remain historically high. The reported spending intentions of junior companies in 2024 indicate an increase of 6% to $2.1 billion, reflecting an anticipated easing of financing conditions and declining interest rates.
Canada is well known for its large contingent of junior companies, which usually have no operating revenue and rely on equity financing. They tend to be small and flexible and to specialize in higher-risk, early-stage exploration activities. Although some junior companies might develop a project on their own or with a partner, senior companies (producers) are traditionally more likely to bring a mine into production.
In 2023, junior exploration companies accounted for 77% of the active projects in Canada and 82% of the project operators.
Although junior companies are characterized as small and flexible, the 19 largest-spending junior companies had expenditures of over $20 million each and accounted for about 42% of total expenditures by junior companies in 2023.
Expenditures by junior companies soared to historic highs, surpassing $2 billion in 2007, 2008 and 2011, but plummeted to a 12-year low of $576 million in 2015. They began to recover in 2016, with spending surging 70% to $1.1 billion in 2017. Spending remained stable until 2020, when values almost doubled, subsequently maintaining or surpassing the $2 billion mark.
In 2023, exploration spending by junior companies declined to $2.0 billion, down 19% from $2.5 billion in 2022. The 2022 value is the highest to be recorded since Natural Resources Canada began collecting data. It represented 51% of total exploration spending for the year in Canada.
Given their reliance on equity markets for financing, the spending levels of junior companies are heavily influenced by broader market and economic conditions. Consequently, their spending tends to be more volatile compared to senior companies, which benefit from operating revenues sustaining their exploration endeavours.
Over the past decade, junior companies have accounted for an average of 46% of total spending, but the proportion has varied by year from 31% to 56%.
The distribution of spending between company types is also impacted by various factors, including:
- overall budget allocations
- financing availability
- junior companies selling projects to senior companies
- junior companies transitioning to senior status as their projects move from development to production phases
These occurrences can significantly influence overall results, particularly when involving top-spending projects or companies.
In 2023, the number of senior companies increased by 7% to 158, despite their combined spending experiencing a 2% decrease to $1.9 billion. However, spending by senior companies is projected to increase by 4% in 2024, reaching $2.0 billion.
Provinces and territories
In 2023, Ontario had the highest exploration expenditures, followed by Quebec then British Columbia. Together, these three provinces accounted for about 62% of total exploration expenditures for the year and are anticipated to continue to lead exploration spending in 2024.
Figure 3: Expenditures, by province and territory, 2022 to 2024
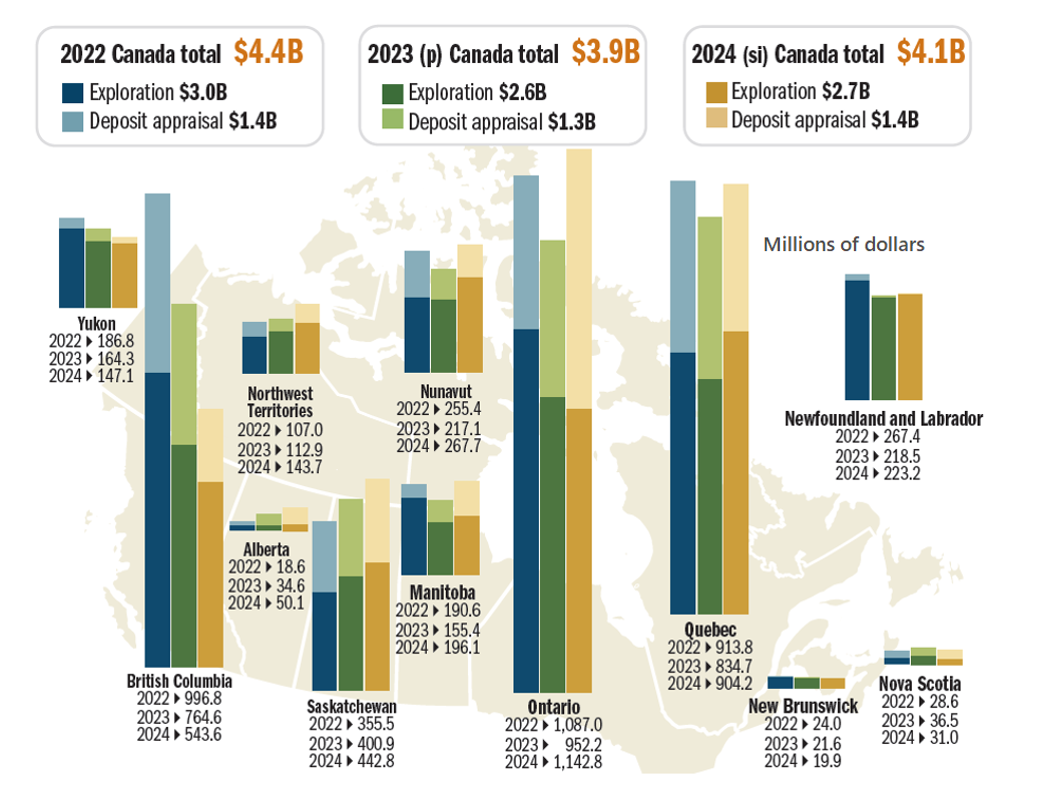
Sources: Natural Resources Canada, Institut de la statistique du Québec
B = billion, p = preliminary expenditures, si = spending intentions
Figure 3 — Text version
This map of Canada with superimposed bar charts shows expenditures for exploration and deposit appraisals by provinces and territories for the years 2022, 2023 and 2024. Each bar has one segment for exploration and another for deposit appraisals. The top spending jurisdictions in 2024 are expected to be Ontario ($1.1 billion), Quebec ($904 million) and British Columbia ($544 million).
Exploration spending decreased in the majority of jurisdictions in 2023, with just four jurisdictions experiencing spending increases (i.e., Alberta, Nova Scotia, Saskatchewan and Northwest Territories).
Spending intentions for 2024 indicate a generally more favourable outlook with increases in all jurisdictions except British Columbia, Nova Scotia, Yukon and New Brunswick.
Mineral commoditiesFootnote 2
Precious metals (mainly gold) remained the leading commodity group in 2023 and accounted for 49% of total spending, down from 58% the year before. This shift was caused by a redirection of funds from precious metals to critical minerals, a trend expected to persist in 2024, with spending on precious metals projected to decrease to 48% of total expenditures.
Despite this decline, precious metals continued to be the most sought-after commodity group in every Canadian jurisdiction in 2023, except for Manitoba (base metals), Saskatchewan (uranium), Alberta (other metals) and Northwest Territories (base metals).
The onset of the COVID-19 pandemic resulted in uncertainty, driving gold prices to record levels surpassing US$2,000 per ounce by mid-2020. Although gold prices retreated as economies gradually reopened, geopolitical tensions such as the Russian invasion of Ukraine and the economic uncertainty that ensued, as well as record buying by central banks, have pushed gold prices back above US$2,000 per ounce since early 2022.
In 2024, spending on precious metals is anticipated to increase by 2%, with notable upticks in Ontario (+$81 million), Quebec (+$71 million) and Manitoba (+$27 million), while a decline is expected in British Columbia (-$121 million). This surge in 2024 may be attributed to gold’s status as a hedge against inflation and a safe-haven commodity during periods of economic uncertainty. Additionally, decreasing global reliance on the U.S. dollar as the world’s reserve currency may further bolster interest for precious metals.
Figure 4: Expenditures, by commodity group, 2023 (p)
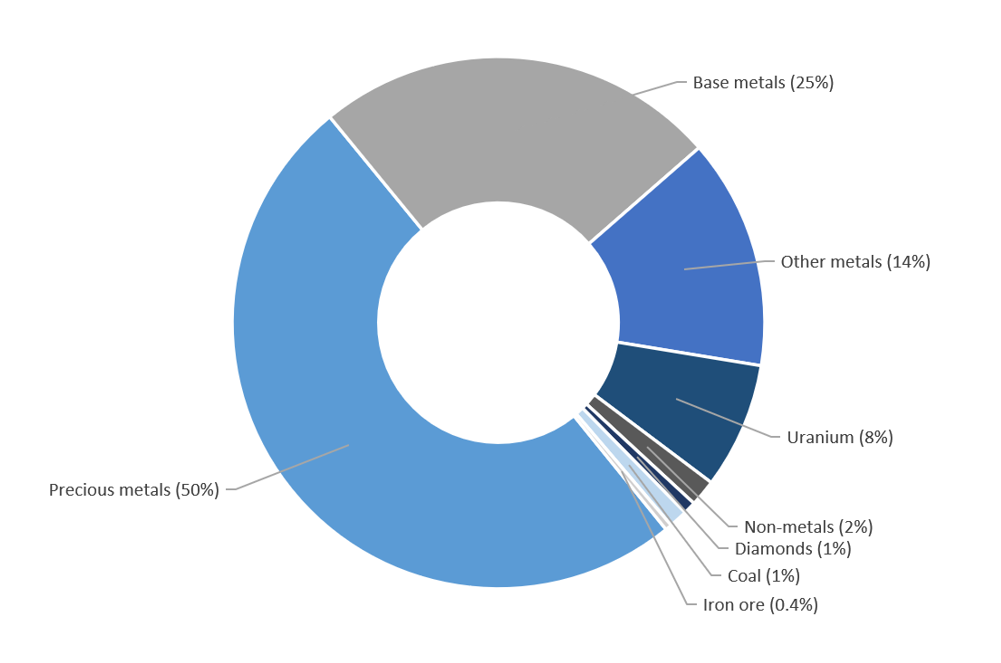
Sources: Natural Resources Canada, Institut de la statistique du Québec
p = preliminary expenditures
Figure 4 — Text version
This pie chart shows exploration and deposit appraisal expenditures by commodity group for 2023. Expenditures for exploration and deposit appraisals for the precious metals group accounted for 50% of the total, followed by base metals (25%), other metals (14%), uranium (8%), non-metals (2%), diamonds (1%), coal (1%) and iron ore (0.4%).
In terms of exploration, base metals (copper, lead, nickel and zinc) ranked as the second most important commodity group, comprising 25% of total spending in 2023.
Exploration and deposit appraisal expenditures for base metals decreased by 18% to $959 million in 2023. However, spending is forecasted to rebound by 9% in 2024. Exploration spending targeting base metals has closely followed the price trends of these commodities, trending upwards from 2017 to 2022 but declining in 2023.
Other metals, including cobalt, lithium and rare earth elements, have garnered significant attention in recent years due to their utilization in advanced technologies and energy storage. Spending on exploration and deposit appraisal activities for other metals has mirrored changes in cobalt and lithium prices, which saw increases in 2017 and 2018, but declined in 2019 and through most of 2020 due to abundant supply.
However, the price dynamics of battery minerals shifted toward the end of 2020, beginning a recovery driven by robust anticipated demand from the global transition to a green economy. The price of carbonate lithium, for instance, soared from about $12,000 per tonne at the beginning of 2021 to over $100,000 per tonne by the end of 2022, before plummeting over 70% in 2023 due to oversupply.
Spending on exploration and deposit appraisal activities for other metals saw a remarkable 109% increase in 2023, reaching $584 million, with a projected 7% increase in 2024.
The uranium market has experienced a remarkable resurgence recently, with spending on exploration and deposit appraisal activities surging by 90% to $238 million in 2022, and an additional 26% in 2023 to $300 million, marking the highest level in more than 20 years. This positive trend is expected to persist into 2024, with a projected 3% increase. Saskatchewan stands out as the primary destination for uranium exploration spending in Canada, with its significant uranium reserves and established mining infrastructure making it a key focal point for uranium exploration activities in the country.
The renewed interest in uranium stems from rising global demand for nuclear energy as a low-carbon alternative and growing recognition of uranium’s role in reducing greenhouse gas emissions. Furthermore, the Russian invasion of Ukraine has heightened global energy security concerns, prompting a re-evaluation of nuclear energy policies, particularly in the European Union.
Figure 5: Expenditures, by mineral commodity, 2022 to 2024
Sources: Natural Resources Canada, Institut de la statistique du Québec
p = preliminary expenditures, si = spending intentions
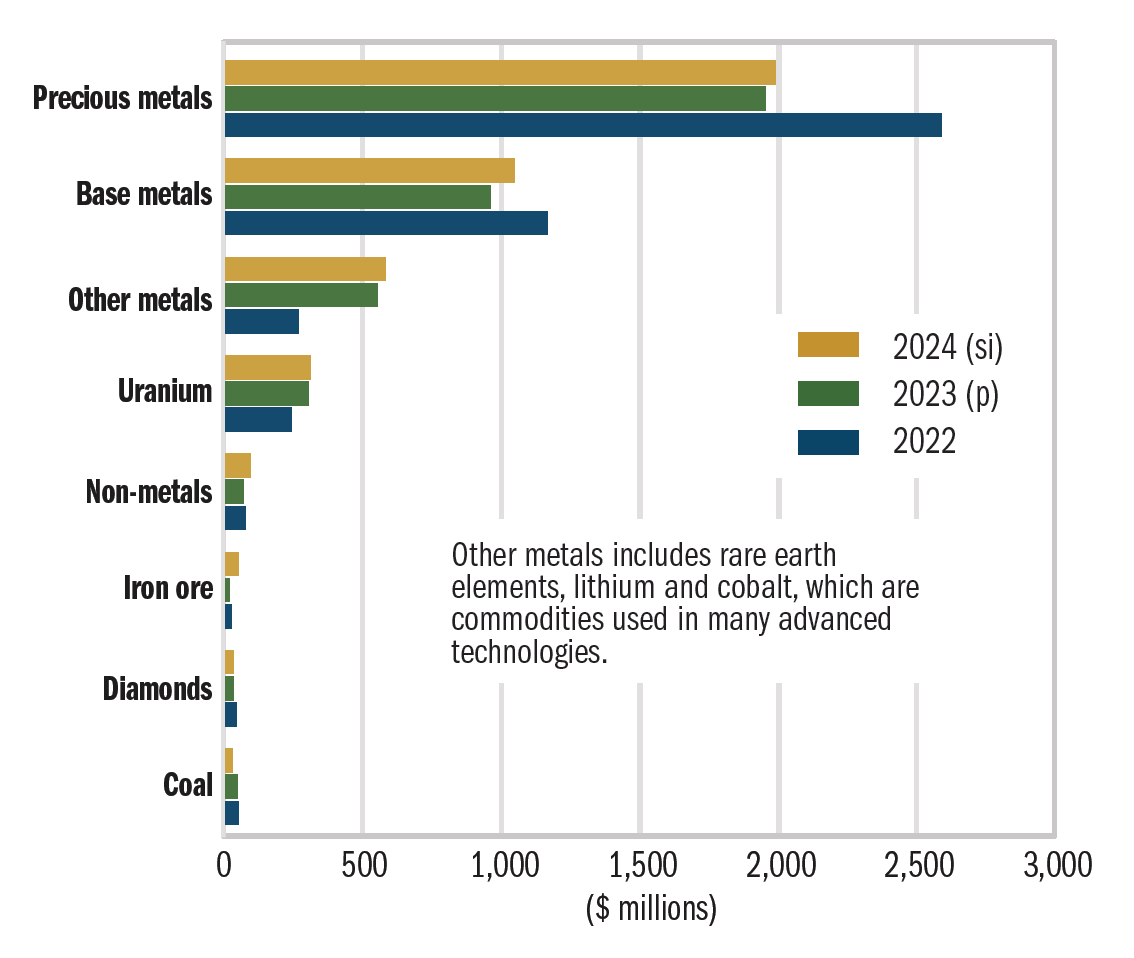
Figure 5 — Text version
This bar chart shows expenditures for exploration and deposit appraisals by mineral commodity from 2022 to 2024. Each year features bars representing precious metals, base metals, other metals, uranium, non-metals, iron ore, diamonds and coal. Notably, expenditures for precious metals, including gold, consistently surpass those of all other mineral commodity groups across the entire period.
As of April 2024, Quebec boasts 48 of the 115 active lithium projects, making it a significant player in lithium exploration. Additionally, exploration activities for lithium were carried out in Ontario, Alberta, Saskatchewan, Manitoba, Northwest Territories and Newfoundland and Labrador. Quebec and Ontario also dominated in projects involving cobalt, followed by New Brunswick, Saskatchewan, British Columbia, Newfoundland and Labrador and Northwest Territories. Cobalt is often sought alongside other commodities as it is mostly produced as a coproduct of base metal mining in Canada.
Expenditures for exploration and deposit appraisals for non-metals, primarily potash, experienced a 12% decline to $63 million in 2023. This commodity group has been on a downward trajectory since peaking at $314 million in 2012. Despite reaching an eight-year low in 2020, potash prices surged after the Russian invasion of Ukraine. Canada stands as the leading global producer of potash, followed by Russia and Belarus. Spending intentions for 2024 are expected to rise by 40% to $89 million, reflecting significant investments in mine construction over the past decade, particularly with the approval by the BHP mining company of the Jansen Stage 1 potash project in Saskatchewan, anticipated to begin production in late 2026.
The diamonds market faced exacerbated challenges due to the COVID-19 pandemic, leading to a 25% reduction in related spending on exploration and deposit appraisal activities in 2023. These expenditures dropped to a 20-year low of $30 million. Saskatchewan was the second-largest jurisdiction in exploration spending in 2023 after Northwest Territories, representing 26% of total diamond exploration spending in Canada. Spending intentions in 2024 point to a further 5% decline to a low of $29 million.
Expenditures for exploration and deposit appraisals for coal, encompassing both metallurgical and thermal coal, decreased by 5% to $44 million in 2023, marking the sixth consecutive decline. Spending intentions for 2024 indicates a decrease of 47% to $24 million.
Exploration and development activities for iron ore saw a notable uptick in 2021, particularly in Quebec, reaching a high of $98 million. This surge contrasted sharply with the peak of $359 million recorded in 2012, which was followed by a steep decline to just $9 million in 2017. Despite a 24% decrease to $15 million in 2023, spending is anticipated to rebound to $48 million in 2024 as prices began to recover in early 2023. The primary regions hosting Canada’s iron ore projects are Quebec, Nunavut and Newfoundland and Labrador.
In March 2021, the Government of Canada released its list of 31 critical minerals that are considered vital for the sustainable economic success of Canada and its allies. Since then, the Government of Canada has made substantial financial commitments in budgets and launched The Canadian Critical Minerals Strategy. Provinces and territories also consider critical minerals development to be a strategic priority. Several jurisdictions have developed critical minerals strategies, while others are in the process of developing policies or are actively promoting this sector.
In 2023, $1.9 billion was spent on exploration and deposit appraisals for critical minerals (except helium), constituting 45% of the total spending for all minerals. These expenditures for critical minerals increased by 7% between 2022 and 2023. Although spending intentions for 2024 are not available for critical minerals as a distinct category, it is anticipated that expenditures will continue to rise in 2024, with growth observed in groups encompassing critical minerals such as other metals, base metals and uranium.
Figure 6: Expenditures, by major critical minerals, 2021 to 2023
Sources: Natural Resources Canada, Institut de la statistique du Québec
p = preliminary expenditures
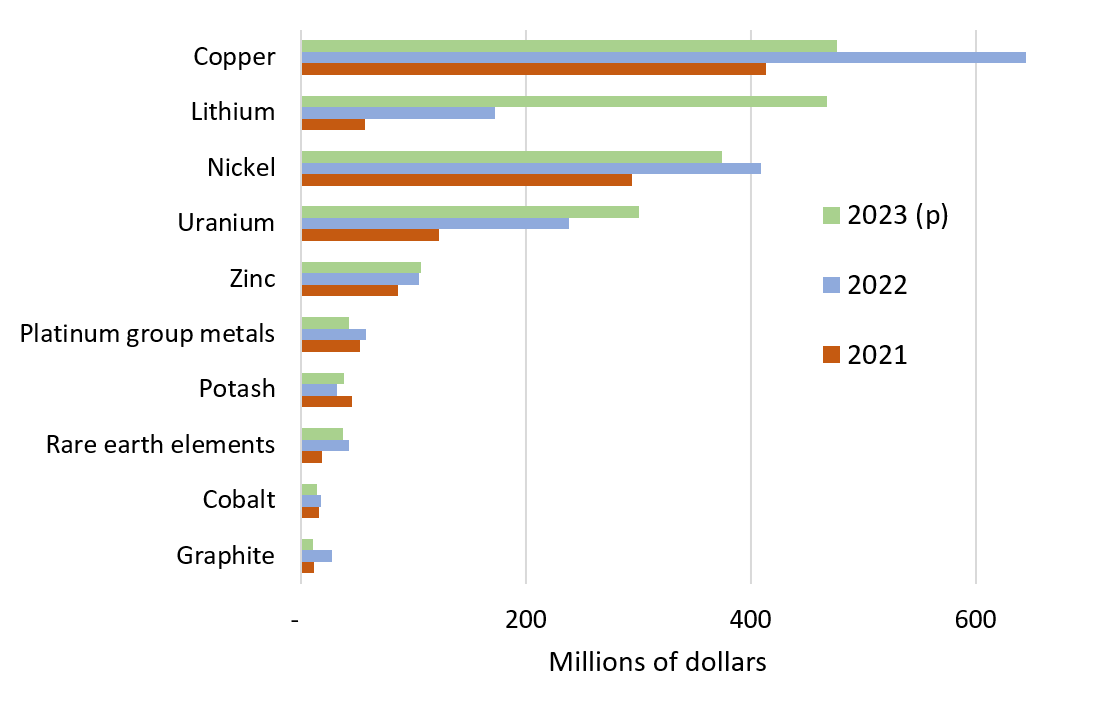
Figure 6 — Text version
This bar chart shows expenditures for exploration and deposit appraisals for major critical minerals from 2021 to 2023. For each year, there are bars for copper, lithium, nickel, uranium, zinc, platinum group metals, potash, rare earth elements, cobalt and graphite.
Work phases are parts of the stages of exploration and development:
- exploration includes grassroots (early) exploration until it is confirmed that the project is economically feasible
- deposit appraisals turn into detailed work included in feasibility studies, which inform a production decision
- mine complex development (not covered in this report) includes the construction of mines, plants and associated infrastructure
On‑mine‑site activities offer insight on efforts by producing companies to extend the life of existing operations.
Work phases
In 2023, total expenditures for exploration and deposit appraisals saw declines in both off-mine sites, which are not located on the premises of a producing mine, and on-mine sites, where a mine is operational:
- Off-mine-site expenditures
- Exploration — 16% decrease
- Deposit appraisals — 3% decrease
- On-mine-site expenditures
- Exploration — 4% decrease
- Deposit appraisals — 26% decrease
Off-mine-site exploration spending fell by $403 million to $2.2 billion in 2023. Only three jurisdictions experienced increases: Nova Scotia (+$75 million), Saskatchewan (+$35 million) and Alberta (+$0.9 million). Significant decreases were observed in British Columbia (-$163 million), Ontario (-$136 million), Quebec (-$58 million), Northwest Territories (-$55 million) and Manitoba (-$41 million).
On-mine-site exploration spending decreased by $15 million to $402 million in 2023. The most notable decreases were in Manitoba (-$11 million) and Ontario (-$8 million). However, substantial increases occurred in British Columbia (+$14 million) and Nunavut (+$8 million).
For 2024, spending intentions indicate an 8% increase in exploration spending and a 14% increase in deposit appraisal spending for off-mine sites. Conversely, expenditures for exploration and deposit appraisals for on-mine sites are anticipated to decline in 2024 by 15% and 40%, respectively.
Figure 7: Expenditures, by on-mine and off-mine sites, 2023 to 2024
Sources: Natural Resources Canada, Institut de la statistique du Québec
B = billion
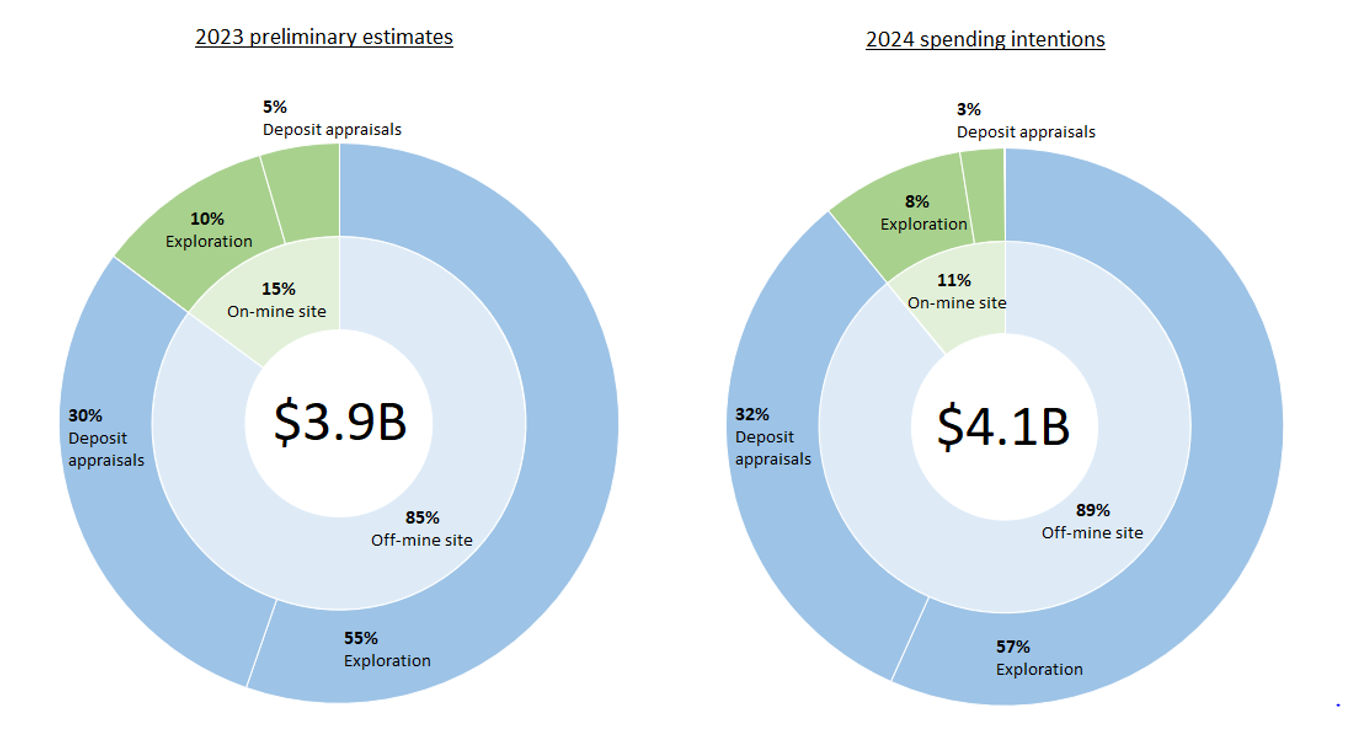
Figure 7 — Text version
These two pie charts show expenditures for exploration and deposit appraisals for on-mine and off-mine sites for 2023 and 2024. For each year, most of the spending was for exploration.
Notes
- Totals may be different because of rounding.
- Values are in Canadian dollars.