
On this page
Relief

Relief map of Canada
Date of publication: 2024
Download the map (PDF, 103 MB)
This map shows Canada’s relief and bathymetry. Canada's relief is shown by a colour ramp to show elevation ranges. Water depth (ocean bathymetry) is shown using colour tints.
Download previous editions:
- Relief map of Canada. 6th edition, 2010 (ZIP – PDF/JPG, 15.46 MB)
- Canada, Relief. 5th edition, 1986 (PDF, 4.44 MB)
- Relief. 4th edition, 1973 (PDF, 3.46 MB)
- Bathy-Orography – Canada. 3rd edition, 1958 (PDF, 2.05 MB)
- Physical East Sheet. 2nd edition, 1915 (PDF, 1.79 MB)
- Physical West Sheet. 2nd edition, 1915 (PDF, 1.9 MB)
- Relief Map East Sheet. 1st edition, 1906 (PDF, 2.07 MB)
- Relief Map West Sheet. 1st edition, 1906 (PDF, 1.27 MB)
Water
Drainage areas

Major Drainage Areas of Canada
Date of publication: 2024
Download the map (PDF, 151 MB)
The Major Drainage Areas (MDA), as portrayed in this map, are part of the Standard Drainage Area Classification (SDAC) which was developed by Natural Resources Canada, in partnership with Statistics Canada, and Environment and Climate Change Canada.
Download previous editions:
- Drainage Basins. 6th edition, 2010 (ZIP – PDF/JPG, 4.76 MB)
- Canada, Drainage Basins. 5th edition, 1985 (PDF, 10.39 MB)
- Drainage Basins. 4th edition, 1972 (PDF, 2.78 MB)
- Drainage Basins and River Flow. 3rd edition, 1958 (PDF, 1.59 MB)
- Drainage Basins. 2nd edition, 1915 (PDF, 1.64 MB)
- Drainage Basins. 1st edition, 1906 (PDF, 1.57 MB)
Watersheds
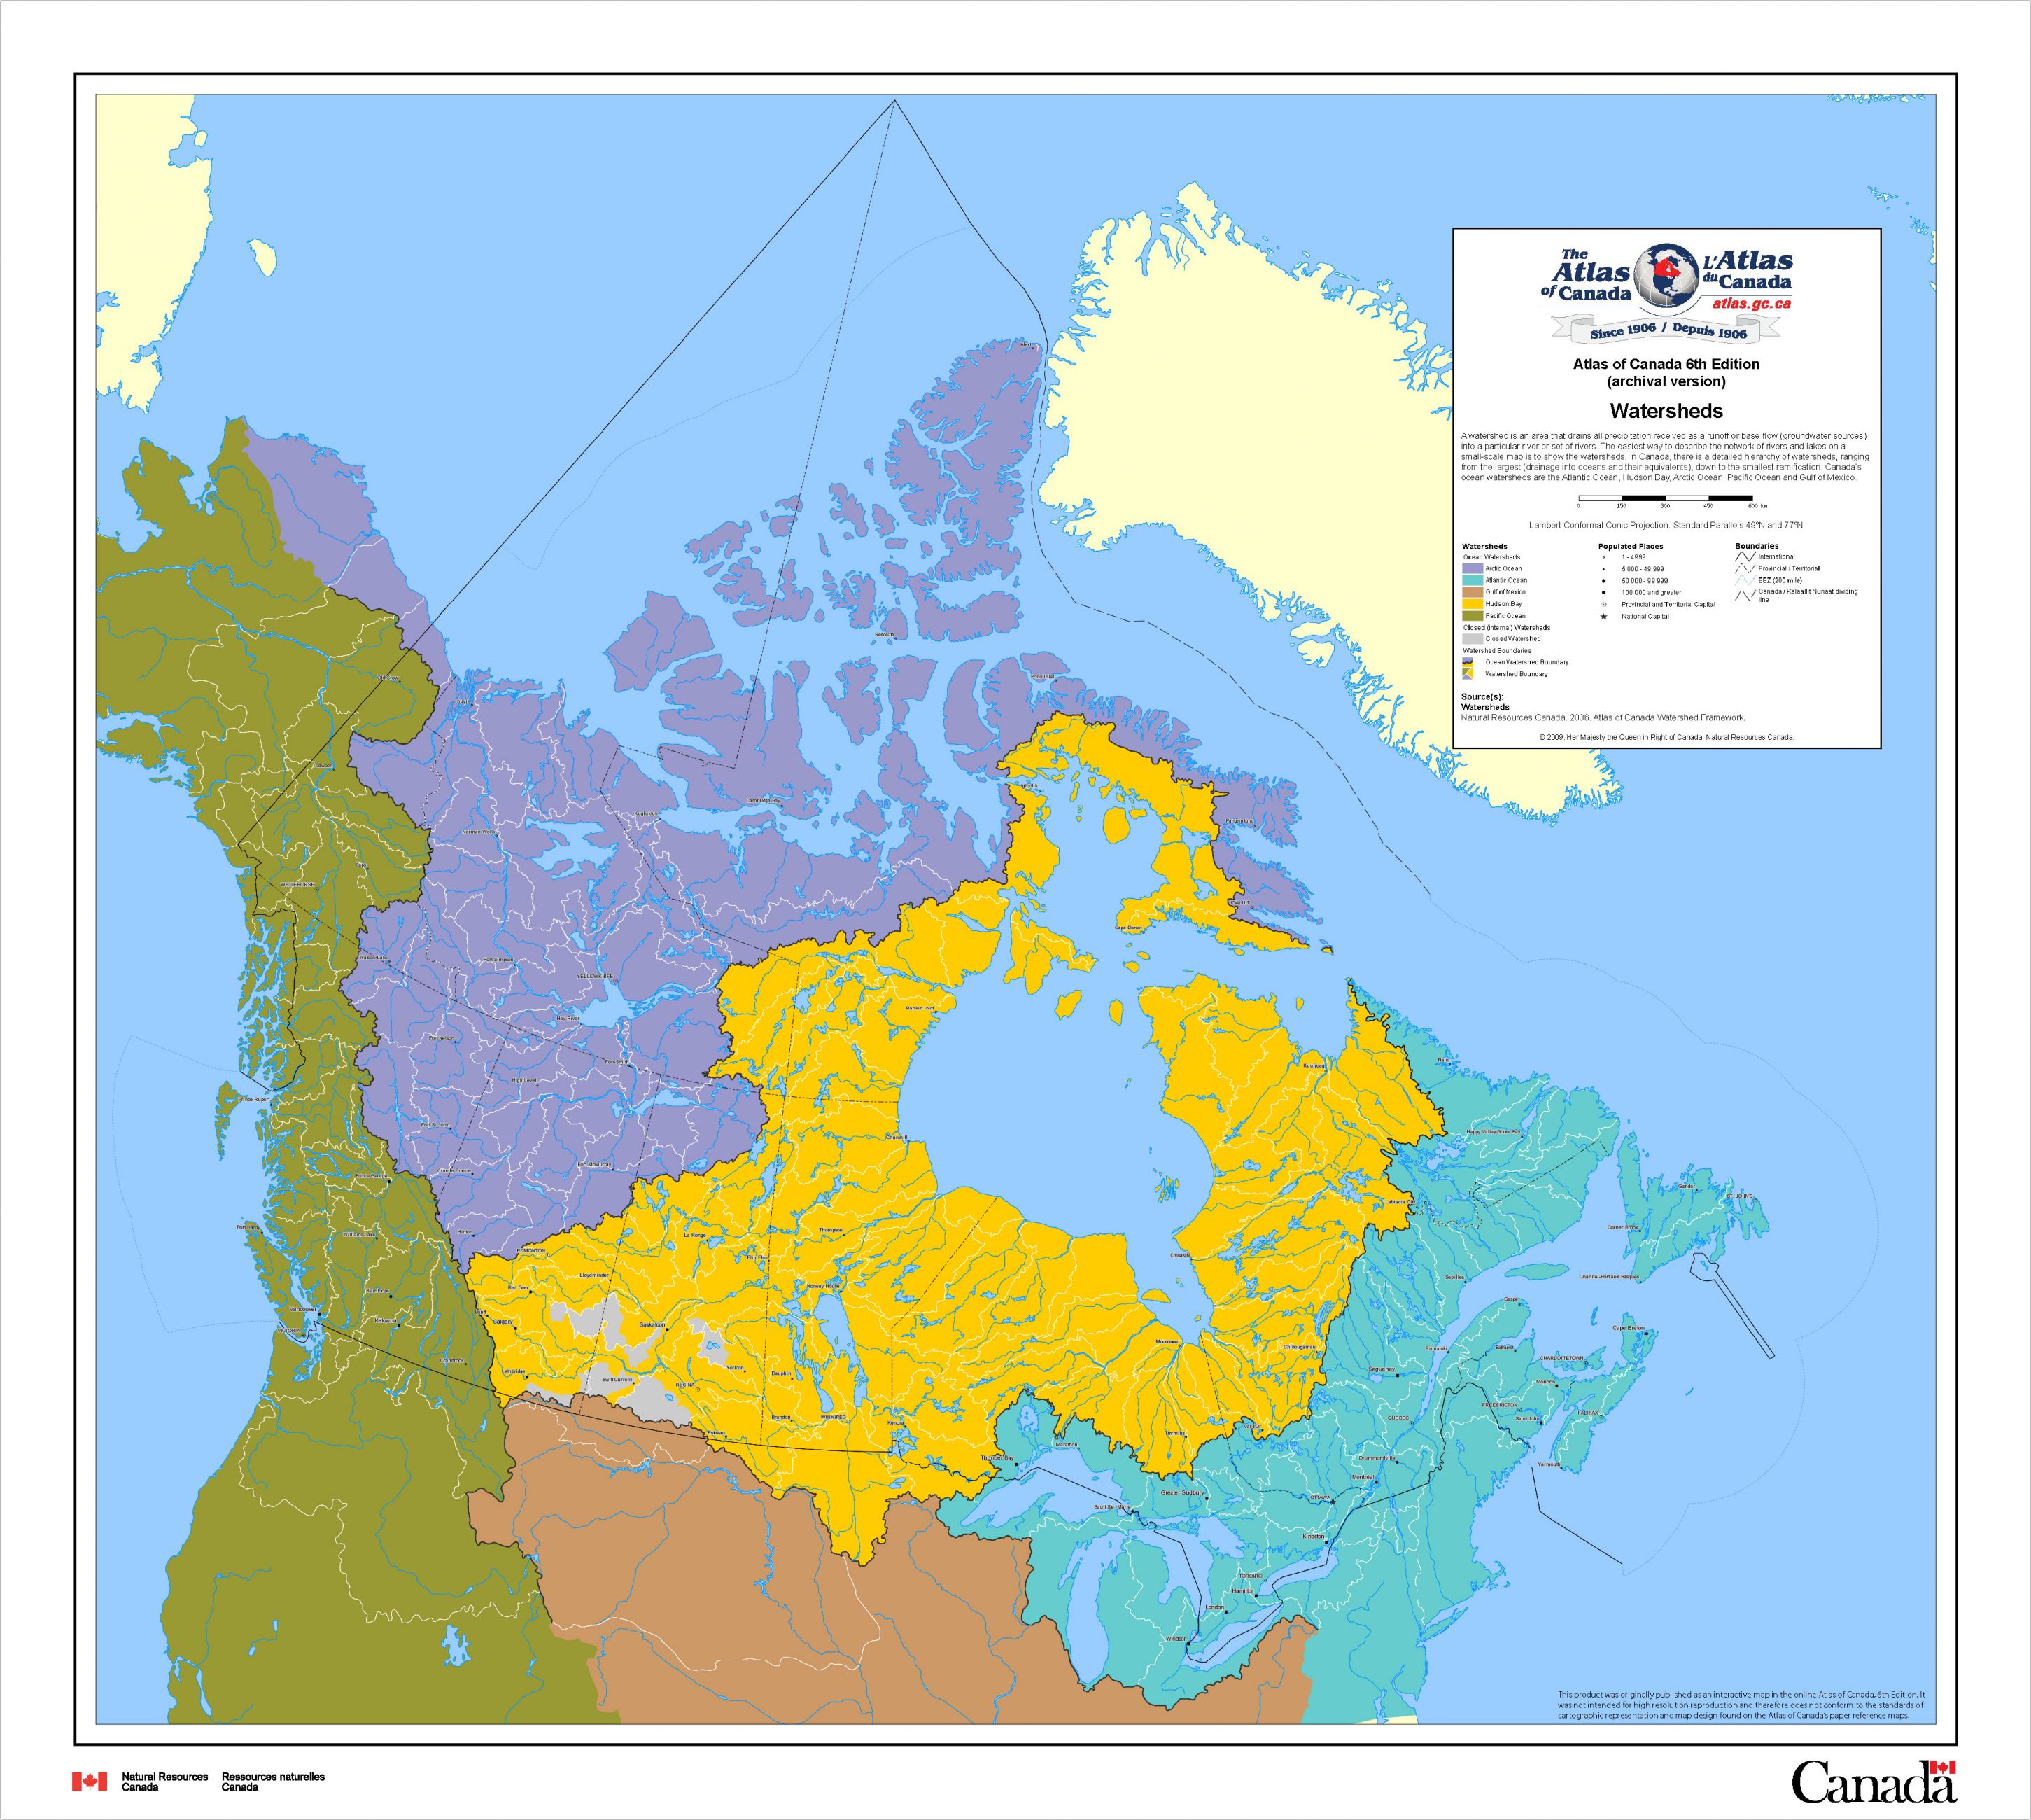
Watersheds
Date of publication: 2010, 6th edition
Download map (ZIP – PDF/JPG, 4.62 MB)
View the metadata on Open Government
This map shows Canada’s network of watersheds. A watershed is an area that drains all precipitation received as a runoff or base flow (groundwater sources) into a river or set of rivers. In Canada, there is a detailed hierarchy of watersheds, ranging from the largest (drainage into oceans and their equivalents), down to the smallest. Canada’s ocean watersheds are the Atlantic Ocean, Hudson Bay, Arctic Ocean, Pacific Ocean and Gulf of Mexico.
Wetlands

Distribution of Freshwater – Wetlands
Date of publication: 2010, 6th edition
Download map (ZIP – PDF/JPG, 8.92 MB)
View the metadata on Open Government
This map shows the distribution of freshwater wetlands throughout Canada. Wetlands are lands permanently or temporarily submerged or permeated by water and characterized by plants adapted to saturated-soil conditions. Wetlands are the only ecosystem designated for conservation by international convention; they absorb the impact of hydrologic events, filter sediments and toxic substances, supply food and essential habitat for many species, and more. Their location depends on local factors of drainage, topography, and surface material.
Download previous editions:
Biogeography
Satellite image
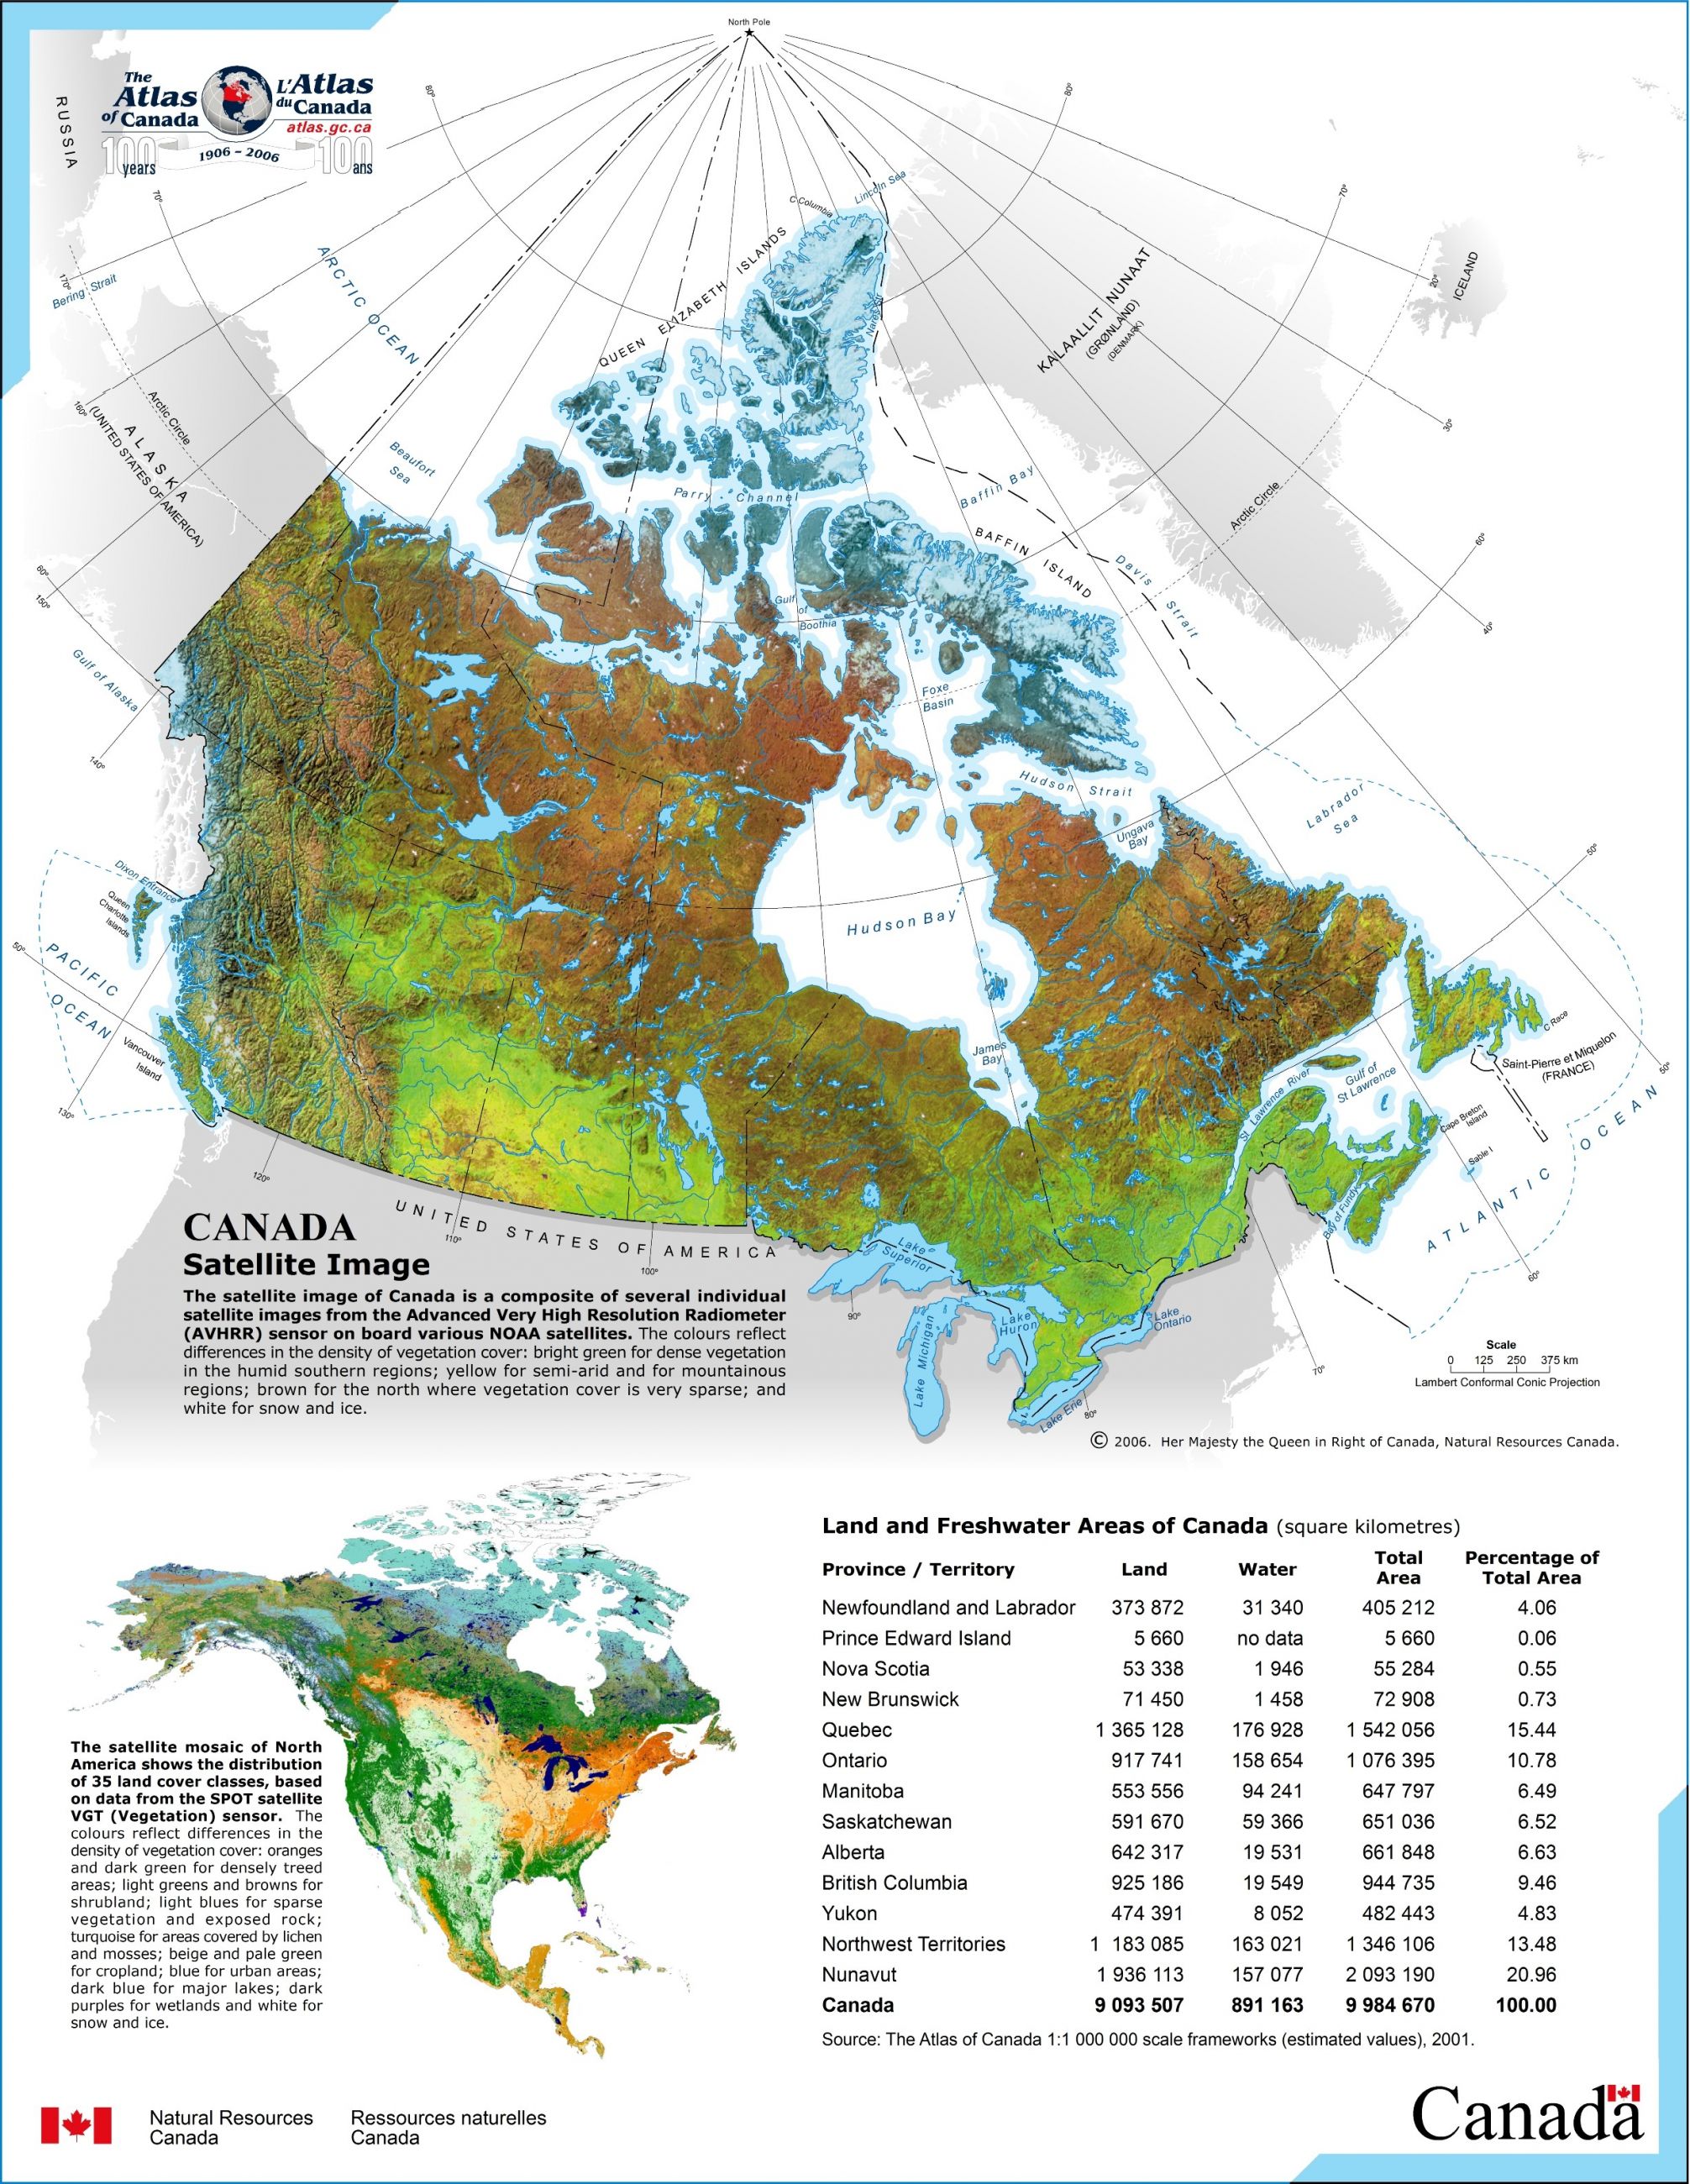
Satellite Image
Date of publication: 2006, 6th edition
View the metadata on Open Government
This map is a composite of several individual satellite images from the Advanced Very High-Resolution Radiometer (AVHRR) sensor on board various National Oceanic and Atmospheric Administration (NOAA) Satellites. The colours reflect differences in vegetation cover density: bright green for dense vegetation in humid southern regions; yellow for semi-arid and for mountainous regions; brown for the north where vegetation cover is very sparse; and white for snow and ice. An inset map shows a satellite image mosaic of North America with 35 land cover classes, based on data from the SPOT satellite VGT (vegetation) sensor.
Download previous editions:
Land cover

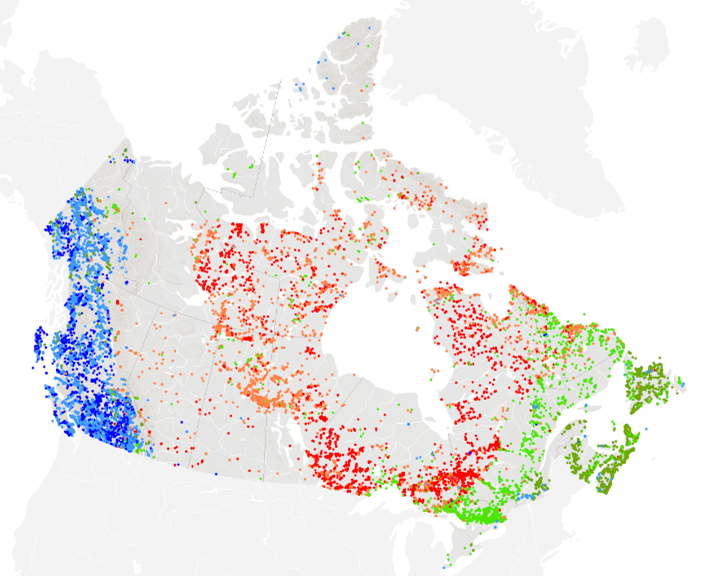
2020 Land Cover of Canada
Date of publication: 2025
The Canada Centre for Mapping and Earth Observation (CCMEO) has used satellite imagery to create a land cover map of Canada at a resolution of 30 metres. This map is part of the 2010, 2015, 2020 Land Cover Map series.
Download previous editions:
Plant hardiness zones
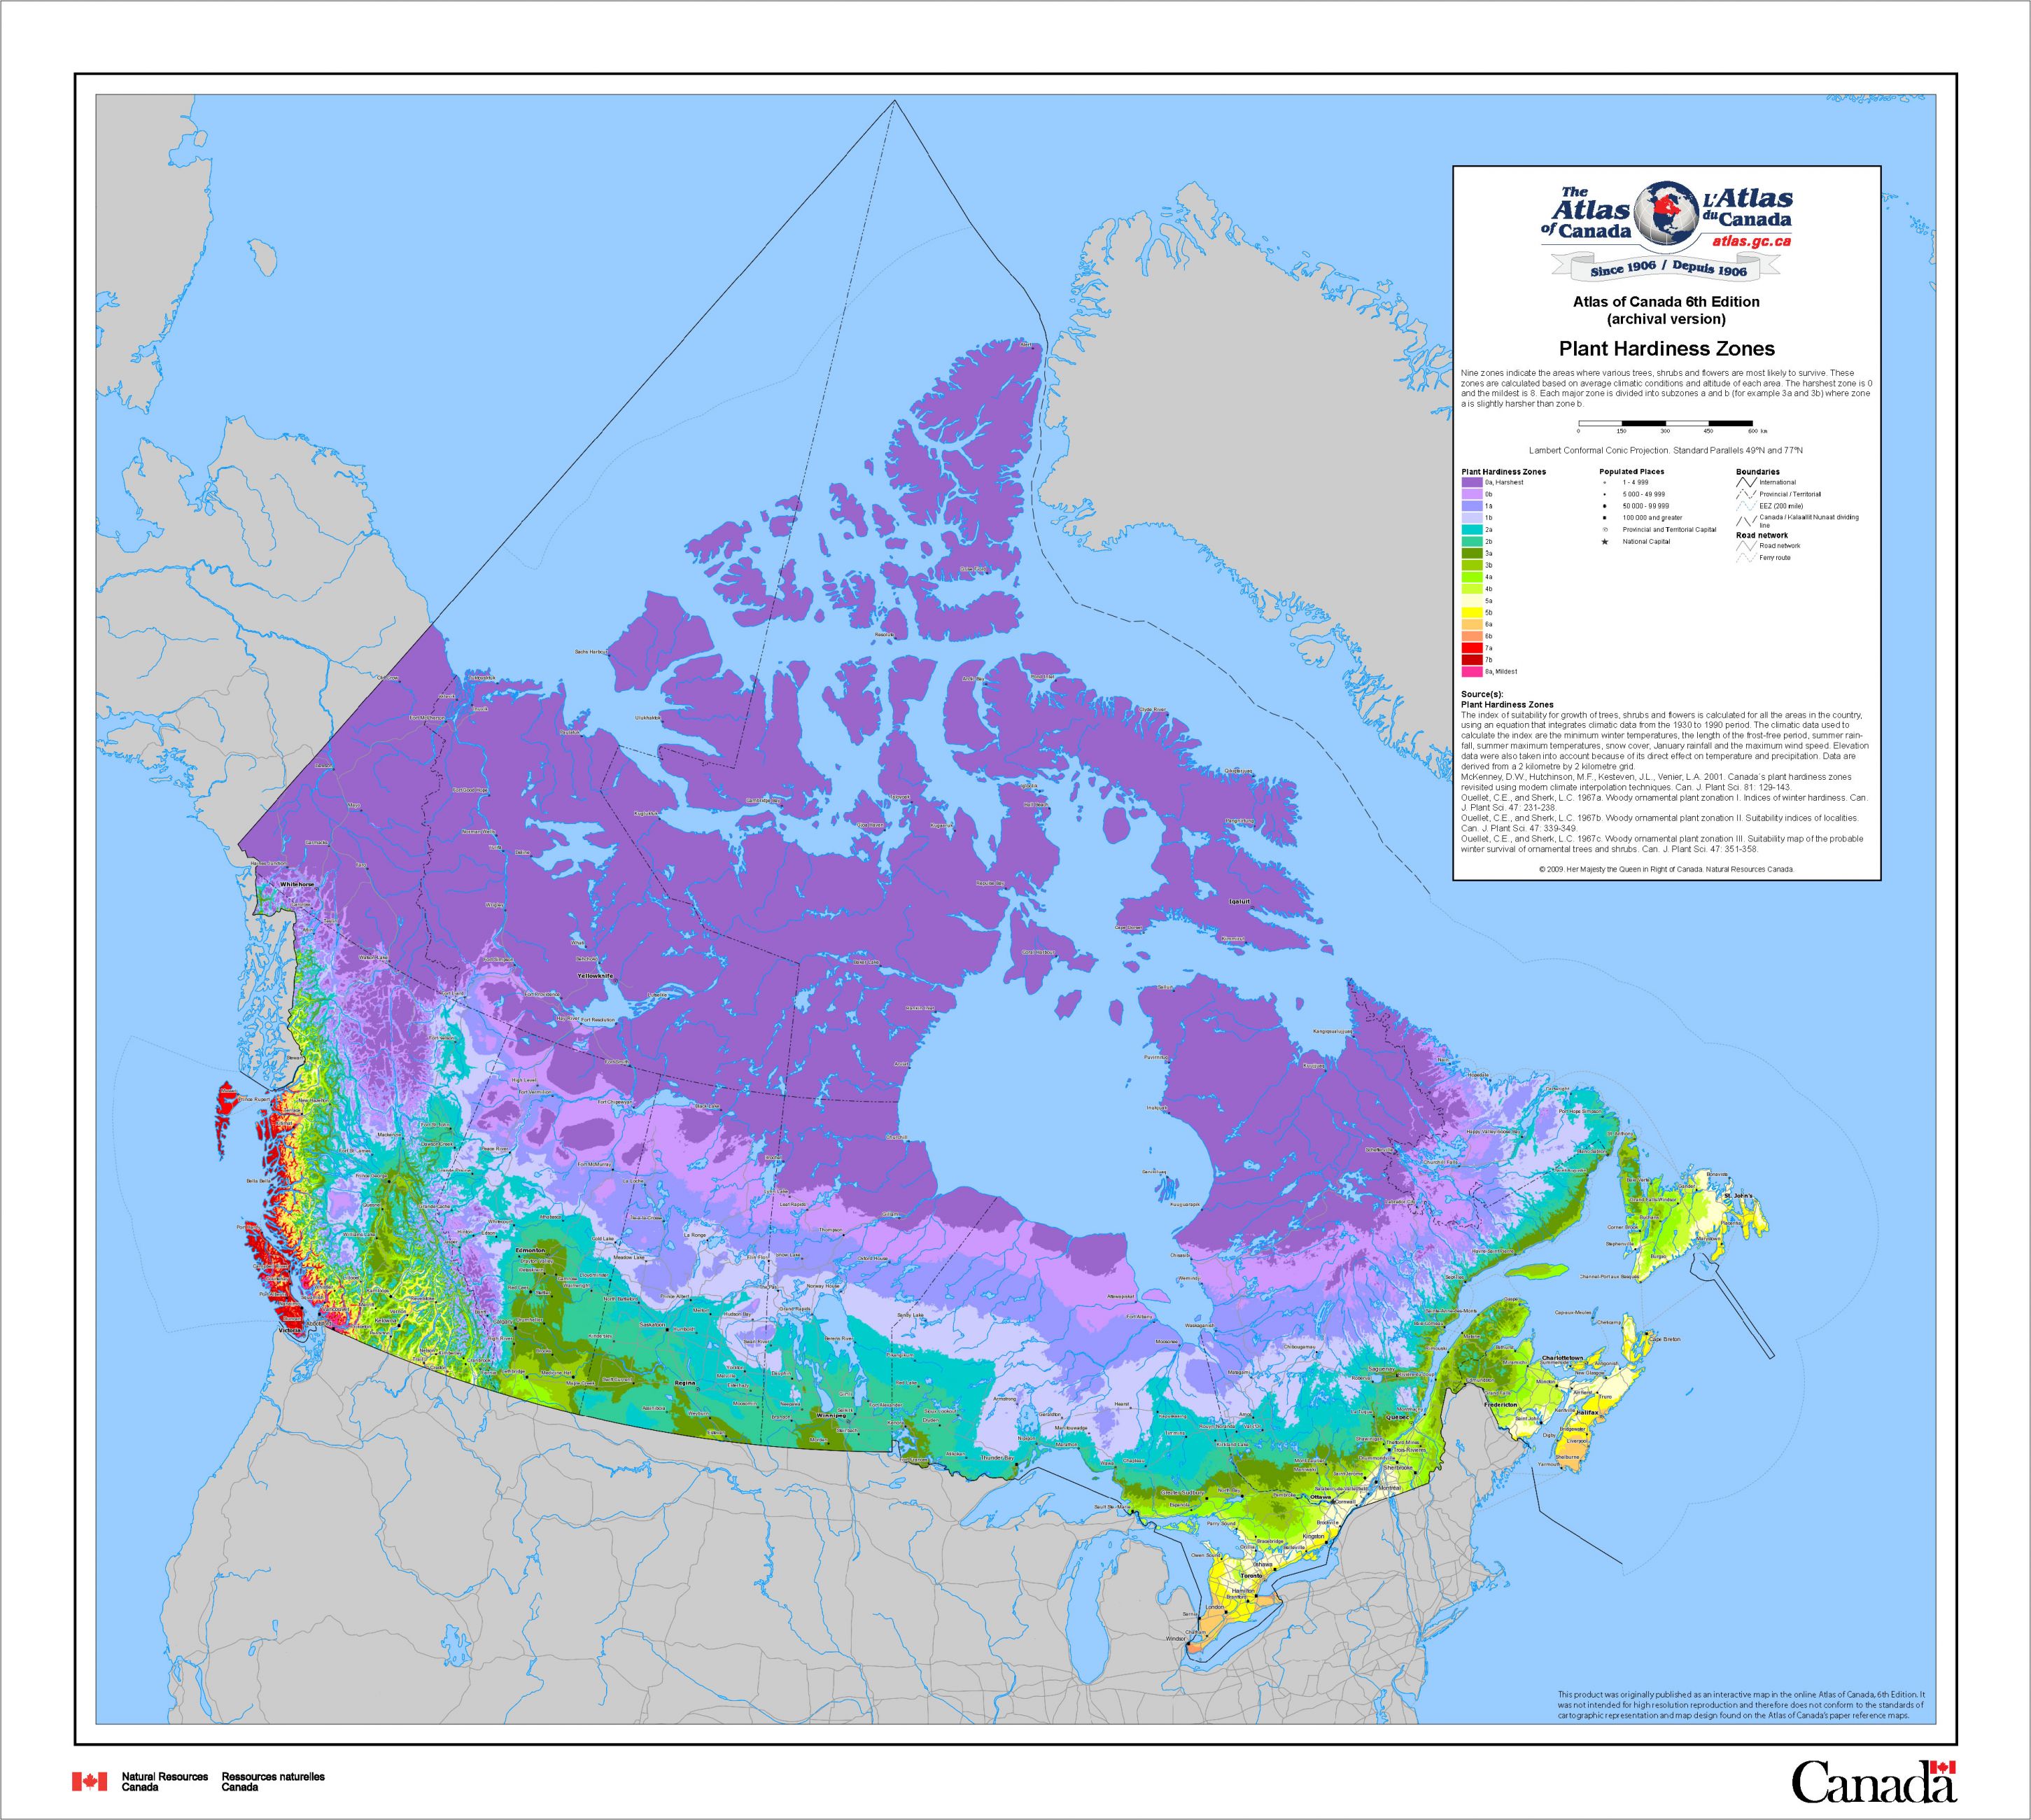
Plant Hardiness Zones
Date of publication: 2010, 6th edition
Download map (ZIP – PDF/JPG, 5.48 MB)
View the metadata on Open Government
This map shows nine zones where various trees, shrubs and flowers are most likely to survive. These zones are calculated based on average climatic conditions and altitude of each area. The harshest zone is 0 and the mildest is 8. Each major zone is divided into subzones a and b (for example 3a and 3b) where zone a is slightly harsher than zone b.
Terrestrial ecozones
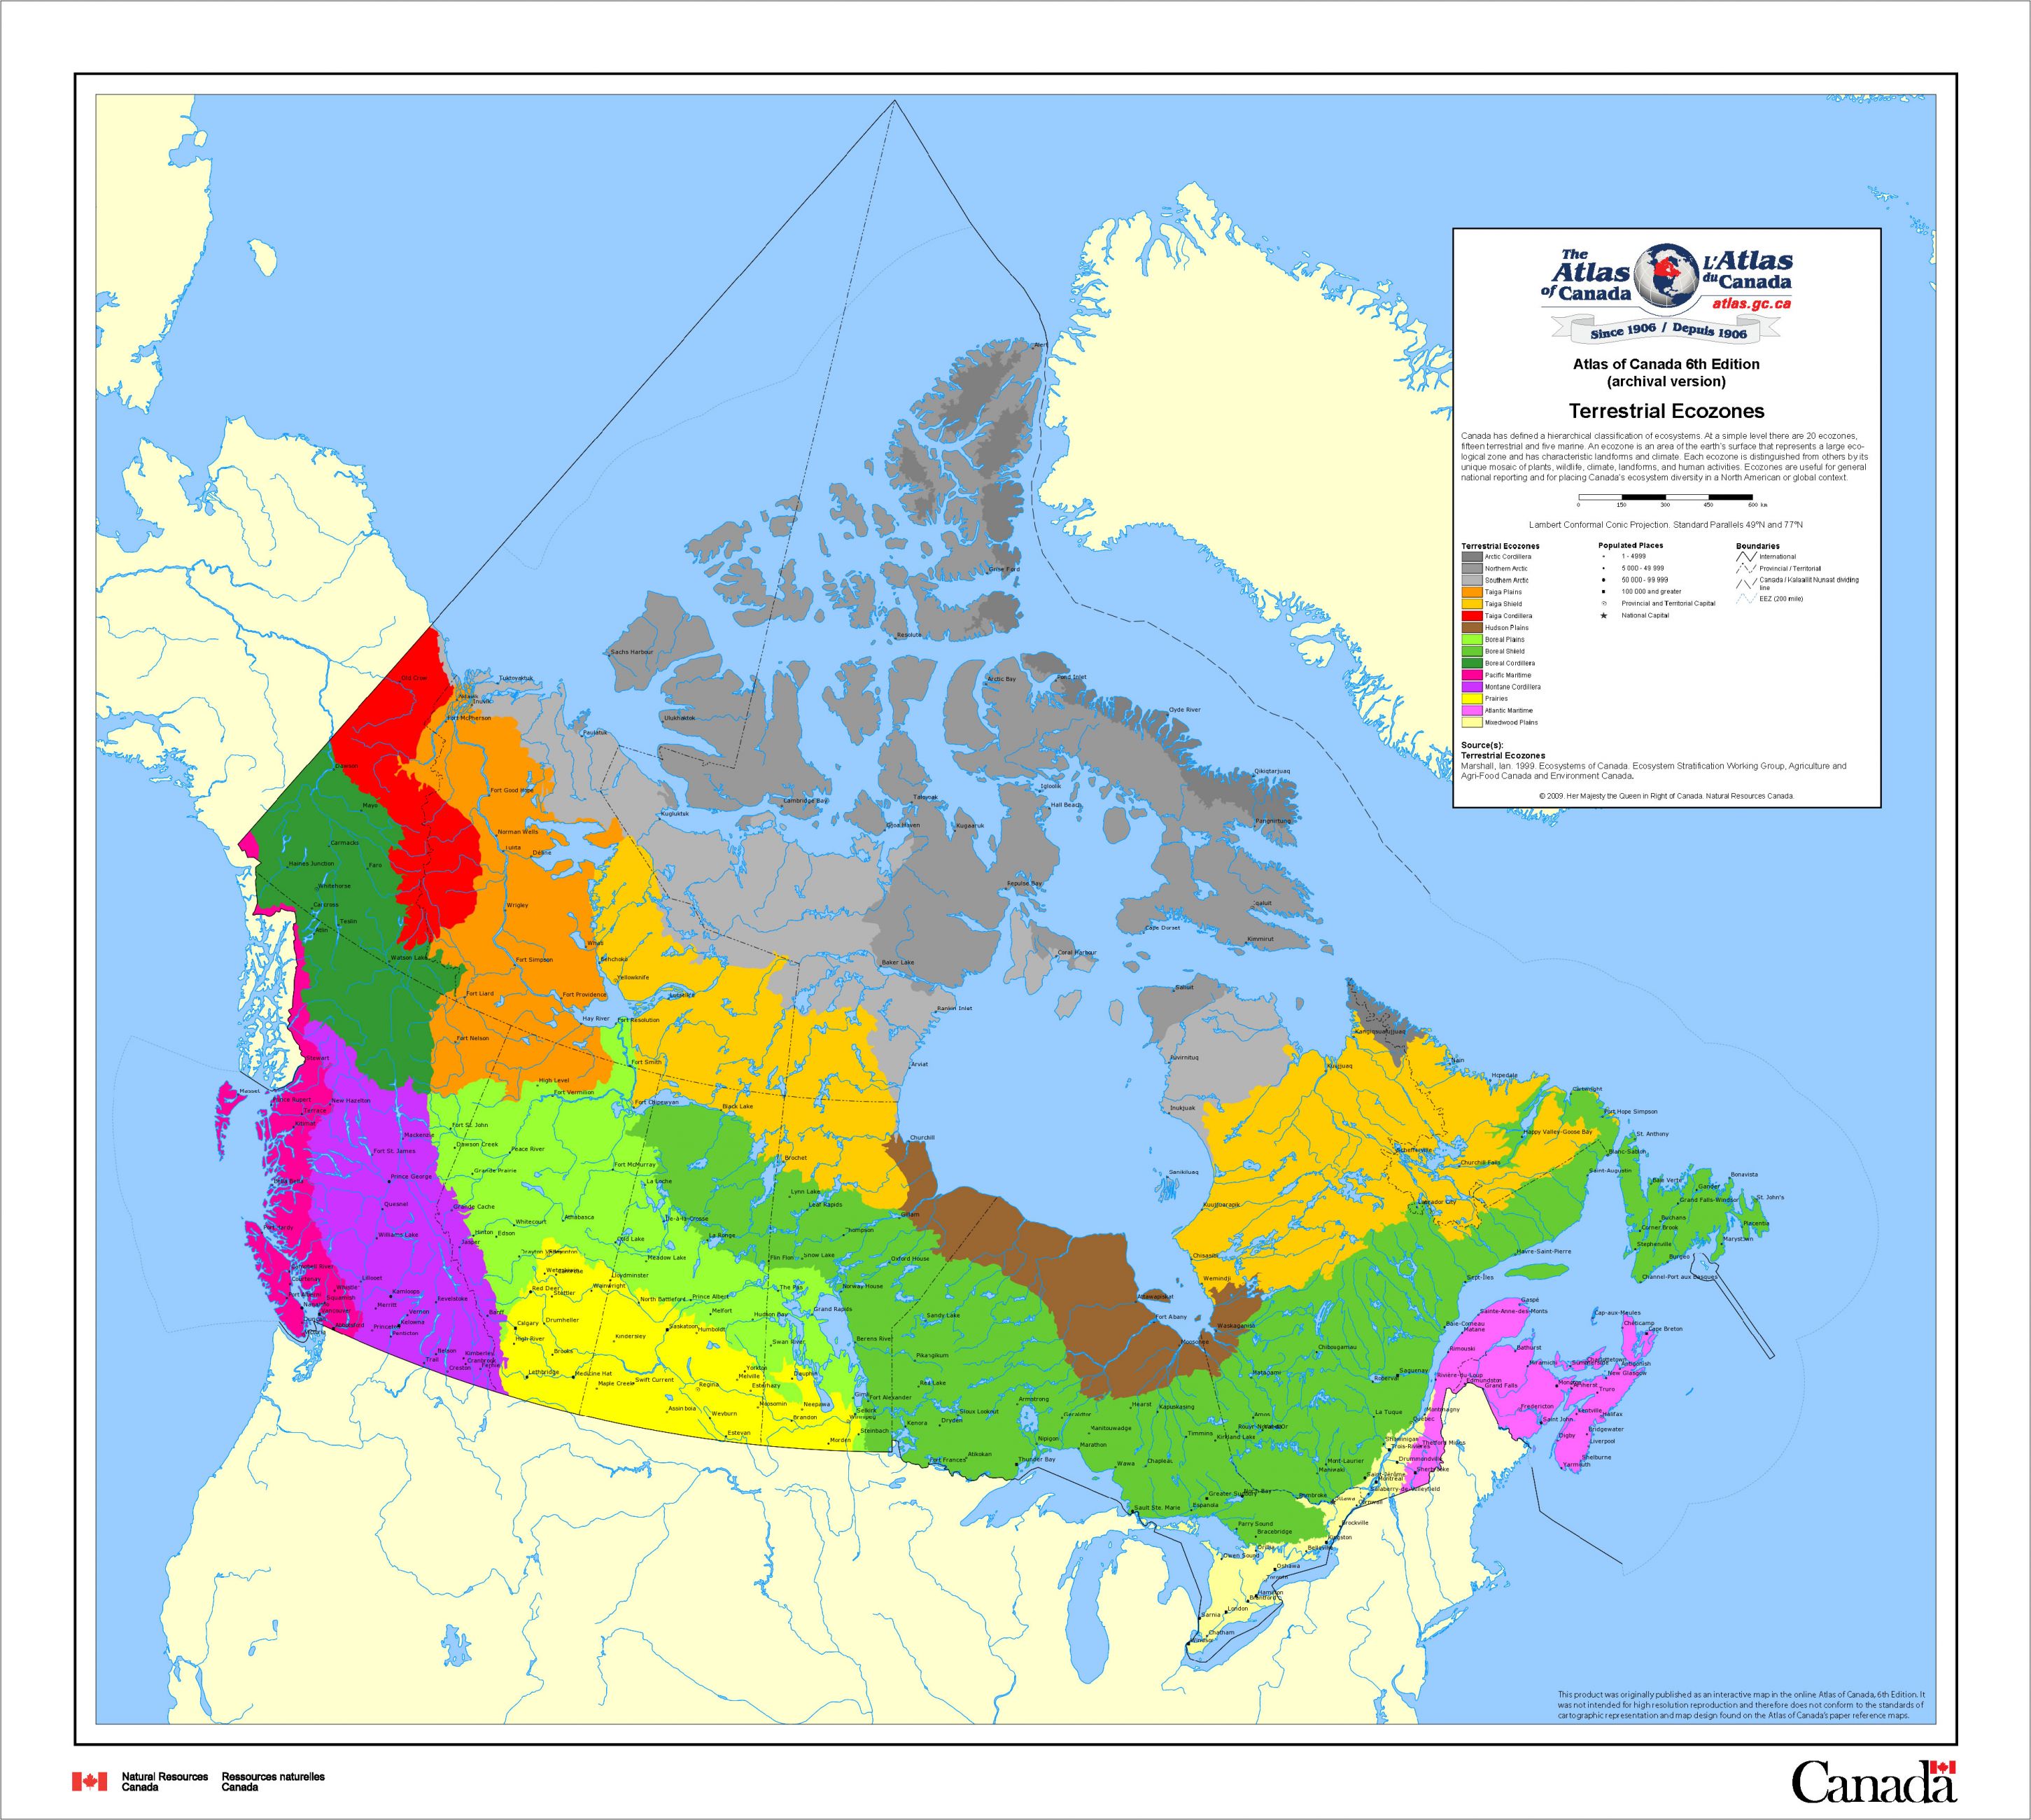
Terrestrial Ecozones
Date of publication: 2010, 6th edition
Download map (ZIP – PDF/JPG, 4.28 MB)
View the metadata on Open Government
This map shows the terrestrial ecozones of Canada. An ecozone is an area of the Earth’s surface that represents a large ecological zone and has characteristic landforms and climate. There are 20 basic ecozones: fifteen terrestrial and five marine. Each ecozone is distinguished from others by its unique mosaic of plants, wildlife, climate, landforms, and human activities. Ecozones are useful for general national reporting and for placing Canadas ecosystem diversity in a North American or global context.
Download previous editions:
Geomorphology
Physiographic Regions
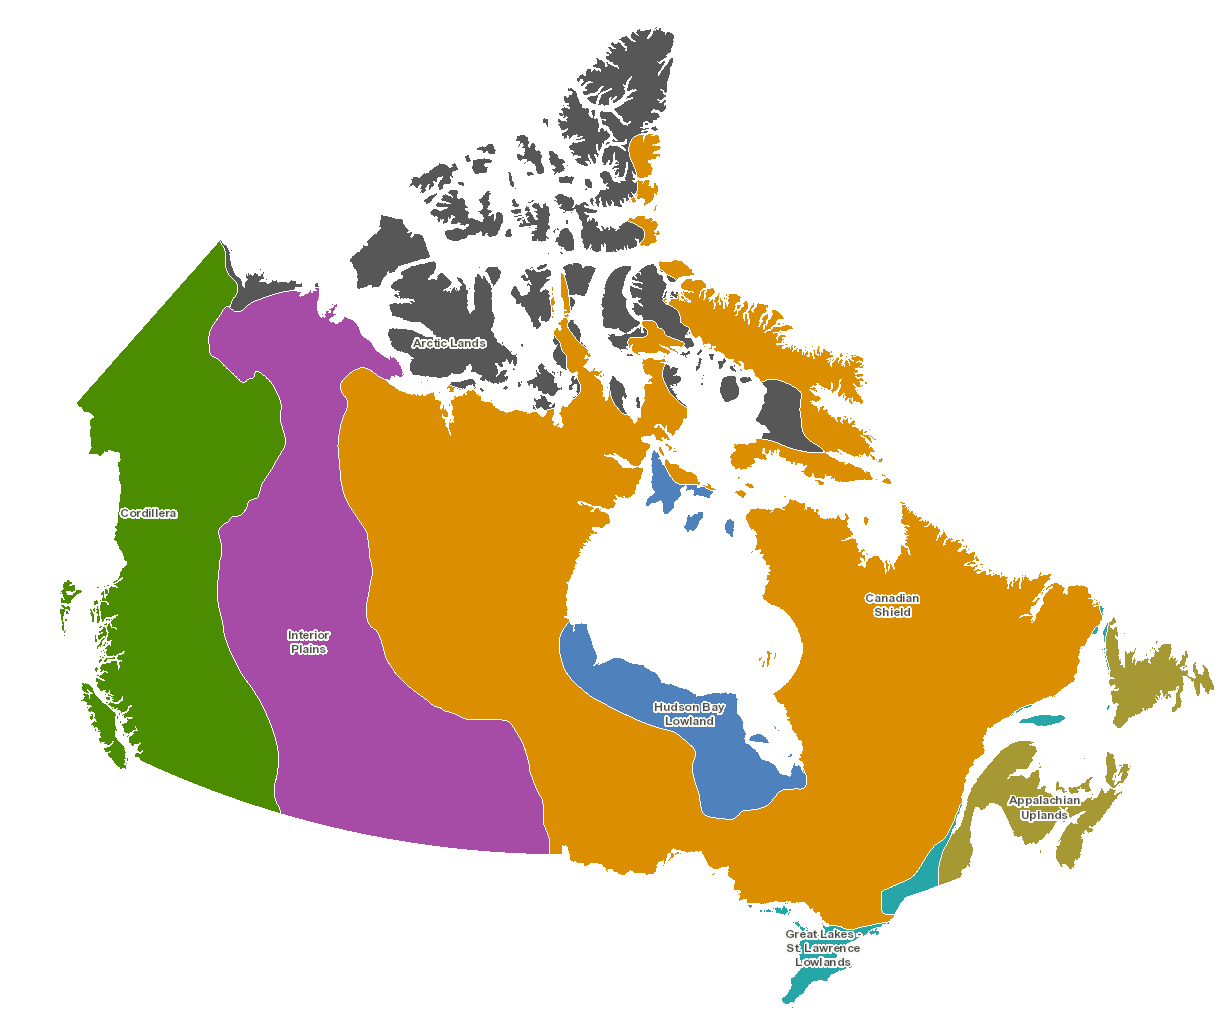
Physiographic Regions of Canada
Date of publication: 2019
View the metadata on Open Government
This map shows Canada’s physiographic regions, each of which has its own topography and geology. Physiographic regions are large areas that share similar relief and landforms shaped by common geomorphic processes and geological history. Physiographic regions are often used to describe Canada’s geography to show regional differences in climate, vegetation, population and the economy. This map shows the location of seven physiographic regions, twenty-one sub-regions and their divisions with accompanying descriptive images and text.
Download previous editions:
Permafrost
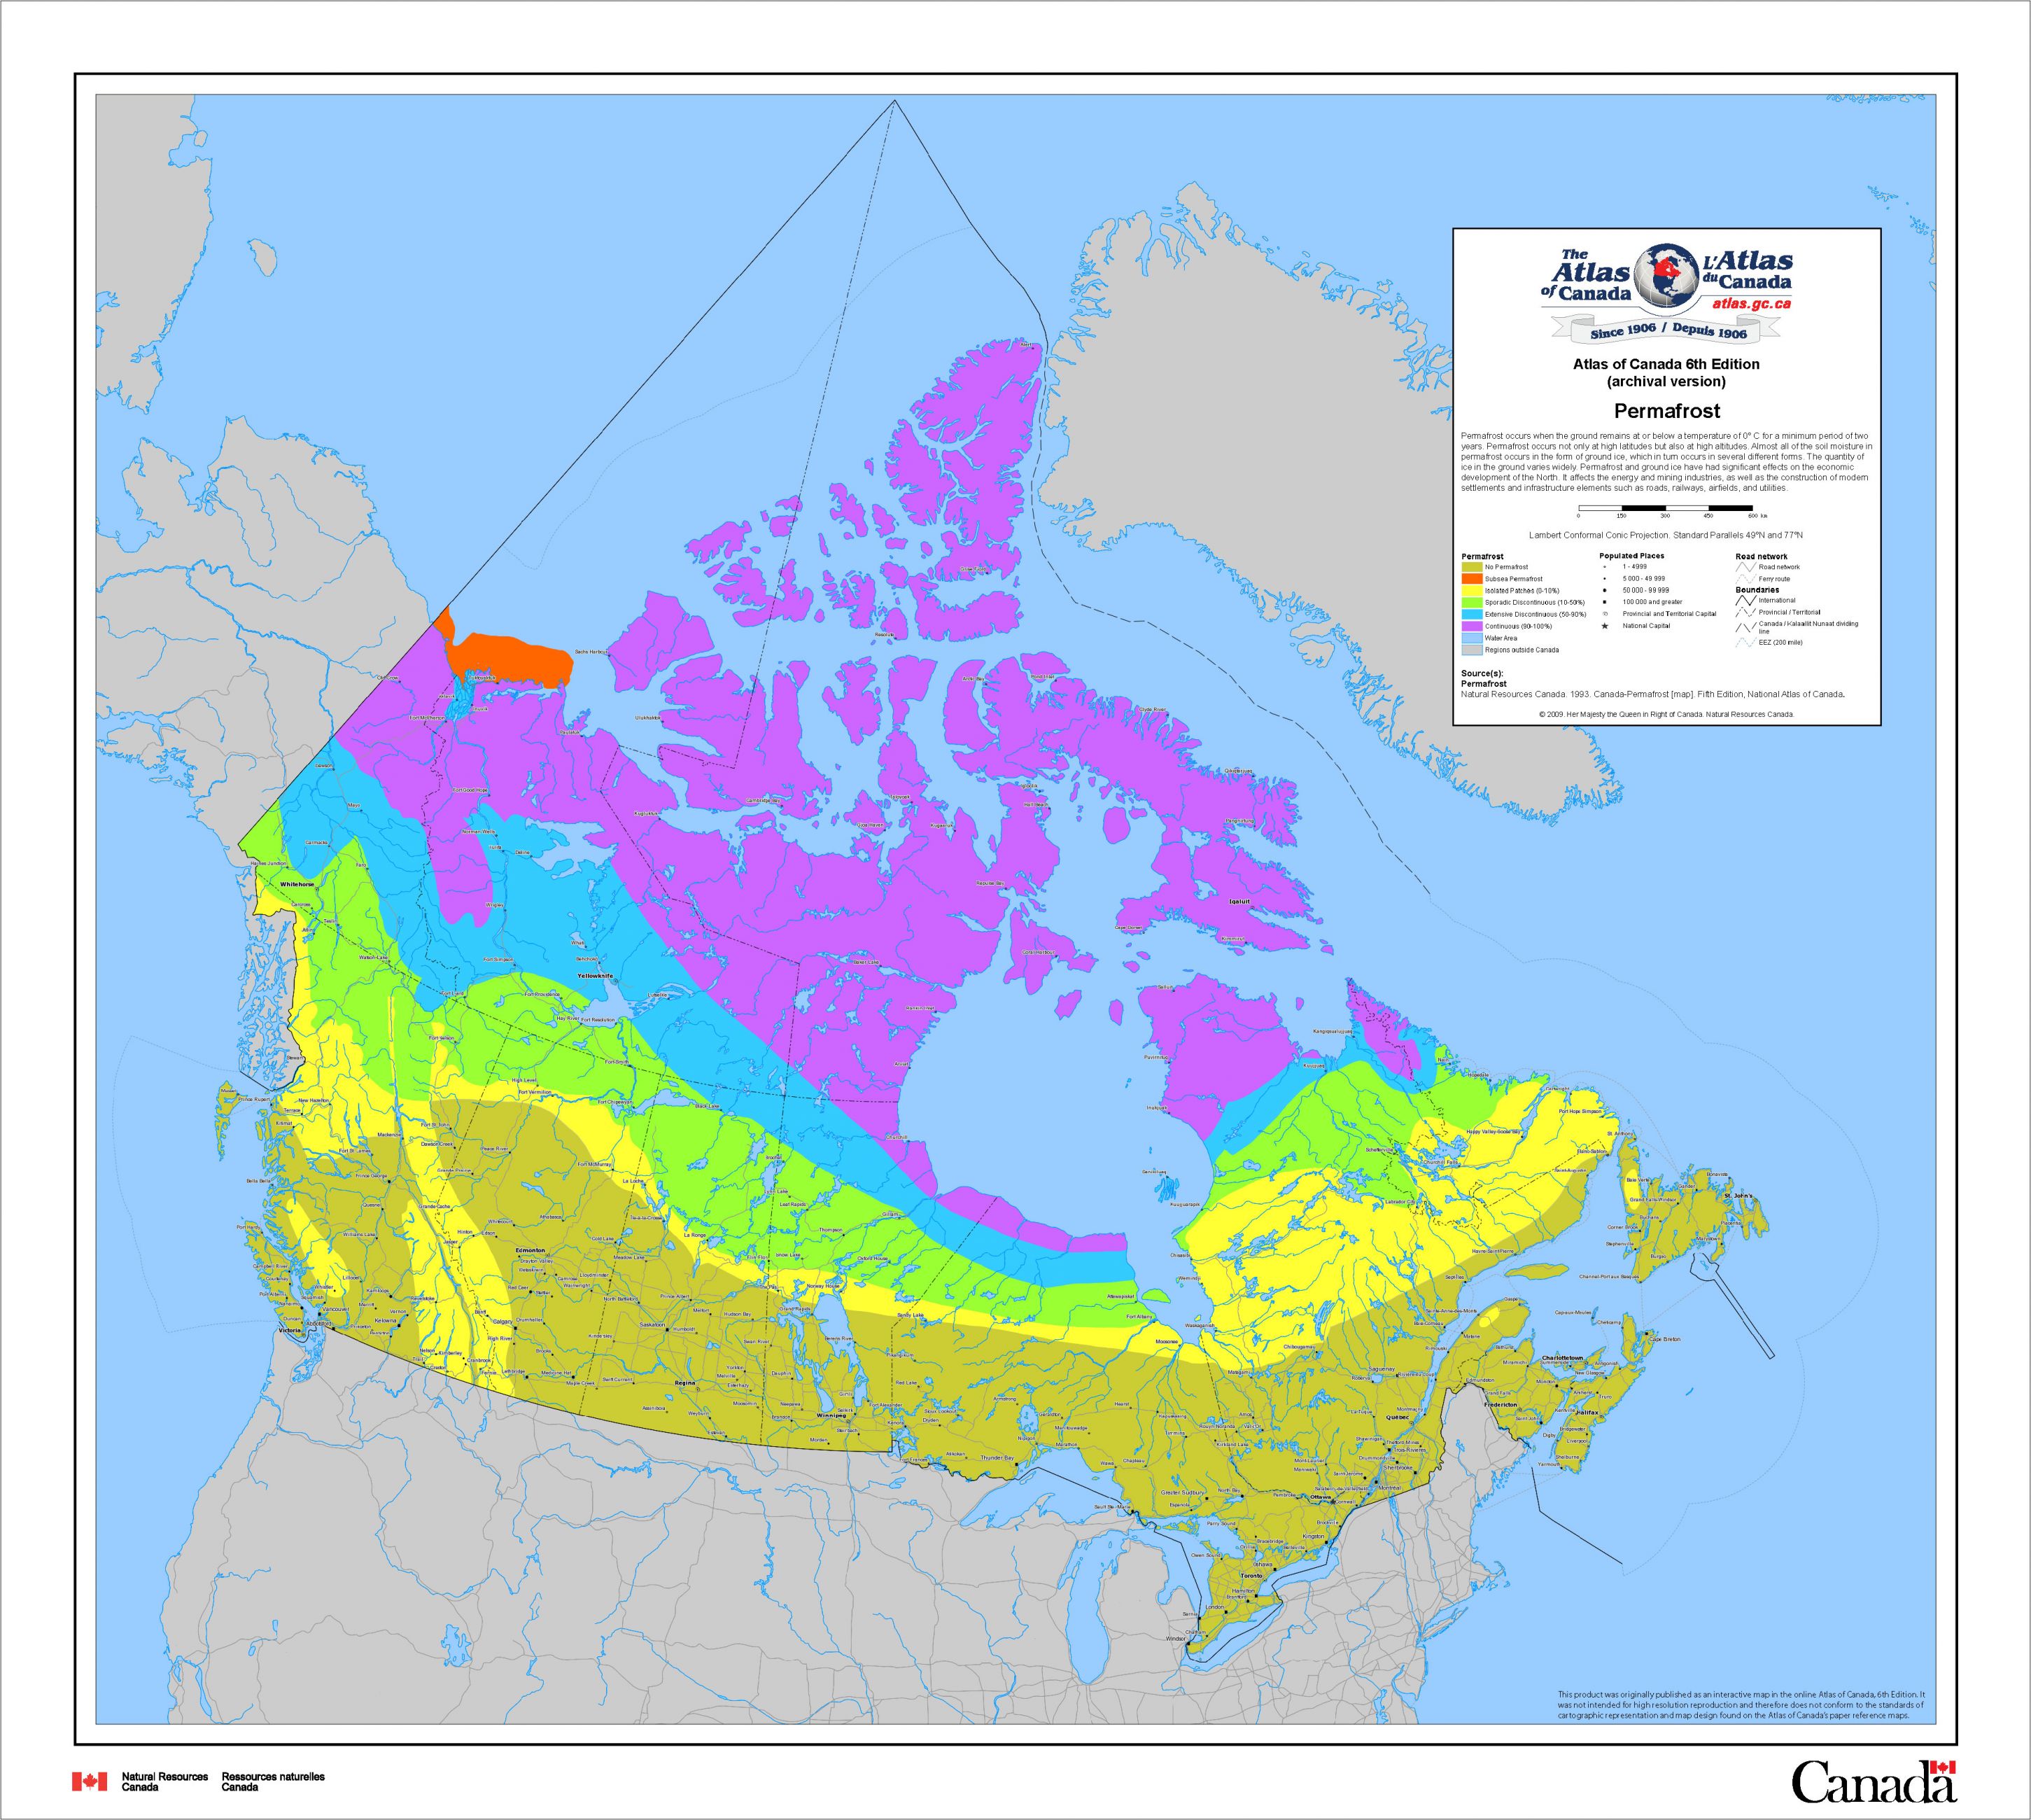
Permafrost
Date of publication: 2010, 6th edition
Download map (ZIP – PDF/JPG, 4.61 MB)
View the metadata on Open Government
This map shows different levels of permafrost occurrence across Canada. Permafrost occurs when the ground remains at or below a temperature of 0°C for a minimum period of two years. Permafrost exists at both high latitudes and altitudes. Most of the soil moisture in permafrost occurs in the form of ground ice, which in turn occurs in several different forms. Permafrost and ground ice have significant effects on the economic development of the North. It affects the energy and mining industries, as well as the construction of modern settlements and infrastructure such as roads, railways, airfields, and utilities.
Download previous editions:
Geology
Canadian Geochronology Knowledgebase
Date of publication: 2017
View the metadata on Open Government
This map represents a compilation of publicly available geochronological information for Canada, with data compiled from federal, provincial, and territorial government publications and reports, university theses, books, and journal articles.