On this page
Mines and minerals
Critical minerals
Critical Minerals
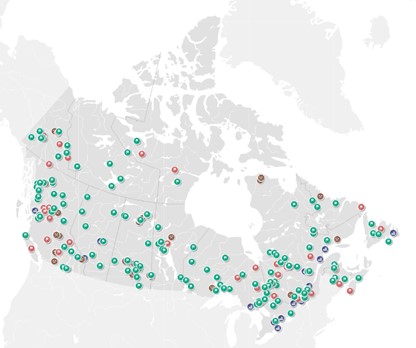
This interactive map shows Canada’s advanced critical mineral projects, active mines, and processing facilities. Use the map to find critical mineral sites and to consult the list of the commodities they process, produce or consider producing. The mining projects presented in this map are those with mineral reserves or resources (measured or indicated), and their potential viability supported by a preliminary economic assessment or by a prefeasibility or feasibility study.
Mines and minerals
Minerals and Mining
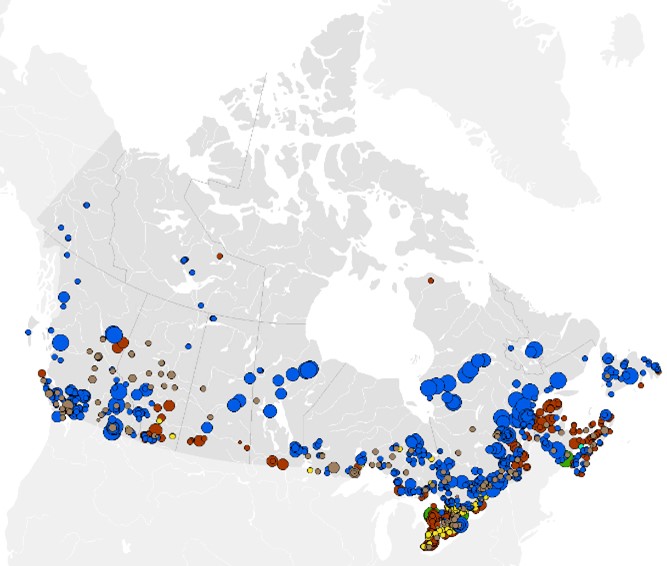
This interactive map shows Canada's principal producing mines for the given reference year. It includes locations for significant metallic, non-metallic and industrial mineral mines, coal mines, oil sands mines, oil and gas fields, and significant metallurgical facilities across Canada. This map also includes the top 100 exploration and deposit appraisal projects for the given reference year. The data in this map are based on Natural Resources Canada's annual:
Metal mines

Active Metal Mines, 2004
Date of publication: 2010, 6th edition
Download the map (ZIP – PDF/JPG, 10.75 MB)
View the metadata on Open Government
This map shows the 66 metal mines that operated for any period during 2004. There were no active metal mines in the Yukon Territory, Alberta, Prince Edward Island or Nova Scotia that year.
Download previous editions:
Indigenous mining agreements
Indigenous Mining Agreements
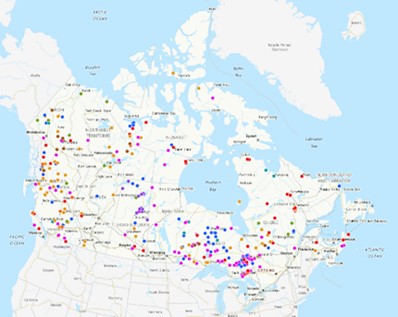
This interactive map shows Indigenous Mining Agreements across the country and specific information on exploration projects and mines, Indigenous communities, and the types of agreements signed between communities and mining companies. These agreements improve the partnerships related to exploration and mine development and have also been successful in securing benefits for many Indigenous communities.
Energy infrastructure
Clean energy
Clean Energy Resources and Projects (CERP) in Canada
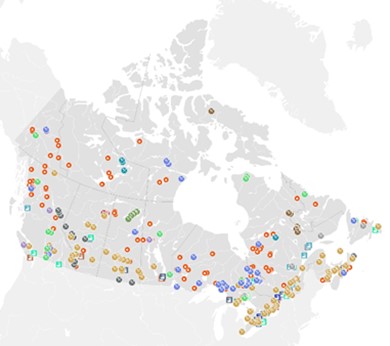
This interactive map shows Canada’s extensive clean-energy resources and projects. Clean energy includes renewable energy, electric vehicles, nuclear energy, biofuels, and carbon capture and storage (CCS). CCS is considered clean energy because it can significantly reduce global CO2 emissions resulting from fossil fuel–based power generation and from emission-intensive industrial processes like oil refining and the production of iron and steel, cement, and chemicals.
Hydropower
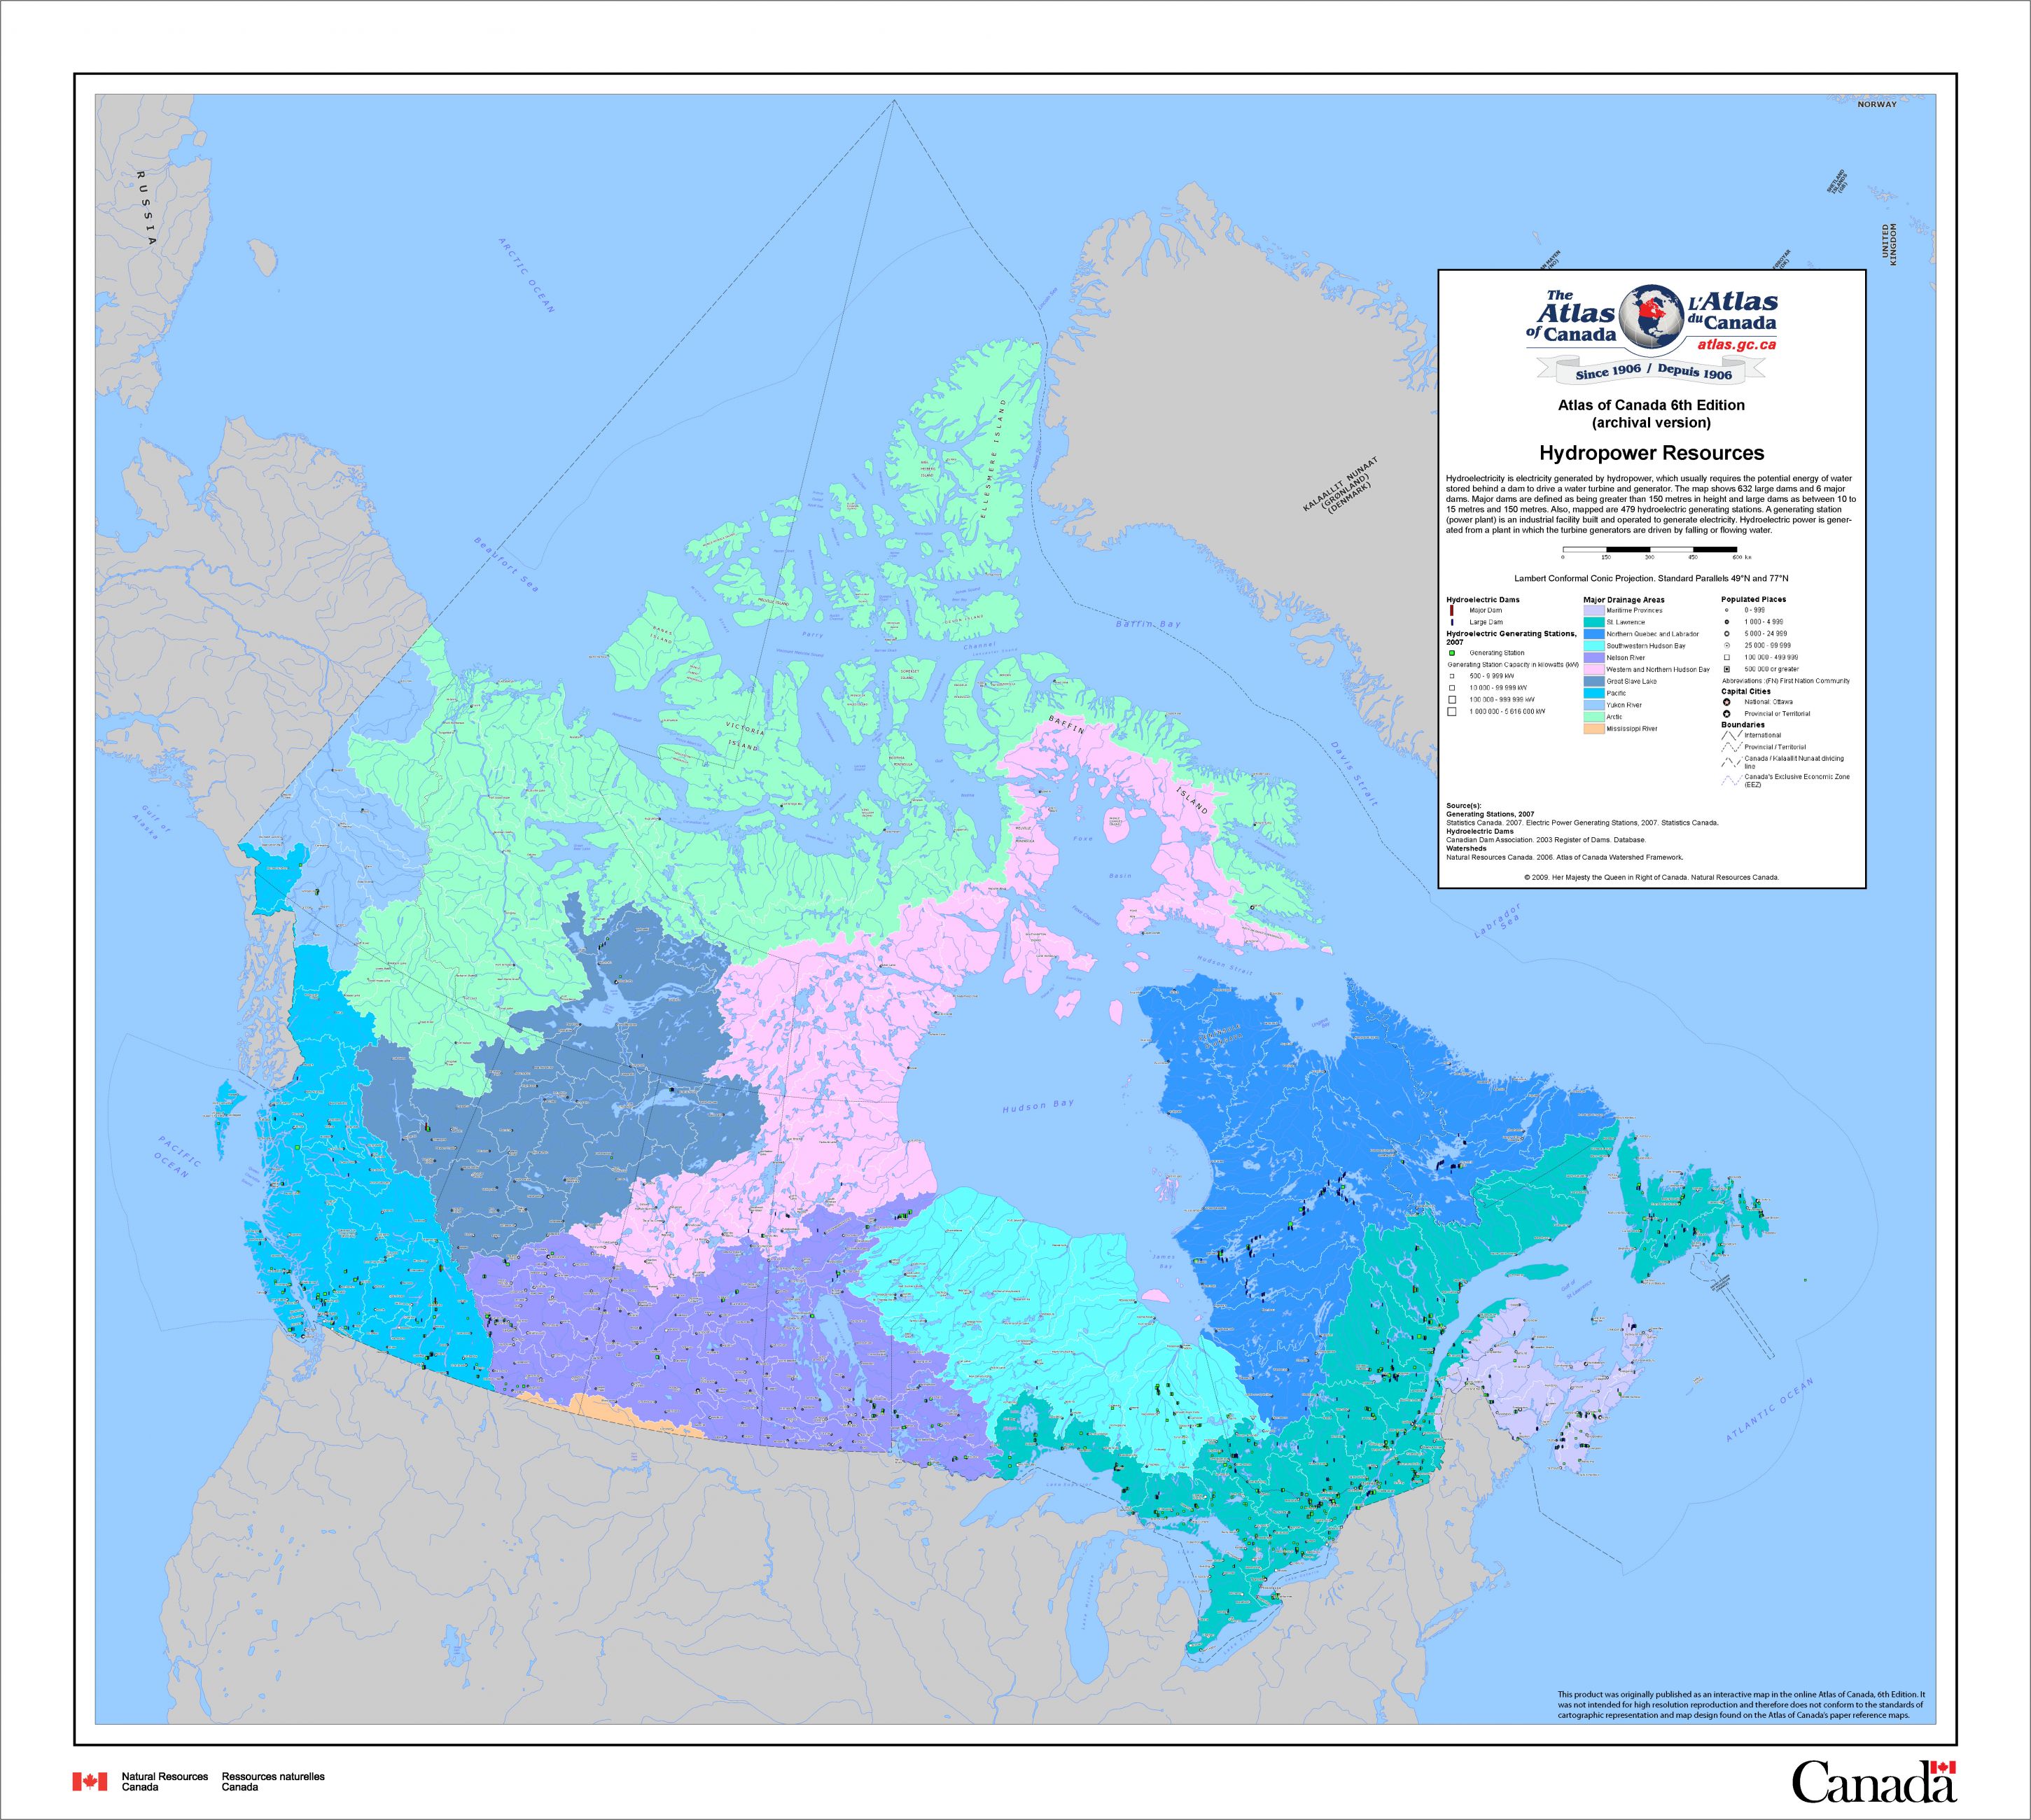
Hydropower Resources
Date of publication: 2010, 6th edition
Download the map (ZIP – PDF/JPG, 9.7 MB)
View the metadata on Open Government
This map shows Canada’s hydropower resources, including 632 large dams and 6 major dams. Major dams are defined as being greater than 150 metres in height, and large dams as being between 10 to 15 metres and 150 metres. Also mapped are 479 hydroelectric generating stations.
Download previous editions:
Pipelines
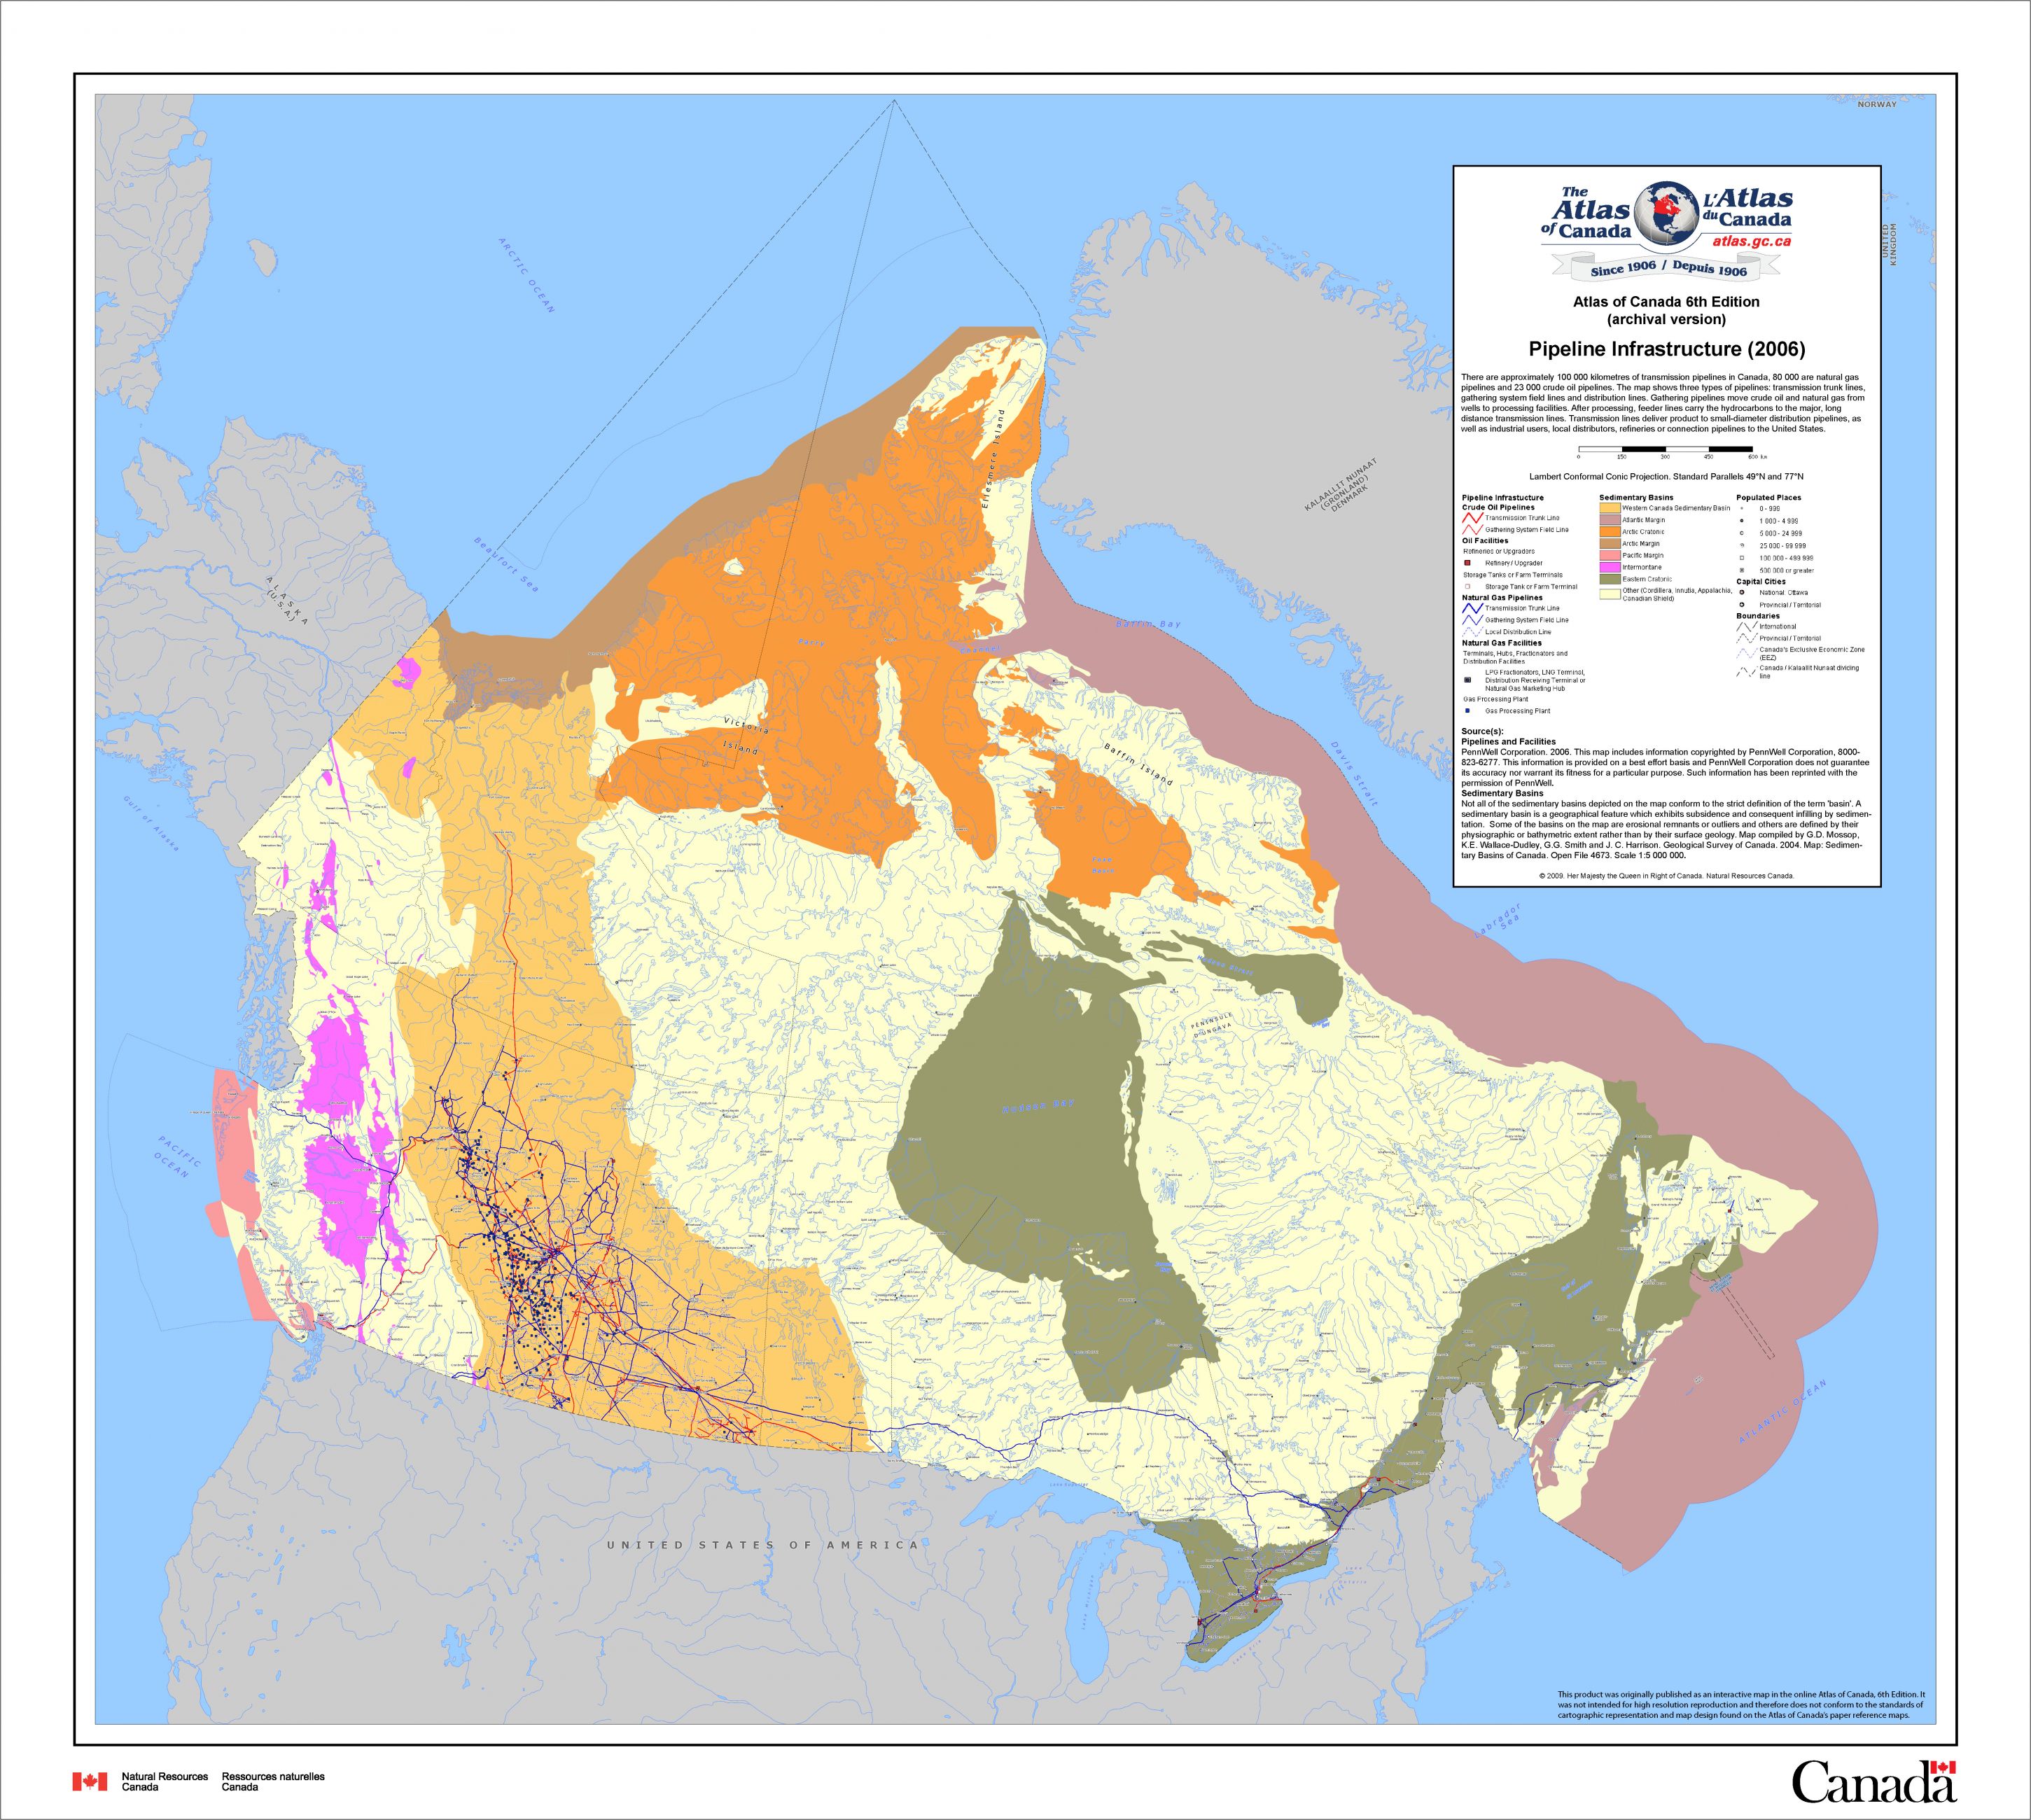
Pipeline Infrastructure (2006)
Date of publication: 2010, 6th edition
Download map (PDF, 11.30 MB)
View the metadata on Open Government
This map shows Canada’s pipeline infrastructure in 2006. There are approximately 100 000 kilometres of transmission pipelines in Canada. This map shows three types of pipelines: transmission trunk lines, gathering system field lines and distribution lines. Transmission lines deliver product to small-diameter distribution pipelines, industrial users, local distributors, refineries, or connection pipelines to the United States. Gathering pipelines move crude oil and natural gas from wells to processing facilities. After processing, feeder lines carry the hydrocarbons to the major, long distance transmission lines.
Download previous editions:
- Canada, Natural Gas Pipelines. 5th edition, 1984 (PDF, 3.05 MB)
- Canada, Oil Pipelines. 5th edition, 1984 (PDF, 3.02 MB)
- Fossil Fuels and Pipelines, Eastern Canada. 4th edition, 1973 (PDF, 1.14 MB)
- Fossil Fuels and Pipelines, Western Canada. 4th edition, 1973 (PDF, 2.72 MB)
- Minerals Fuels, Pipelines and Refineries. 3rd edition, 1958 (PDF, 0.78 MB)
Oil and gas resources
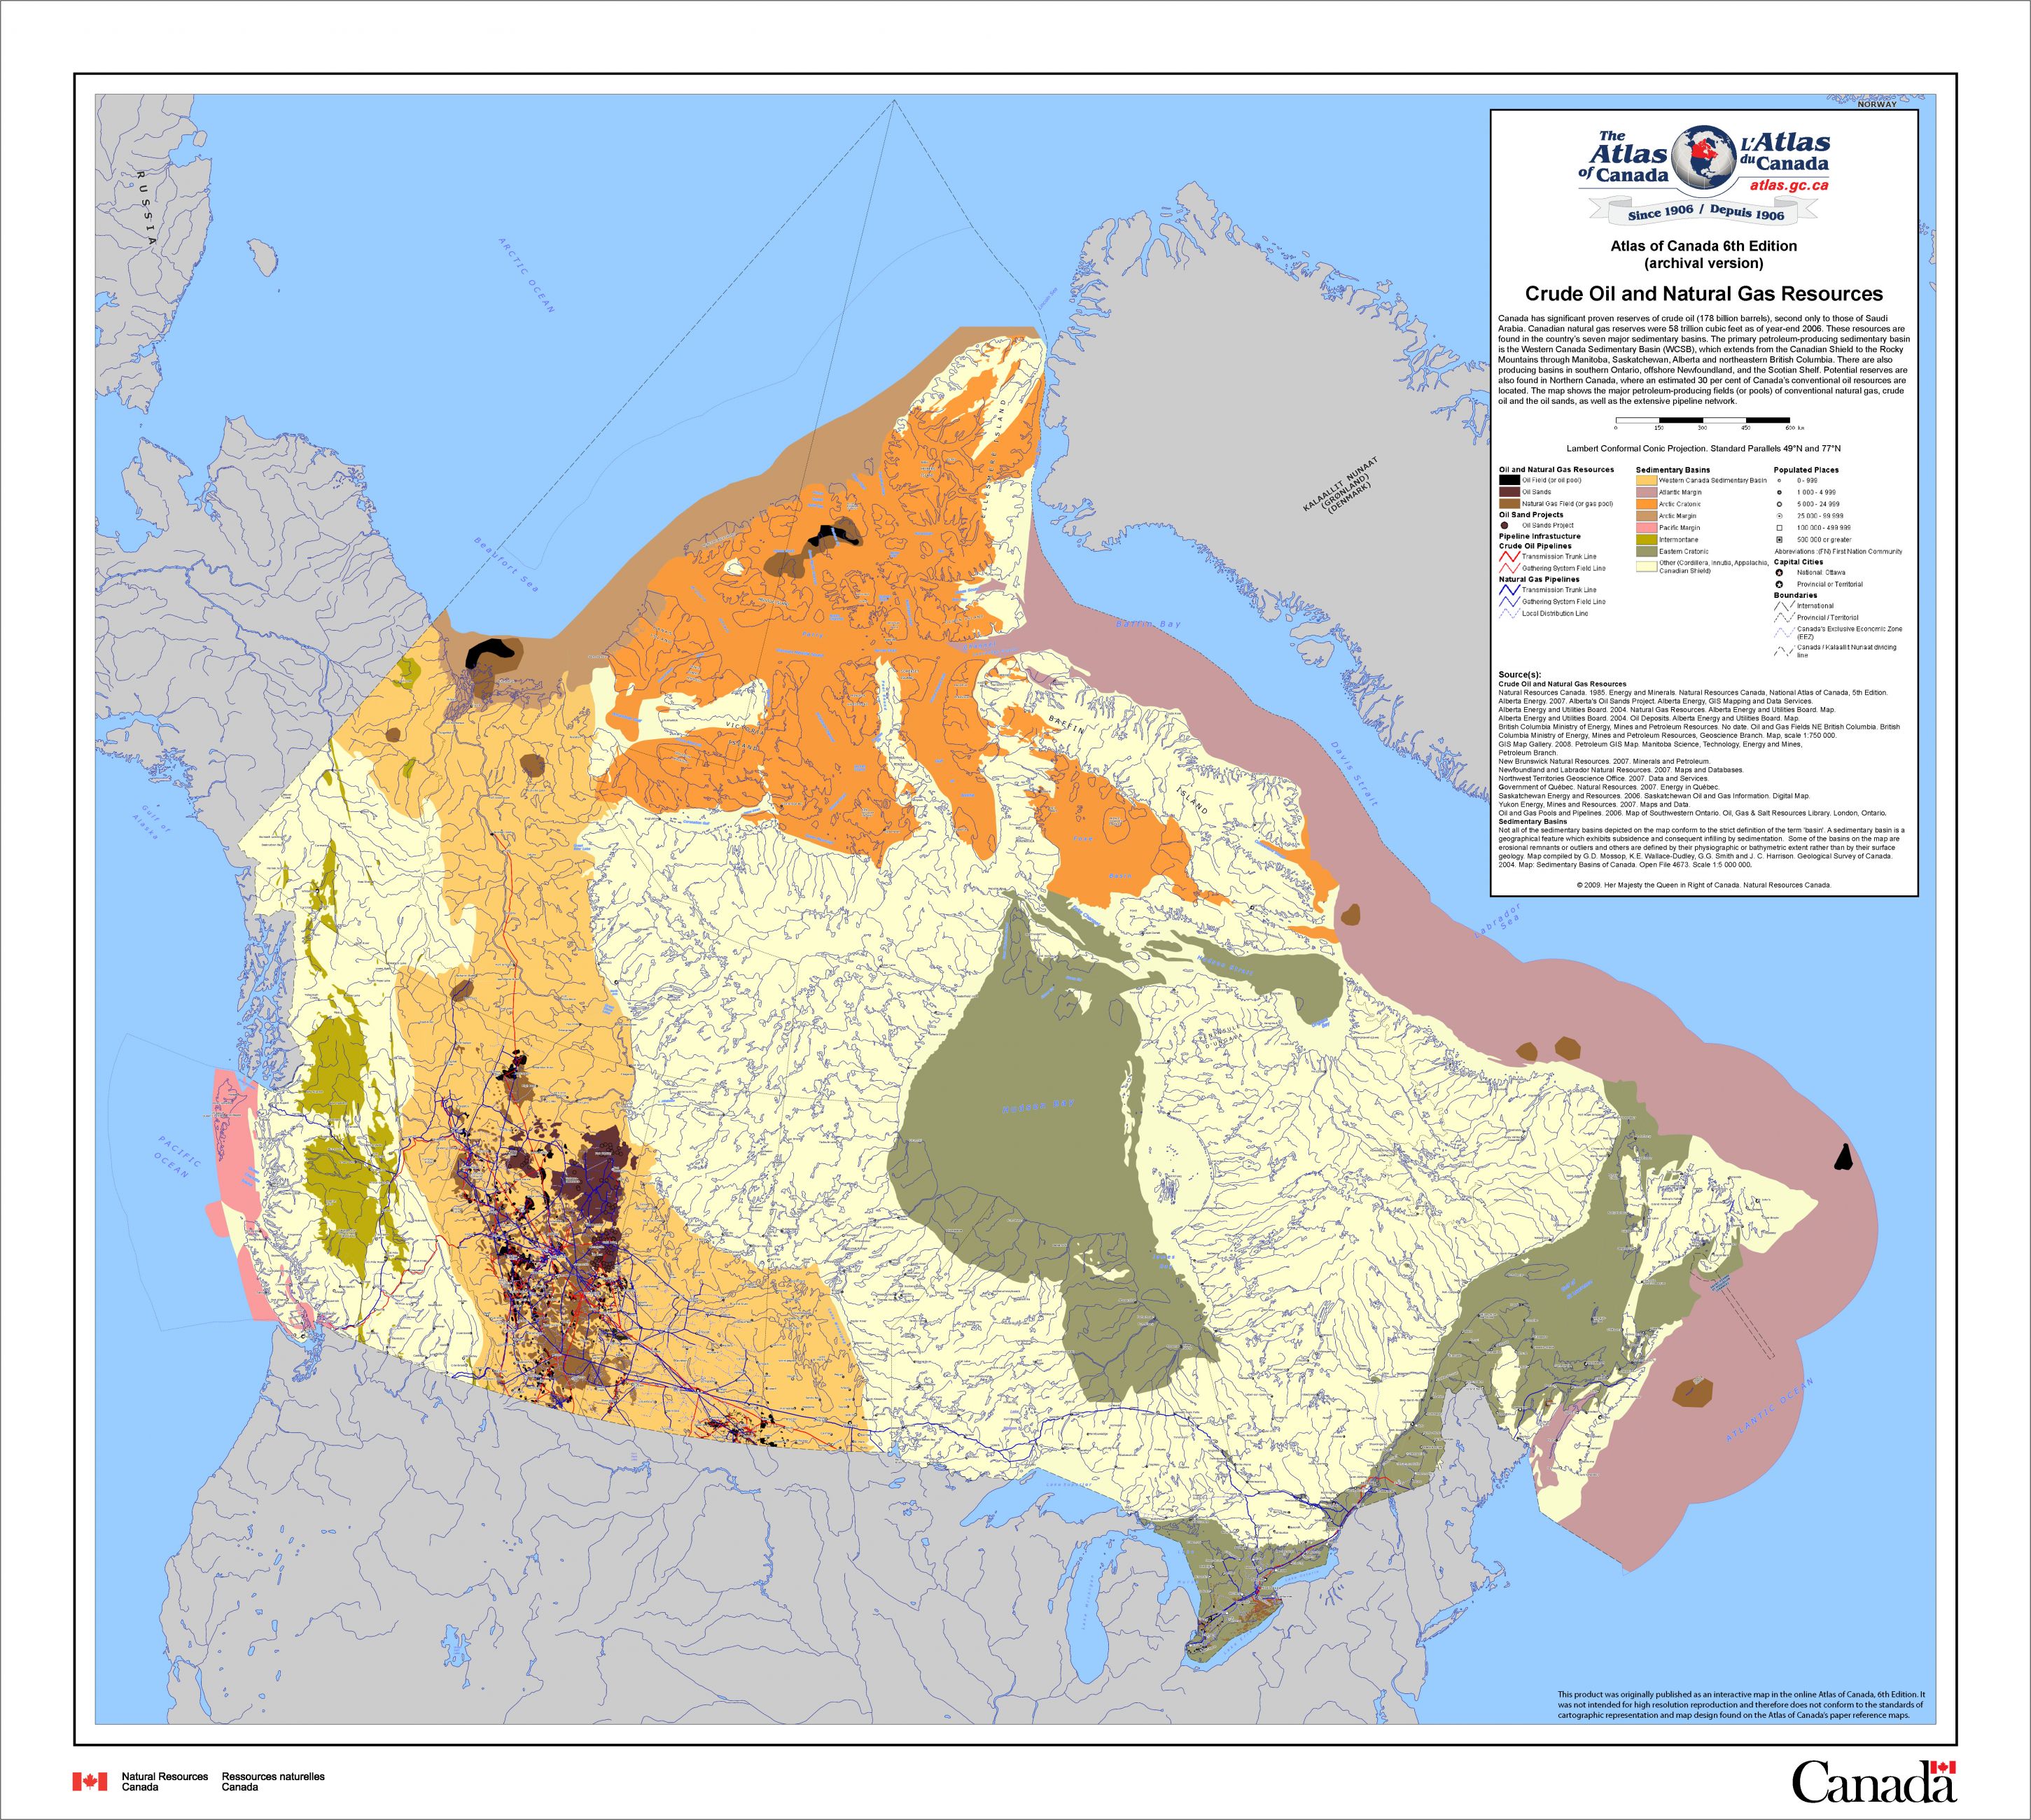
Crude Oil and Natural Gas Resources
Date of publication: 2010, 6th edition
Download map (ZIP – PDF/JPG, 13.65 MB)
View the metadata on Open Government
This map shows the major petroleum-producing fields (or pools) of natural gas, crude oil and oil sands, and the pipeline network of Canada. These resources are found in the country's seven major sedimentary basins. The primary petroleum-producing sedimentary basin is the Western Canada Sedimentary Basin (WCSB), which extends from the Canadian Shield to the Rocky Mountains through Manitoba, Saskatchewan, Alberta and northeastern British Columbia. There are also producing basins in southern Ontario, offshore Newfoundland, and the Scotian Shelf. There are potential reserves in Northern Canada, where an estimated 30 per cent of Canada’s conventional oil resources are located.
Download previous editions:
- Canada, Natural Gas Pipelines. 5th edition, 1984 (PDF, 3.05 MB)
- Canada, Oil Pipelines. 5th edition, 1984 (PDF, 3.02 MB)
- Fossil Fuels and Pipelines, Eastern Canada. 4th edition, 1973 (PDF, 1.14 MB)
- Fossil Fuels and Pipelines, Western Canada. 4th edition, 1973 (PDF, 2.72 MB)
- Minerals Fuels, Pipelines and Refineries. 3rd edition, 1958 (PDF, 0.78)
Remote communities
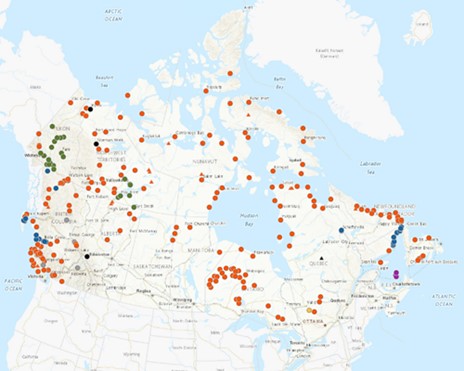
Remote Communities Energy Database
View the metadata on Open Government
This interactive map gives information about the generation and use of electricity and other energy sources for all remote communities in Canada. Communities are identified as being remote if they are not currently connected to the North American electrical grid nor to the piped natural gas network; and are a permanent or long-term (5 years or more) settlement with at least 10 dwellings.
Download previous editions:
- Canada, Natural Gas Pipelines. 5th edition, 1984 (PDF, 3.05 MB)
- Canada, Oil Pipelines. 5th edition, 1984 (PDF, 3.02 MB)
- Fossil Fuels and Pipelines, Eastern Canada. 4th edition, 1973 (PDF, 1.14 MB)
- Fossil Fuels and Pipelines, Western Canada. 4th edition, 1973 (PDF, 2.72 MB)
- Minerals Fuels, Pipelines and Refineries. 3rd edition, 1958 (PDF, 0.78)
Agriculture
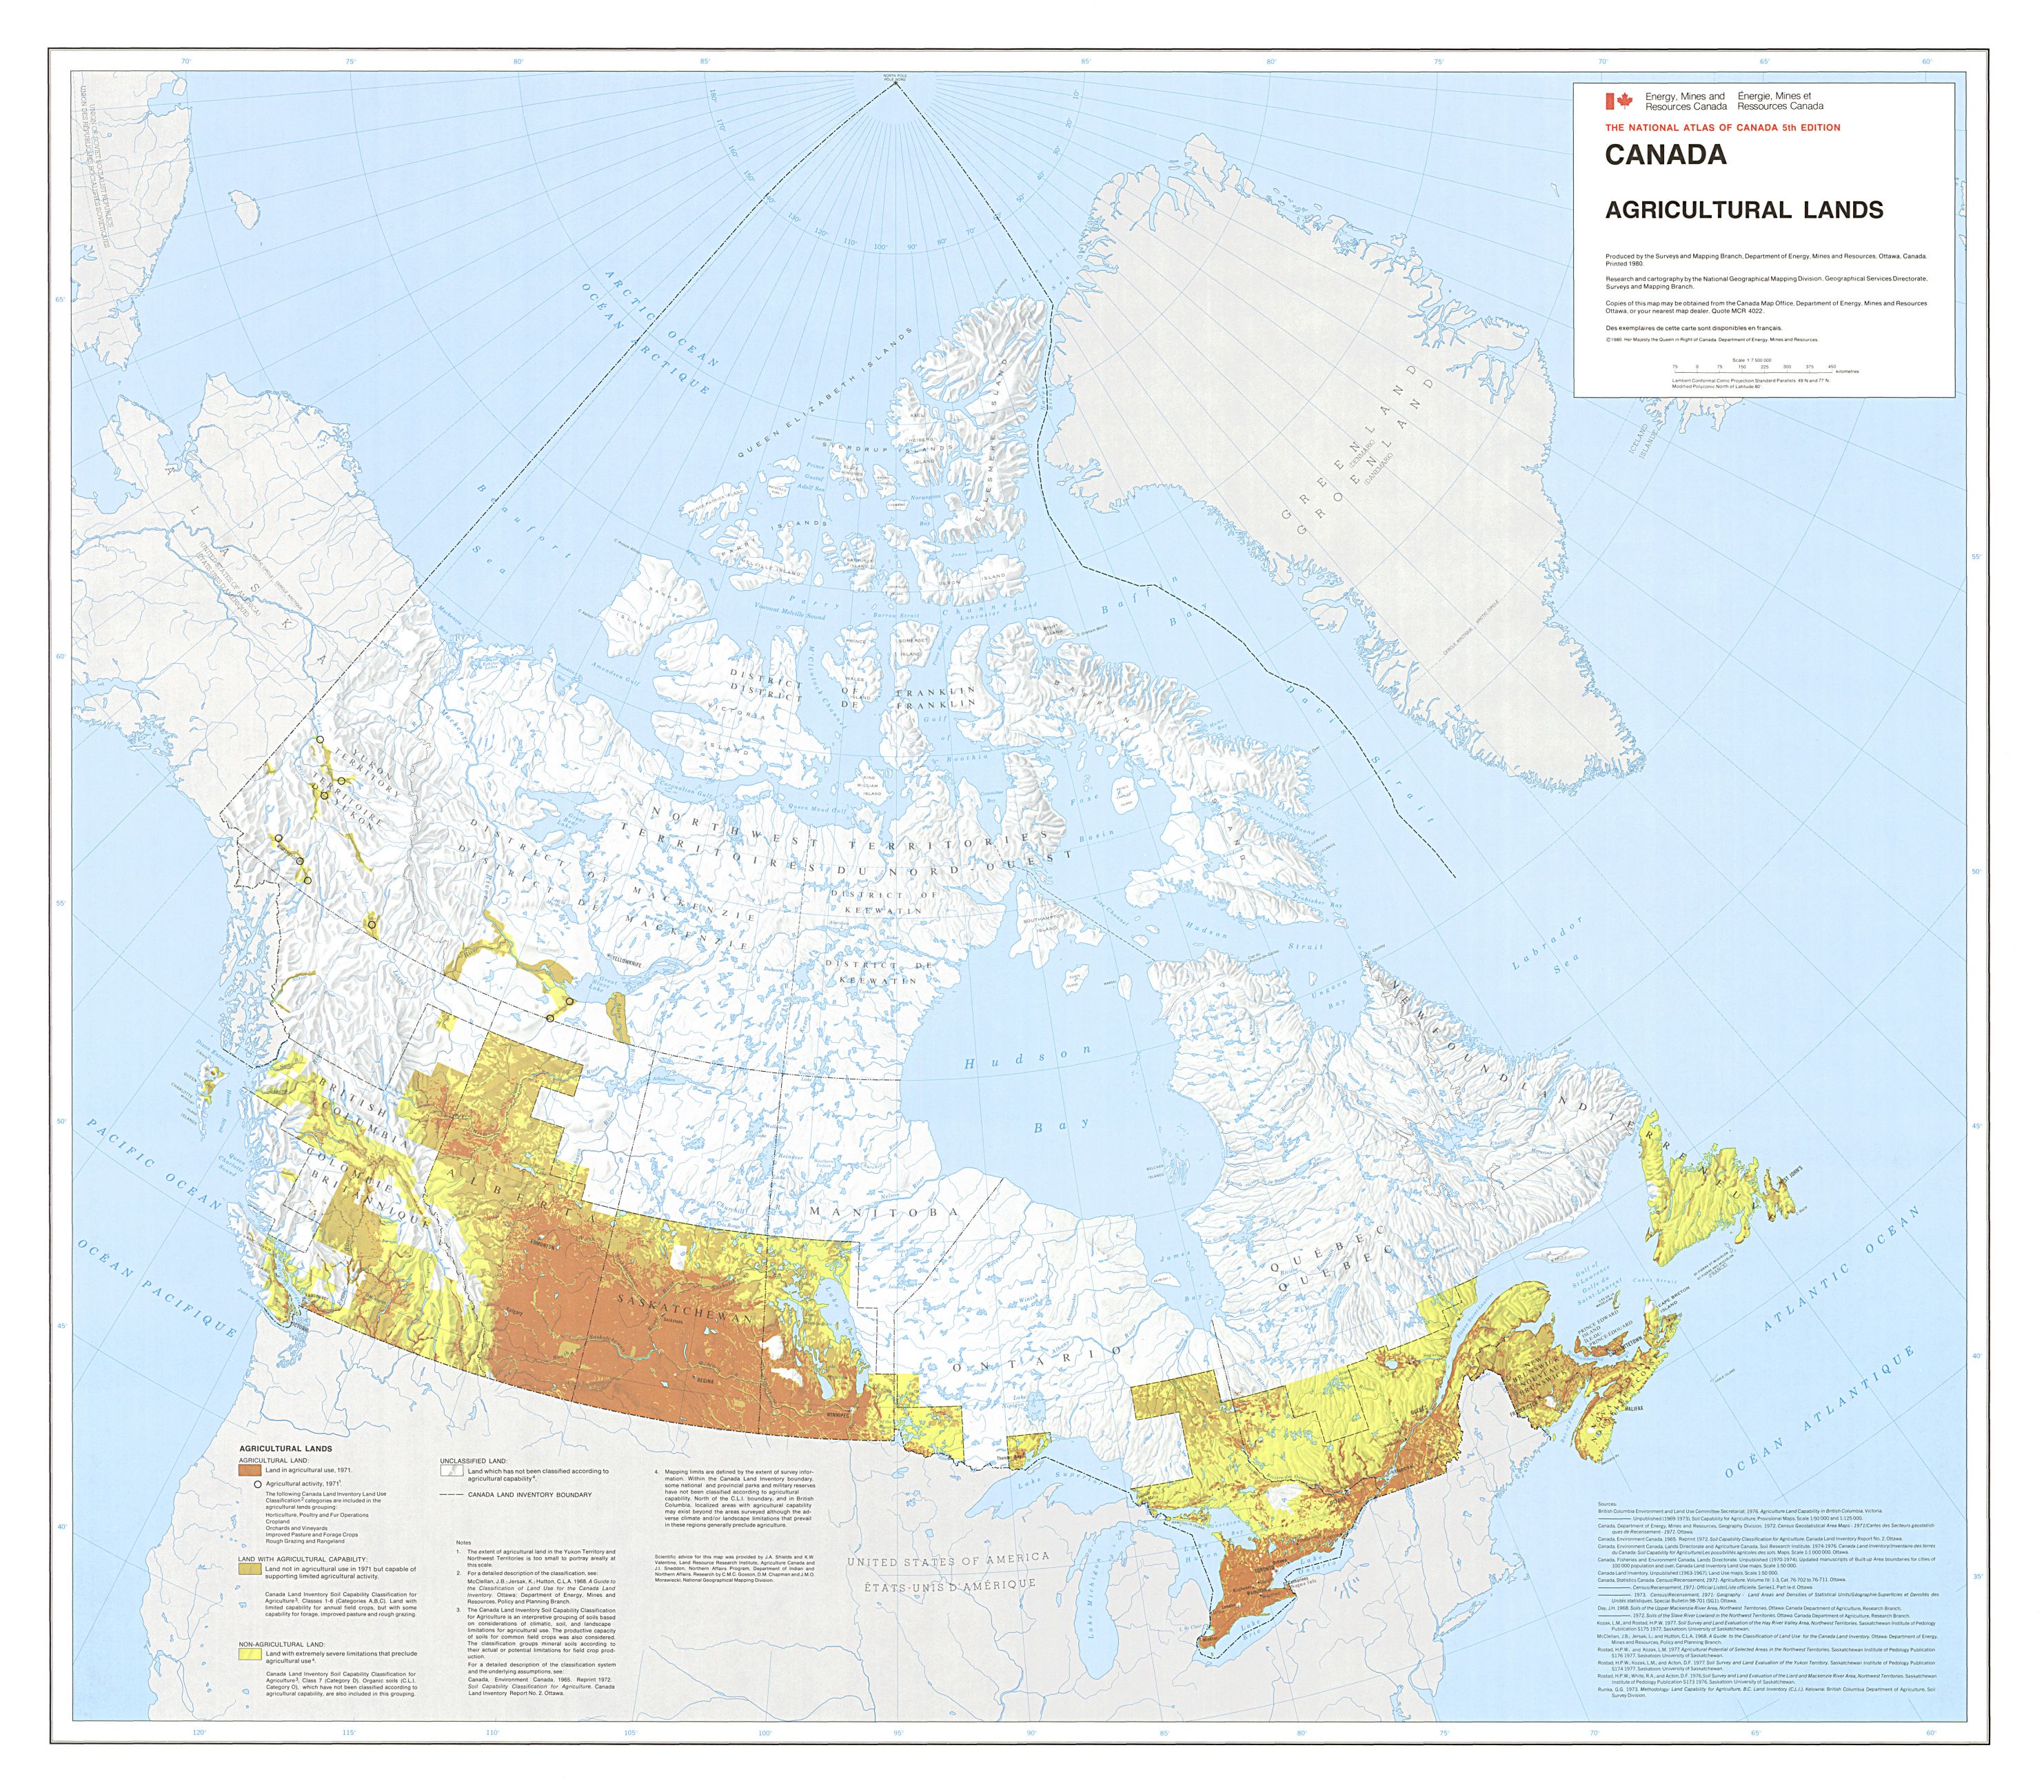
Canada, Agriculture Lands
Date of publication: 1980, 5th edition
Download the map (PDF, 7.99 MB)
View the metadata on Open Government
This map from the 5th edition of the Atlas of Canada shows the land where data existed for land in agricultural use, land not in agricultural use but capable of limited agriculture activity, and non-agricultural land. The map uses 1971 data from the Canada Land Inventory.
Income

Median Total Income, 2000
Date of publication: 2006, 6th edition
Download the map (ZIP-PDF/JPG, 3.90 MB)
View the metadata on Open Government
This map shows the median total income for the census divisions where the population density is greater or equal to 0.4 persons per square kilometre from the year 2000. The median total income of persons 15 years of age and over was $22,120. Median income is the point that divides the population in two, where half are below and half are above that income value. Total income is income accrued from earnings, government transfer payments and other sources.
Download previous editions:
- Canada, Income per Capita. 5th edition, 1990 (PDF, 12.56 MB)
- Personal Income. 4th edition, 1972 (PDF, 2.12 MB)
Employment

Employment Growth 2001 – 2006 (by census division)
Date of publication: 2010, 6th edition
Download the map (ZIP – PDF/JPG, 3 MB)
View the metadata on Open Government
This map shows the employment growth rate between 2001 and 2006 in census subdivisions. Between those years, total employment in Canada increased at an annual average rate of 1.7% and increased in every part of the country. The 1.7% annual average national employment growth rate was surpassed only in Alberta (2.9%), British Columbia (2.1%) and the three territories.
Download previous editions:
Housing
Owner occupied dwellings
Housing Ownership, 2006 – Percentage of Owner-Occupied Dwelling by Census Division
Date of publication: 2010, 6th edition
Download the map (ZIP – PDF/JPG, 2.97 MB)
View the metadata on Open Government
This map shows the percentage of households in each census division where inhabitants owned their dwelling in 2006. According to the 2006 Census, 68% of households owned their home, which was an increase from 66% in 2001. Households in the Atlantic provinces continued to have the highest homeownership rates in the country, with Newfoundland and Labrador ranking first, at 78.7%. Households in Quebec had the lowest ownership rates, at 60.1%.
Renter occupied dwellings

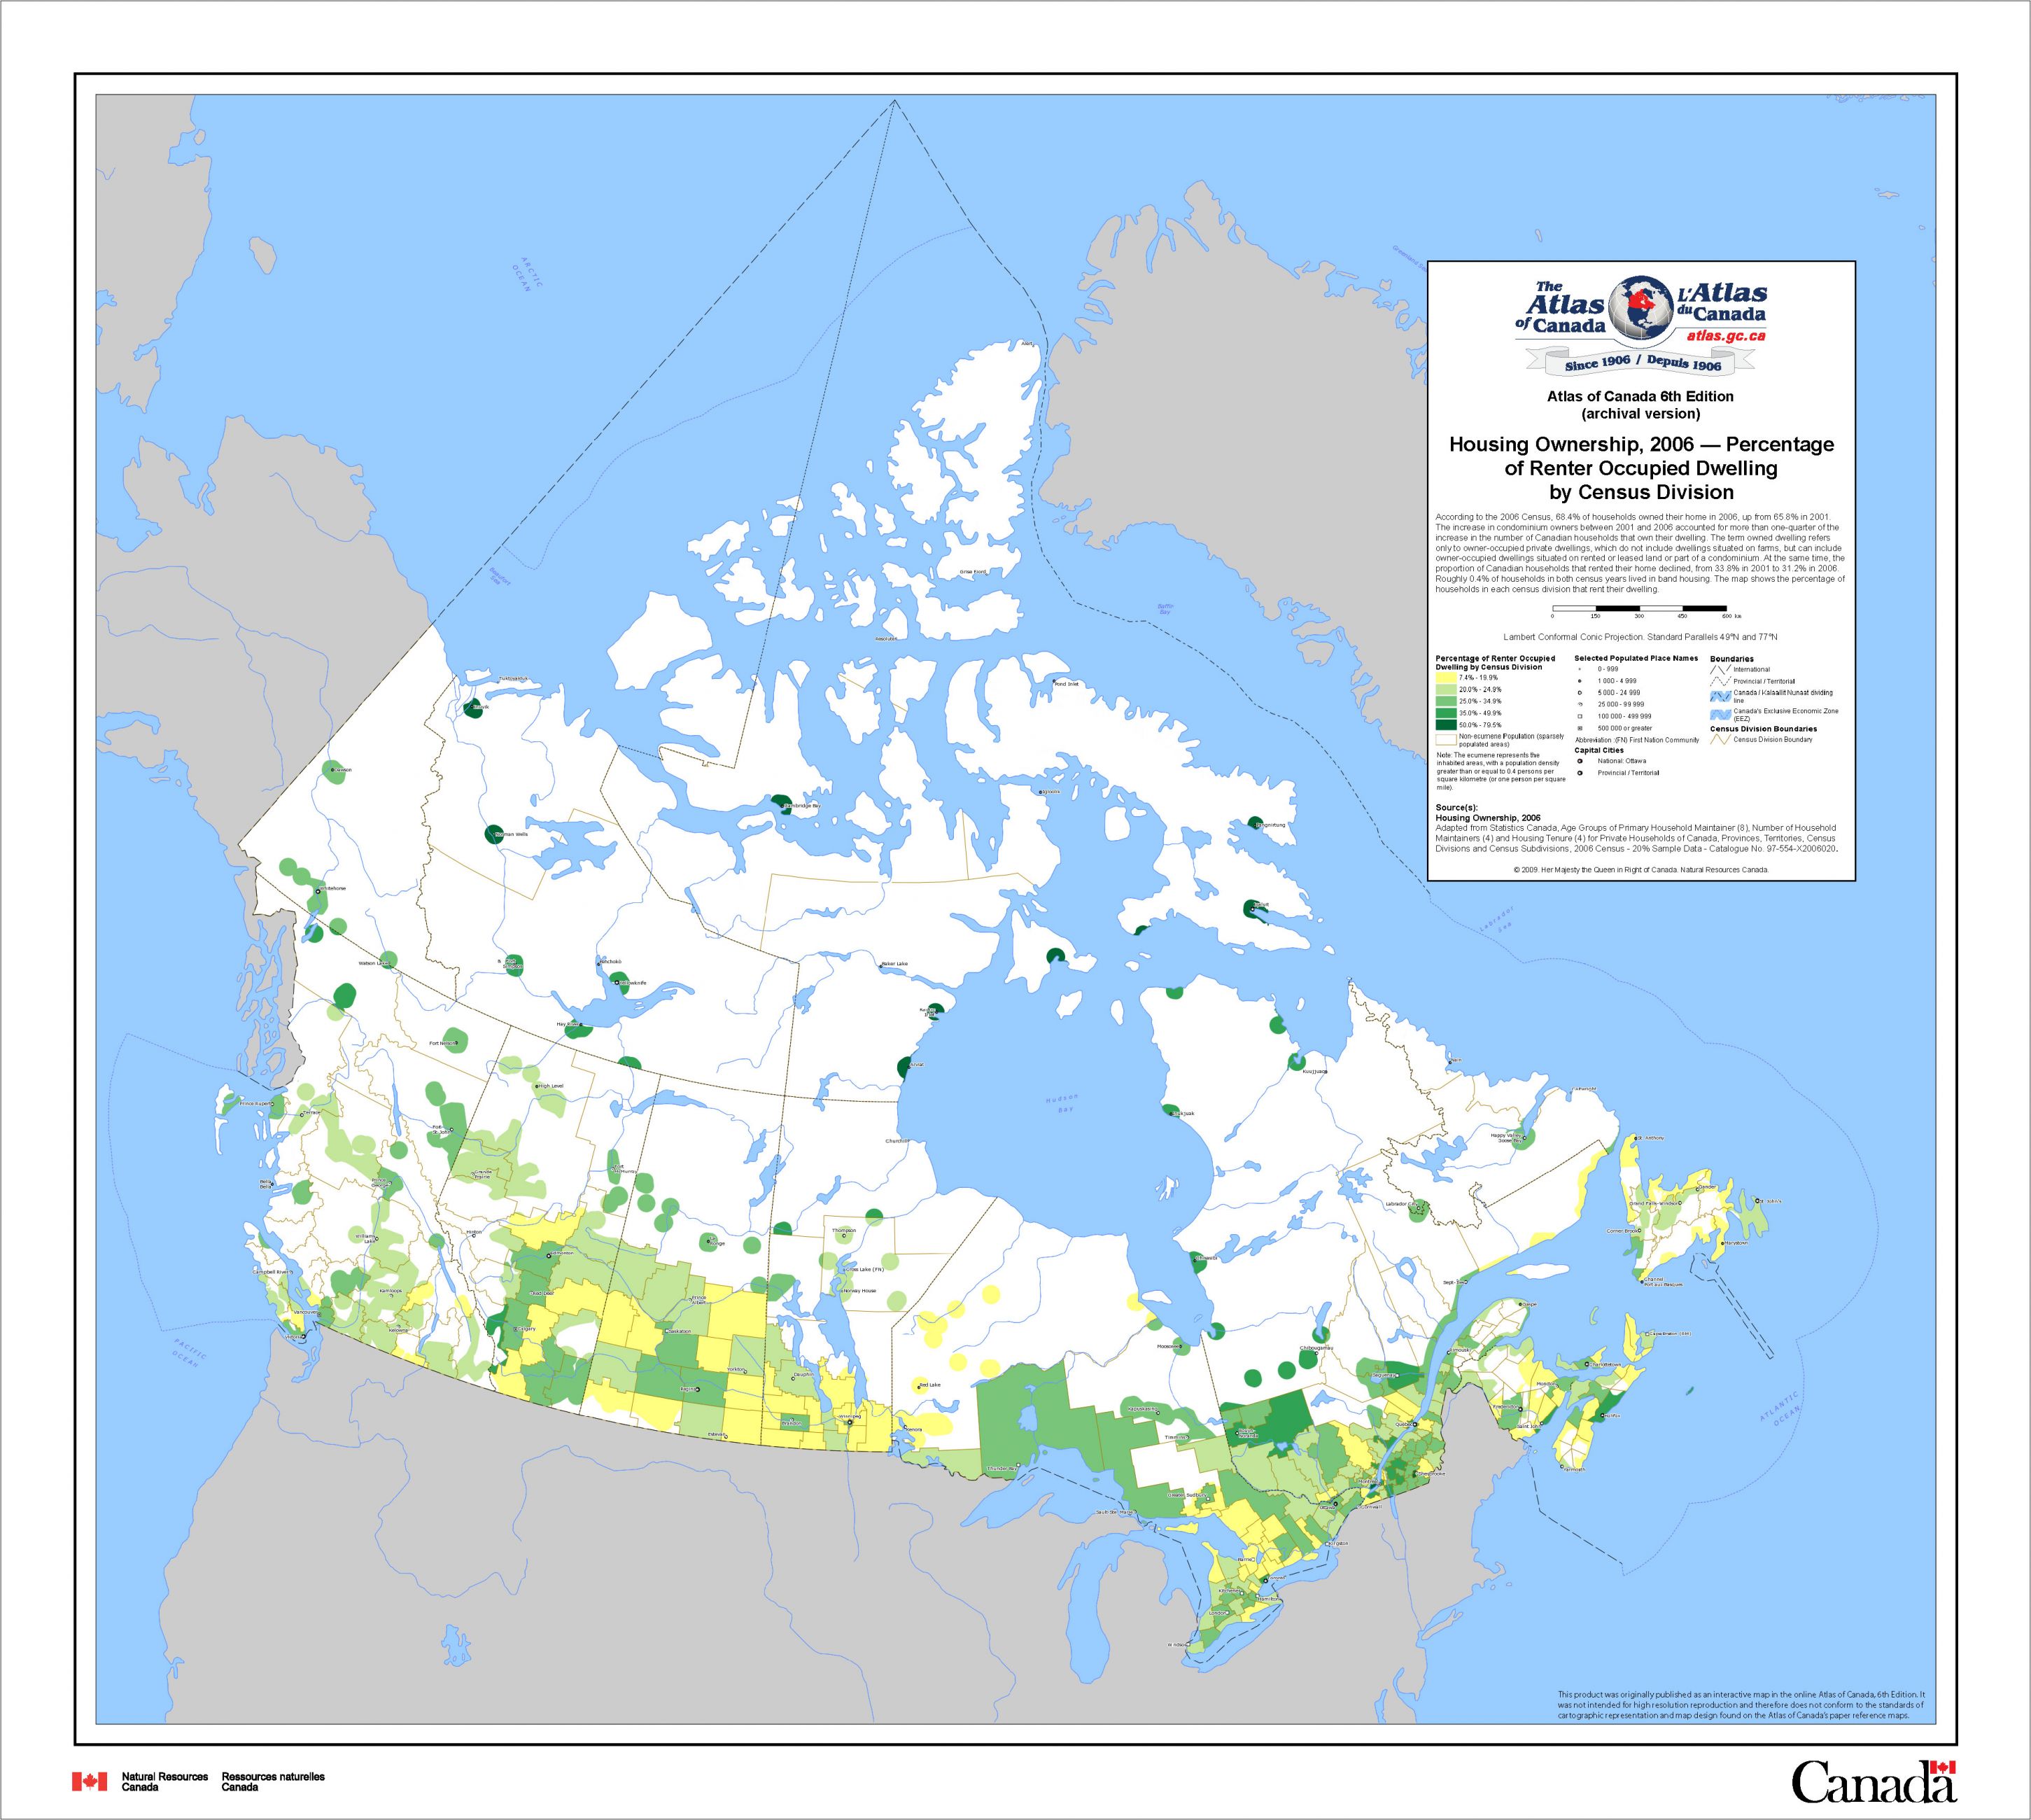
Housing Ownership, 2006 – Percentage of Renter-Occupied Dwelling by Census Division
Date of publication: 2010, 6th edition
Download the map (ZIP – PDF/JPG, 2.98 MB)
View the metadata on Open Government
The map shows the percentage of households in each census division that rented their dwelling in 2006. According to the 2006 Census, 68.4% of households owned their home in 2006, up from 65.8% in 2001. The increase in condominium owners between 2001 and 2006 accounted for more than one-quarter of the increase in the number of Canadian households that own their dwelling. At the same time, the proportion of Canadian households that rented their home declined, from 33.8% in 2001 to 31.2% in 2006.