On this page
Frost
First frost
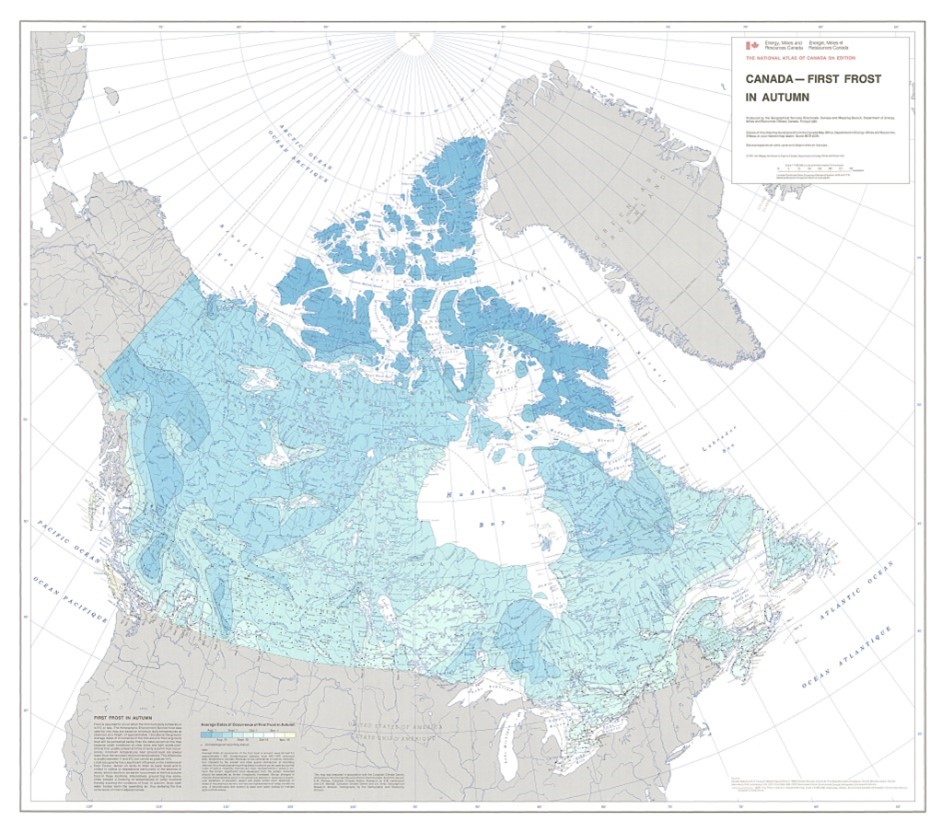
Canada – First Frost in Autumn
Date of publication: 1981, 5th edition
Download the map (PDF, 7.72 MB)
This map shows the average date of occurrence of the first frost in autumn. Frost is assumed to occur when the minimum daily temperature is 0°C or less. The average dates of occurrence were derived from approximately 1200 climatological stations from 1941 to 1970 minimum daily temperature normal.
Last frost
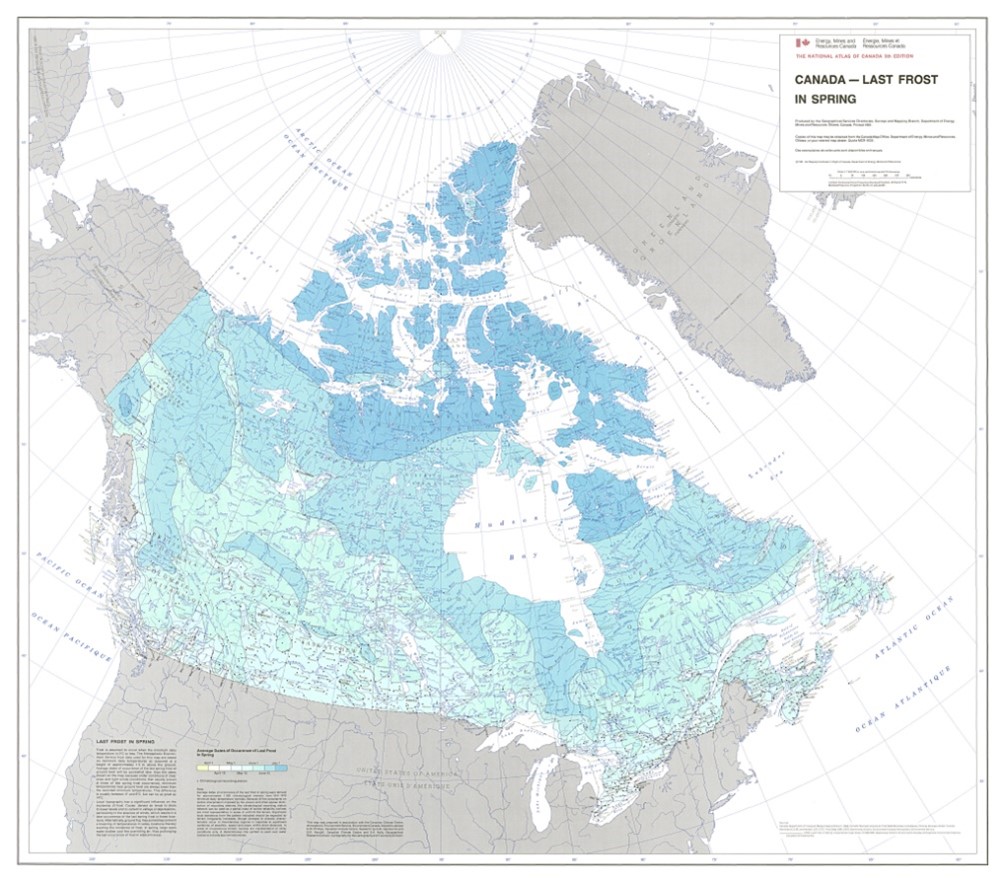
Canada – Last Frost in Spring
Date of publication: 1981, 5th edition
Download the map (PDF, 7.85 MB)
This map shows average date of occurrence of the last frost in spring. Frost is assumed to occur when the minimum daily temperature is 0°C or less. The average dates of occurrence were derived from approximately 1200 climatological stations from 1941 to 1970 minimum daily temperature normal.
Frost-free period
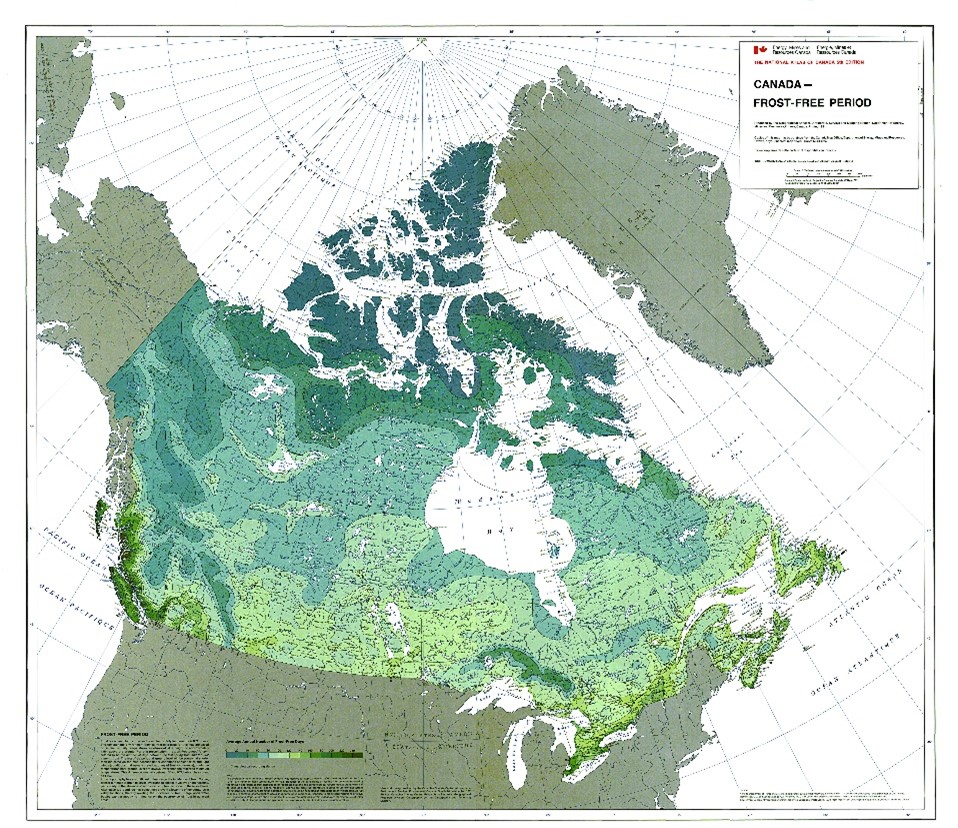
Canada – Frost-Free Period
Date of publication: 1981, 5th edition
Download the map (PDF, 12.62 MB)
This map shows the average length of the frost-free period for all parts of Canada. Frost is assumed to occur when the minimum daily temperature is 0°C or less. The average annual number of frost-free days were derived from approximately 1200 climatological stations from 1941 to 1970 minimum daily temperature normal.
Download previous editions:
Precipitation
Annual mean

Annual Mean Total Precipitation
Date of publication: 2006, 6th edition
Download the map (ZIP – PDF/JPG, 4.81 MB)
This map shows the annual mean total precipitation from the 1971 to 2000 climate normals. Over much of the continental interior of Canada, precipitation reaches its annual maximum in the summer months and falls as rain. October marks the transition from mainly rain to snowfall across northern Canada.
January mean

January Mean Total Precipitation
Date of publication: 2010, 6th edition
Download the map (ZIP – PDF/JPG, 4.60 MB)
This map shows the mean total precipitation in January from the 1971 to 2000 climate normals. January precipitation is mainly in the form of snow. Throughout much of the interior and the north, precipitation amounts are generally less than 20 mm and, in the high Arctic, as little as a few millimetres. The west coast receives heavy precipitation in the form of rain at low elevations and mainly snow at higher elevations. On Canada’s east coast there is a mixture of rain and snow, with rain dominating close to the Atlantic and snow becoming more prevalent to the northwest.
April mean

April Mean Total Precipitation
Date of publication: 2010, 6th edition
Download the map (ZIP-PDF/JPG, 4.70 MB)
This map shows the mean total precipitation in April from the 1971 to 2000 climate normals. April is a transitional month across much of southern Canada, when snow is still possible but rainfall begins to dominate. Precipitation amounts across the southern interior of Canada are somewhat greater than those in January, as air temperatures warm. Rainfall amounts along British Columbia’s west coast are still in the range of 200 to 300 millimetres, somewhat less than the values in January. In the Atlantic Provinces, precipitation amounts are less than in January, but the distribution of monthly precipitation is not as variable annually as on the Prairies or the west coast. Across northern Canada, almost all precipitation still falls as snow.
July mean
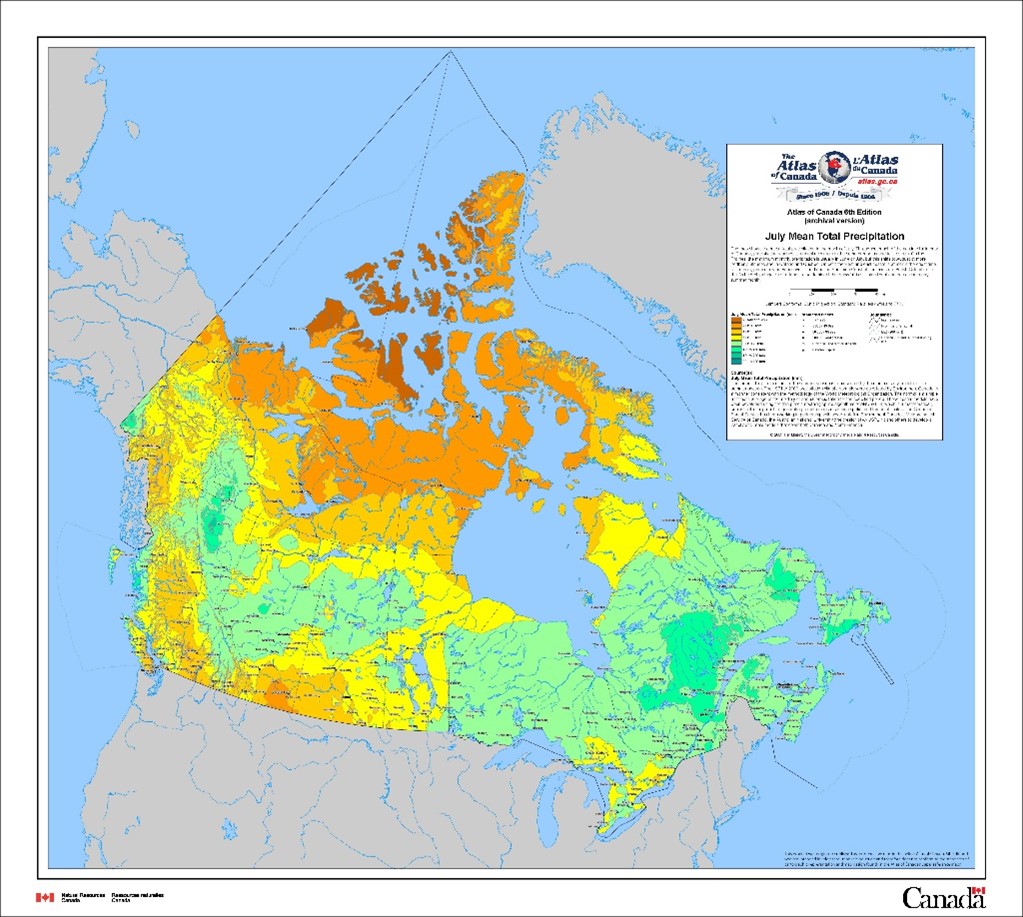
July Mean Total Precipitation
Date of publication: 2010, 6th edition
Download the map (ZIP – PDF/JPG, 4.9 MB)
This map shows the mean total precipitation in July from the 1971 to 2000 climate normals. In the continental interior of Canada, precipitation reaches its annual maximum in the summer months and falls as rain. On the Prairies, the maximum monthly precipitation is usually in June or July. This shifts to August at more northern latitudes and in Ontario and Quebec. On the west and east coasts, summer is the driest time of the year. In the Arctic Archipelago, rainfall tends to be dominant, but snowfall is still significant and can occur in any summer month.
October mean

October Mean Total Precipitation
Date of publication: 2010, 6th edition
Download the map (ZIP – PDF/JPG, 4.7 MB)
This map shows the mean total precipitation in October from the 1971 to 2000 climate normals. October marks the transition from mainly rain to snowfall across northern Canada. Snowfall also occurs across much of the interior of southern Canada but in relatively small amounts that usually melt. October also marks the transition to the rainy season on the southern portion of British Columbia’s west coast.
Download previous editions:
- 5th edition, Canada, Precipitation, 1991 (PDF, 3.0 MB)
- 4th edition, Precipitation, sheet 2, 1969 (PDF, 2.3 MB)
- 3rd edition, Seasonal Precipitation, 1958 (PDF, 1.4 MB)
Snow cover
Start date of continuous snow cover

Median Start Date of Continuous Snow Cover
Date of publication: 2010, 6th edition
Download the map (ZIP – PDF/JPG, 5.28 MB)
This map shows the median date of snow-cover onset (defined as the first date with 14 consecutive days of snow cover greater than 2 centimetres in depth) computed over 18 winter seasons from 1979 to 1997. In areas with permanent or semipermanent snow cover (for example, Arctic ice caps) or in areas with irregular or ephemeral snow cover (coastal British Columbia), researchers were unable to compute the median values. The main feature of the map is the rapid southward extension of snow cover over Canada during the September to December period. The moderating influence of Hudson Bay can be seen over northern Quebec, where snow cover starts later than in the equivalent latitudes west of Hudson Bay. The date of snow-cover onset has important implications for animals that rely on snow cover for shelter, as well as climatic influences on air temperature, ground freezing and lake ice formation.
End date of continuous snow cover

Median End Date of Continuous Snow Cover
Date of publication: 2010, 6th edition
Download the map (ZIP – PDF/JPG, 5.32 MB)
This map shows the median date of snow-cover loss (defined as the last date with 14 consecutive days of snow cover greater than 2 centimetres in depth) computed over 18 winter seasons from1979 to 1997. In areas with permanent or semipermanent snow cover (for example, Arctic ice caps) or in areas with irregular or ephemeral snow cover (coastal British Columbia), researchers were unable to compute the median values. The end date contours follow topography more closely than start date due to the influence of elevation on total snow accumulation and air temperature. The date of snow-cover loss has important implications for wildlife (for example, bird migration and nesting), vegetation, local climate and hydrology.
Average snow depth

Average Maximum Snow Depth
Date of publication: 2010, 6th edition
Download the map (ZIP – PDF/JPG, 4.86 MB)
This map shows the average maximum snow depth in centimetres computed over 18 winter seasons from 1979 to 1997. Over southern Canada this usually occurs in January or February, while the time of maximum accumulation occurs much later in mountain areas and in the Arctic. The main features of the map are the pronounced maximum in snow accumulation over the western Cordillera, where snow depths can exceed several metres, with a secondary maximum over Quebec and Labrador. These maxima are related to their proximity to oceans, which act as sources of moisture and winter storms, and to the orographic effect of the mountains in the case of western Canada.
Download previous editions:
- Canada, Snowfall. 5th edition, 1991 (PDF, 3.3 MB)
- Snow Cover. 4th edition, 1969 (PDF, 2.16 MB)
- Frost, Snow Cover. 4th edition, 1969 (PDF, 2.26 MB)
- Snow Cover. 3rd edition,1958 (PDF, 1.25 MB)
Temperature
Daily maximum temperatures
January mean

January Mean Daily Maximum Temperatures
Date of publication: 2010, 6th edition
Download the map (ZIP – PDF/JPG, 3.92 MB)
This map shows the mean daily maximum temperatures for January calculated from the 1971 to 2000 climate normals. Weak or no sunshine means there is minimal daily variation between the maximum and minimum temperatures in January. The far north remains in an icy grip, with maximum temperatures around -30ºC or colder across parts of Nunavut. Throughout the interior of Canada, maximum temperatures are normally lower than -10ºC. The maximum temperature approaches the melting point across southern Ontario and parts of the Atlantic Provinces. Above-freezing maximum temperatures are experienced only in coastal British Columbia and extreme southern Nova Scotia.
April mean

April Mean Daily Maximum Temperatures
Date of publication: 2010, 6th edition
Download the map (ZIP – PDF/JPG, 6.34 MB)
This map shows the mean daily maximum temperatures for April calculated from the 1971 to 2000 climate normals. Below-freezing maximum temperatures in April are restricted to northern Canada and the extreme northern portions of Ontario and Quebec adjacent to Hudson Bay. Lengthening days and strengthening sunshine bring about a moderation in temperature in all parts of the country. In the high Arctic, maximum temperatures range from -15 to -30ºC, so winter remains present despite the arrival of spring weather across southern Canada.
July mean

July Mean Daily Maximum Temperatures
Date of publication: 2010, 6th edition
Download the map (ZIP – PDF/JPG, 4.95 MB)
This map shows the mean daily maximum temperatures for July calculated from the 1971 to 2000 climate normals. Maximum temperatures in July are above freezing across all of Canada except for high elevations on Ellesmere Island. Maximum temperatures exceed 25ºC in the valley bottoms of southern British Columbia, across the southern Prairies, in southern Ontario and along the St. Lawrence River valley almost to the City of Québec and over parts of central New Brunswick. Maximum temperatures along coastal regions of Atlantic Canada and British Columbia are moderated by the oceans but maximum temperatures near or above 20ºC are the norm.
October mean

October Mean Daily Maximum Temperatures
Date of publication: 2010, 6th edition
Download the map (ZIP – PDF/JPG, 4.73 MB)
This map shows the mean daily maximum temperatures for October calculated from the 1971 to 2000 climate normals. Much of southern Canada experiences maximum temperatures in October above 10°C, whereas maximum temperatures across most of the northern territories are below zero. Only the southern portions of the Yukon and the Northwest Territories have maximum temperatures in October that exceed 0ºC.
Daily minimum temperatures
January mean

January Mean Daily Minimum Temperatures
Date of publication: 2010, 6th edition
Download the map (ZIP – PDF/JPG, 3.78 MB)
This map shows the mean daily minimum temperatures for January calculated from the 1971 to 2000 climate normals. January marks the depths of winter across Canada and, with the exception of the coastal parts of southern Vancouver Island, below freezing minimum temperatures are the norm. The deep freeze is particularly evident near Baker Lake in Nunavut and throughout much of the Arctic Archipelago, where normal January minimum temperatures average in the low -30s and even -40ºC. The low sun angle means that much of the rest of Canada experiences minimum temperatures below -15ºC.
April mean

April Mean Daily Minimum Temperatures
Date of publication: 2010, 6th edition
Download the map (ZIP – PDF/JPG, 5.71 MB)
This map shows the mean daily minimum temperatures for April calculated from the 1971 to 2000 climate normals. Minimum temperatures in April are below freezing for most of Canada. Only extreme southern Ontario, extreme southern Nova Scotia and coastal British Columbia have normal minimum temperatures above freezing. This represents a major warming from January values for all of southern Canada, but winter conditions still dominate the north.
July mean

July Mean Daily Minimum Temperatures
Date of publication: 2010, 6th edition
Download the map (ZIP – PDF/JPG, 4.60 MB)
The map shows the mean daily minimum temperatures for July. Below-freezing minimum temperatures in July are normal only for higher elevations on Ellesmere and Baffin Islands in Canada’s far northeast. Much of southern Canada experiences minimum temperatures above 10ºC in July. Cooler minimum temperatures at higher elevations over the Cordillera are clearly evident. Along the north shores of Lake Erie and Lake Ontario and along the St Lawrence River valley as far east as Montréal, minimum temperatures in July exceed 15°.
October mean

October Mean Daily Minimum Temperatures
Date of publication: 2010, 6th edition
Download the map (ZIP – PDF/JPG, 4.43 MB)
This map shows the mean daily minimum temperatures for October calculated from the 1971 to 2000 climate normals. In October, longer nights and a return to below-freezing minimum temperatures is evident across most of Canada except for coastal British Columbia, southern Ontario and Quebec and most of the Atlantic Provinces. Normal minimum temperatures in October of -10°C or colder are prevalent across most of Nunavut, the Mackenzie Delta and the northern Yukon.
Download previous editions:
- Canada, Temperature – April and October. 5th edition, 1985 (PDF, 13.3 MB)
- Canada, Temperature – January and July. 5th edition, 1985 (PDF, 3.89 MB)
- Temperature – Winter. 4th edition, 1971 (PDF, 2.78 MB)
- Temperature – Spring. 4th edition, 1971 (PDF, 2.78 MB)
- Temperature – Summer. 4th edition, 1971 (PDF, 2.83 MB)
- Temperature – Autumn. 4th edition, 1971 (PDF, 2.73 MB)
- Seasonal Temperatures. 3rd edition, 1958 (PDF, 1.26 MB)
Solar radiation
Solar radiation – annual
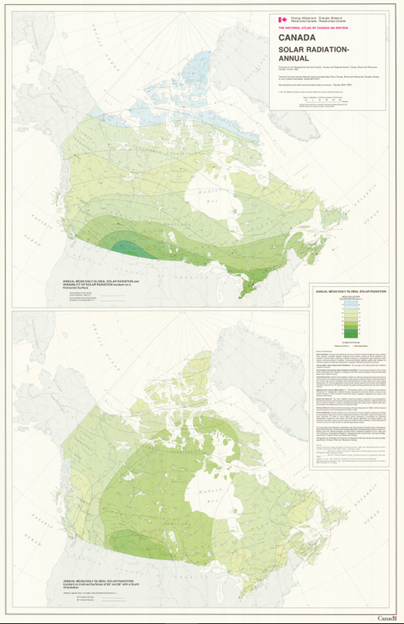
Canada, Solar Radiation – Annual
Date of publication: 1984, 5th edition
Download the map (PDF, 1.95 MB)
Contained within the 5th Edition (1995) of the Atlas of Canada are two maps of solar radiation. The first map shows solar radiation and its variability recorded on a horizontal surface. The second map shows solar radiation recorded on inclined surfaces.
April and October
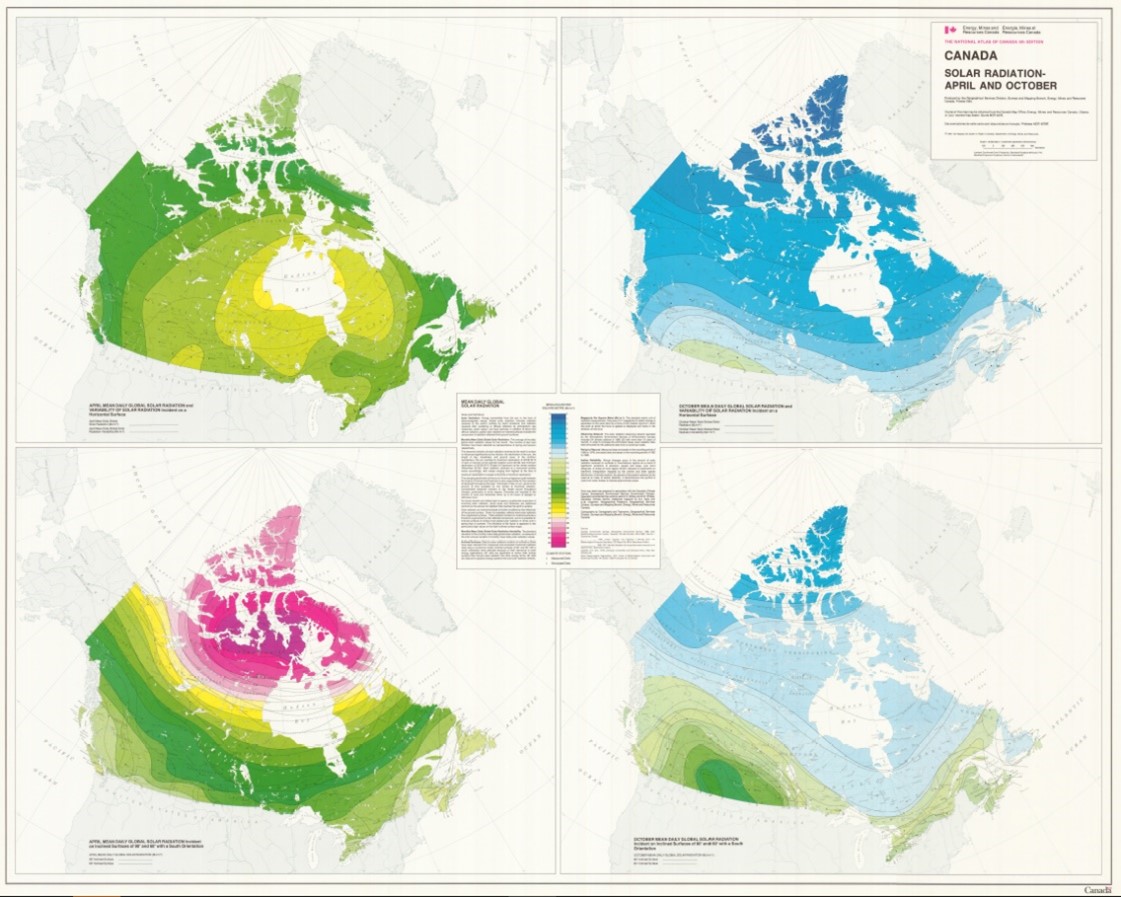
Canada, Solar Radiation – April and October
Date of publication: 1984, 5th edition
Download the map (PDF, 3.78 MB)
Contained within the 5th Edition (1995) of the Atlas of Canada are four maps at the same scale (1:12 500 000) utilizing 26 coloured categories of solar radiation. For each of April and October, one map shows solar radiation and its variability on a horizontal surface, a second shows solar radiation on inclined surfaces.
December and June
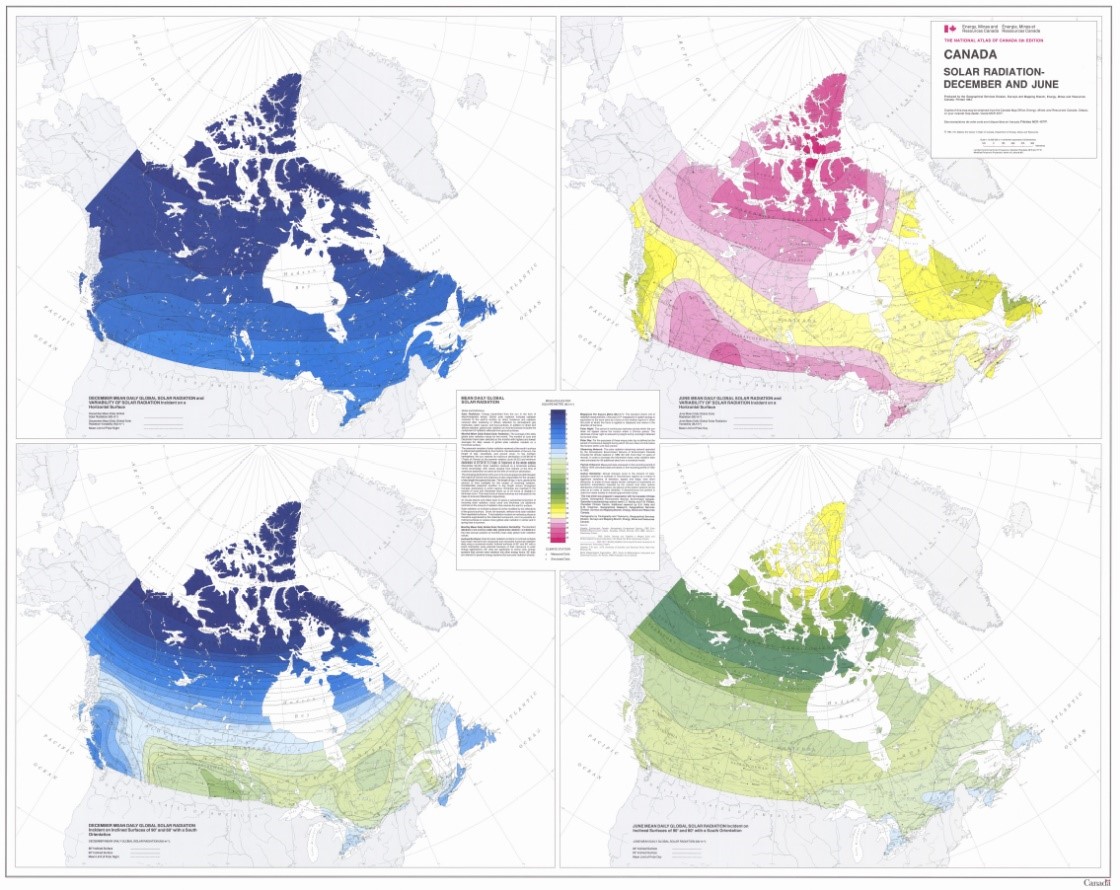
Canada, Solar Radiation – December and June
Date of publication: 1984, 5th edition
Download the map (PDF, 4.40 MB)
Contained within the 5th Edition (1978 to 1995) of the Atlas of Canada are four maps at the same scale (1:12 500 000) utilizing 26 coloured categories of solar radiation. For each of December and June, one map shows solar radiation and its variability on a horizontal surface, a second shows solar radiation on inclined surfaces.
Ecozones
Terrestrial ecozones
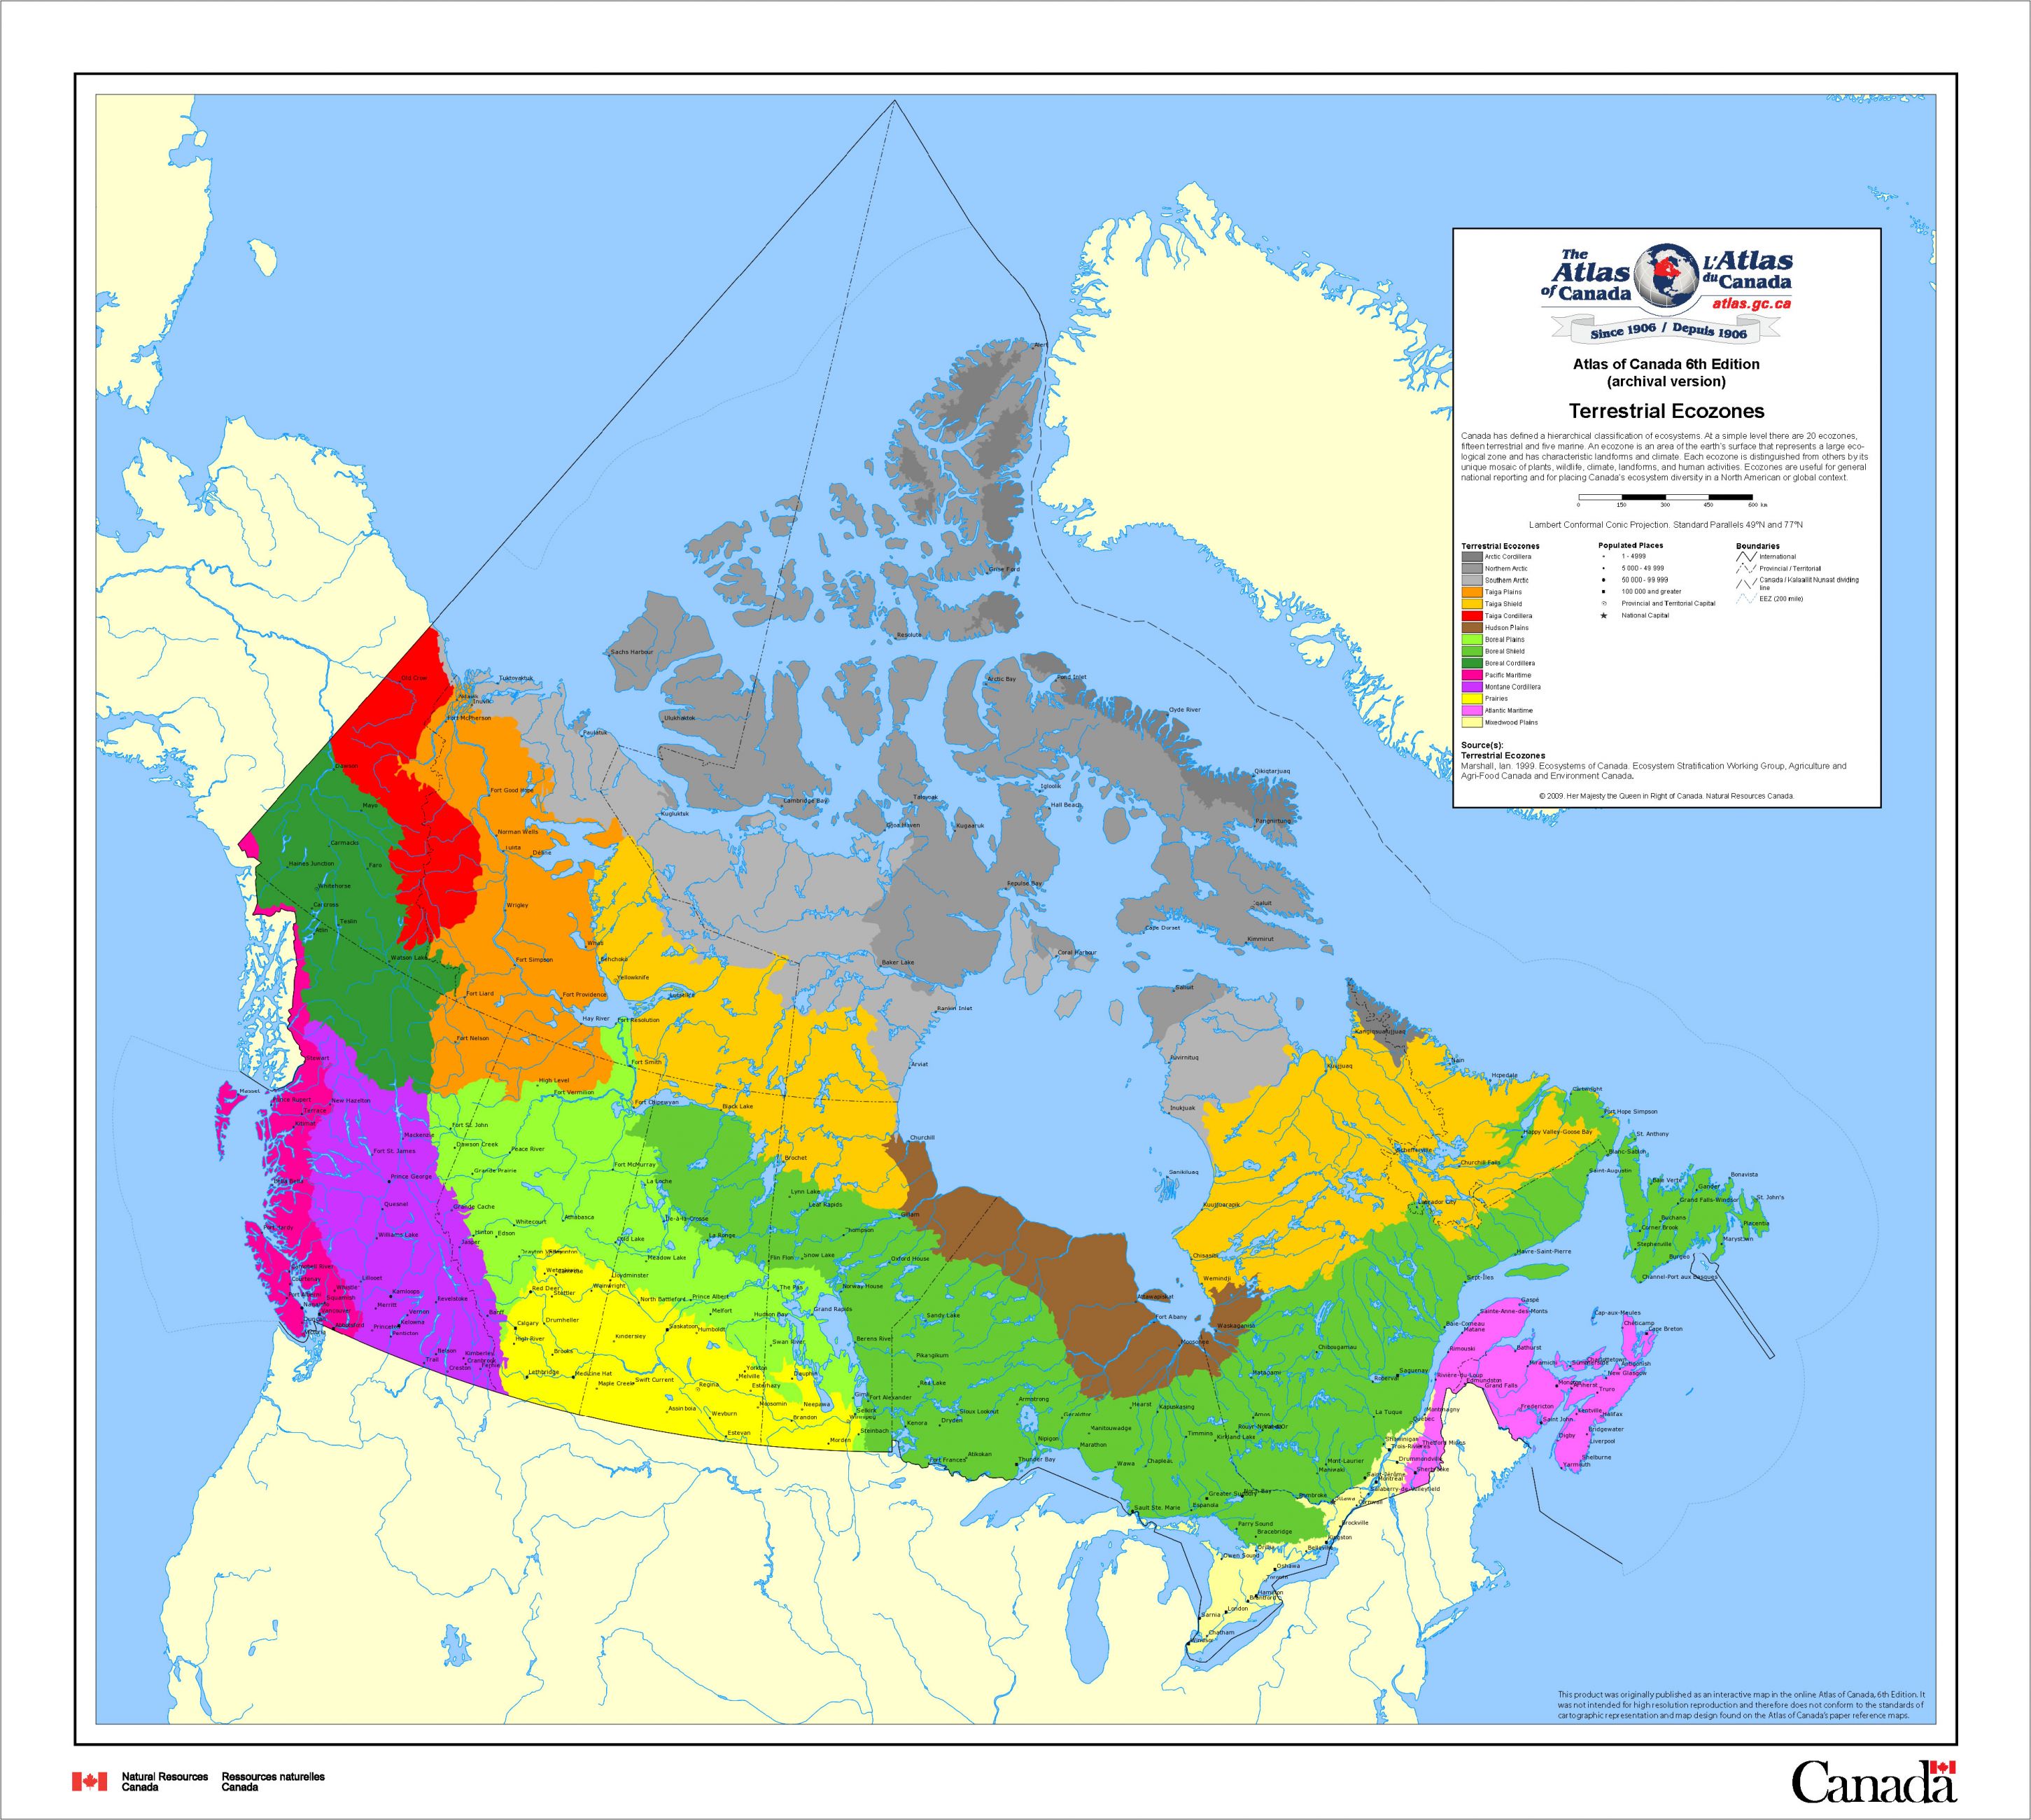
Terrestrial Ecozones
Date of publication: 2010, 6th edition
Download the map (ZIP – PDF/JPG, 4.18 MB)
This map shows the 15 terrestrial ecozones which are Canada’s hierarchical classification of ecosystems. At a simple level there are 20 ecozones, fifteen terrestrial and five marine. An ecozone is an area of the earths surface that represents a large ecological zone and has characteristic landforms and climate. Each ecozone has a unique mosaic of plants, wildlife, climate, landforms, and human activities. Ecozones are useful for general national reporting and for placing Canadas ecosystem diversity in a North American or global context.
Forested Ecozones
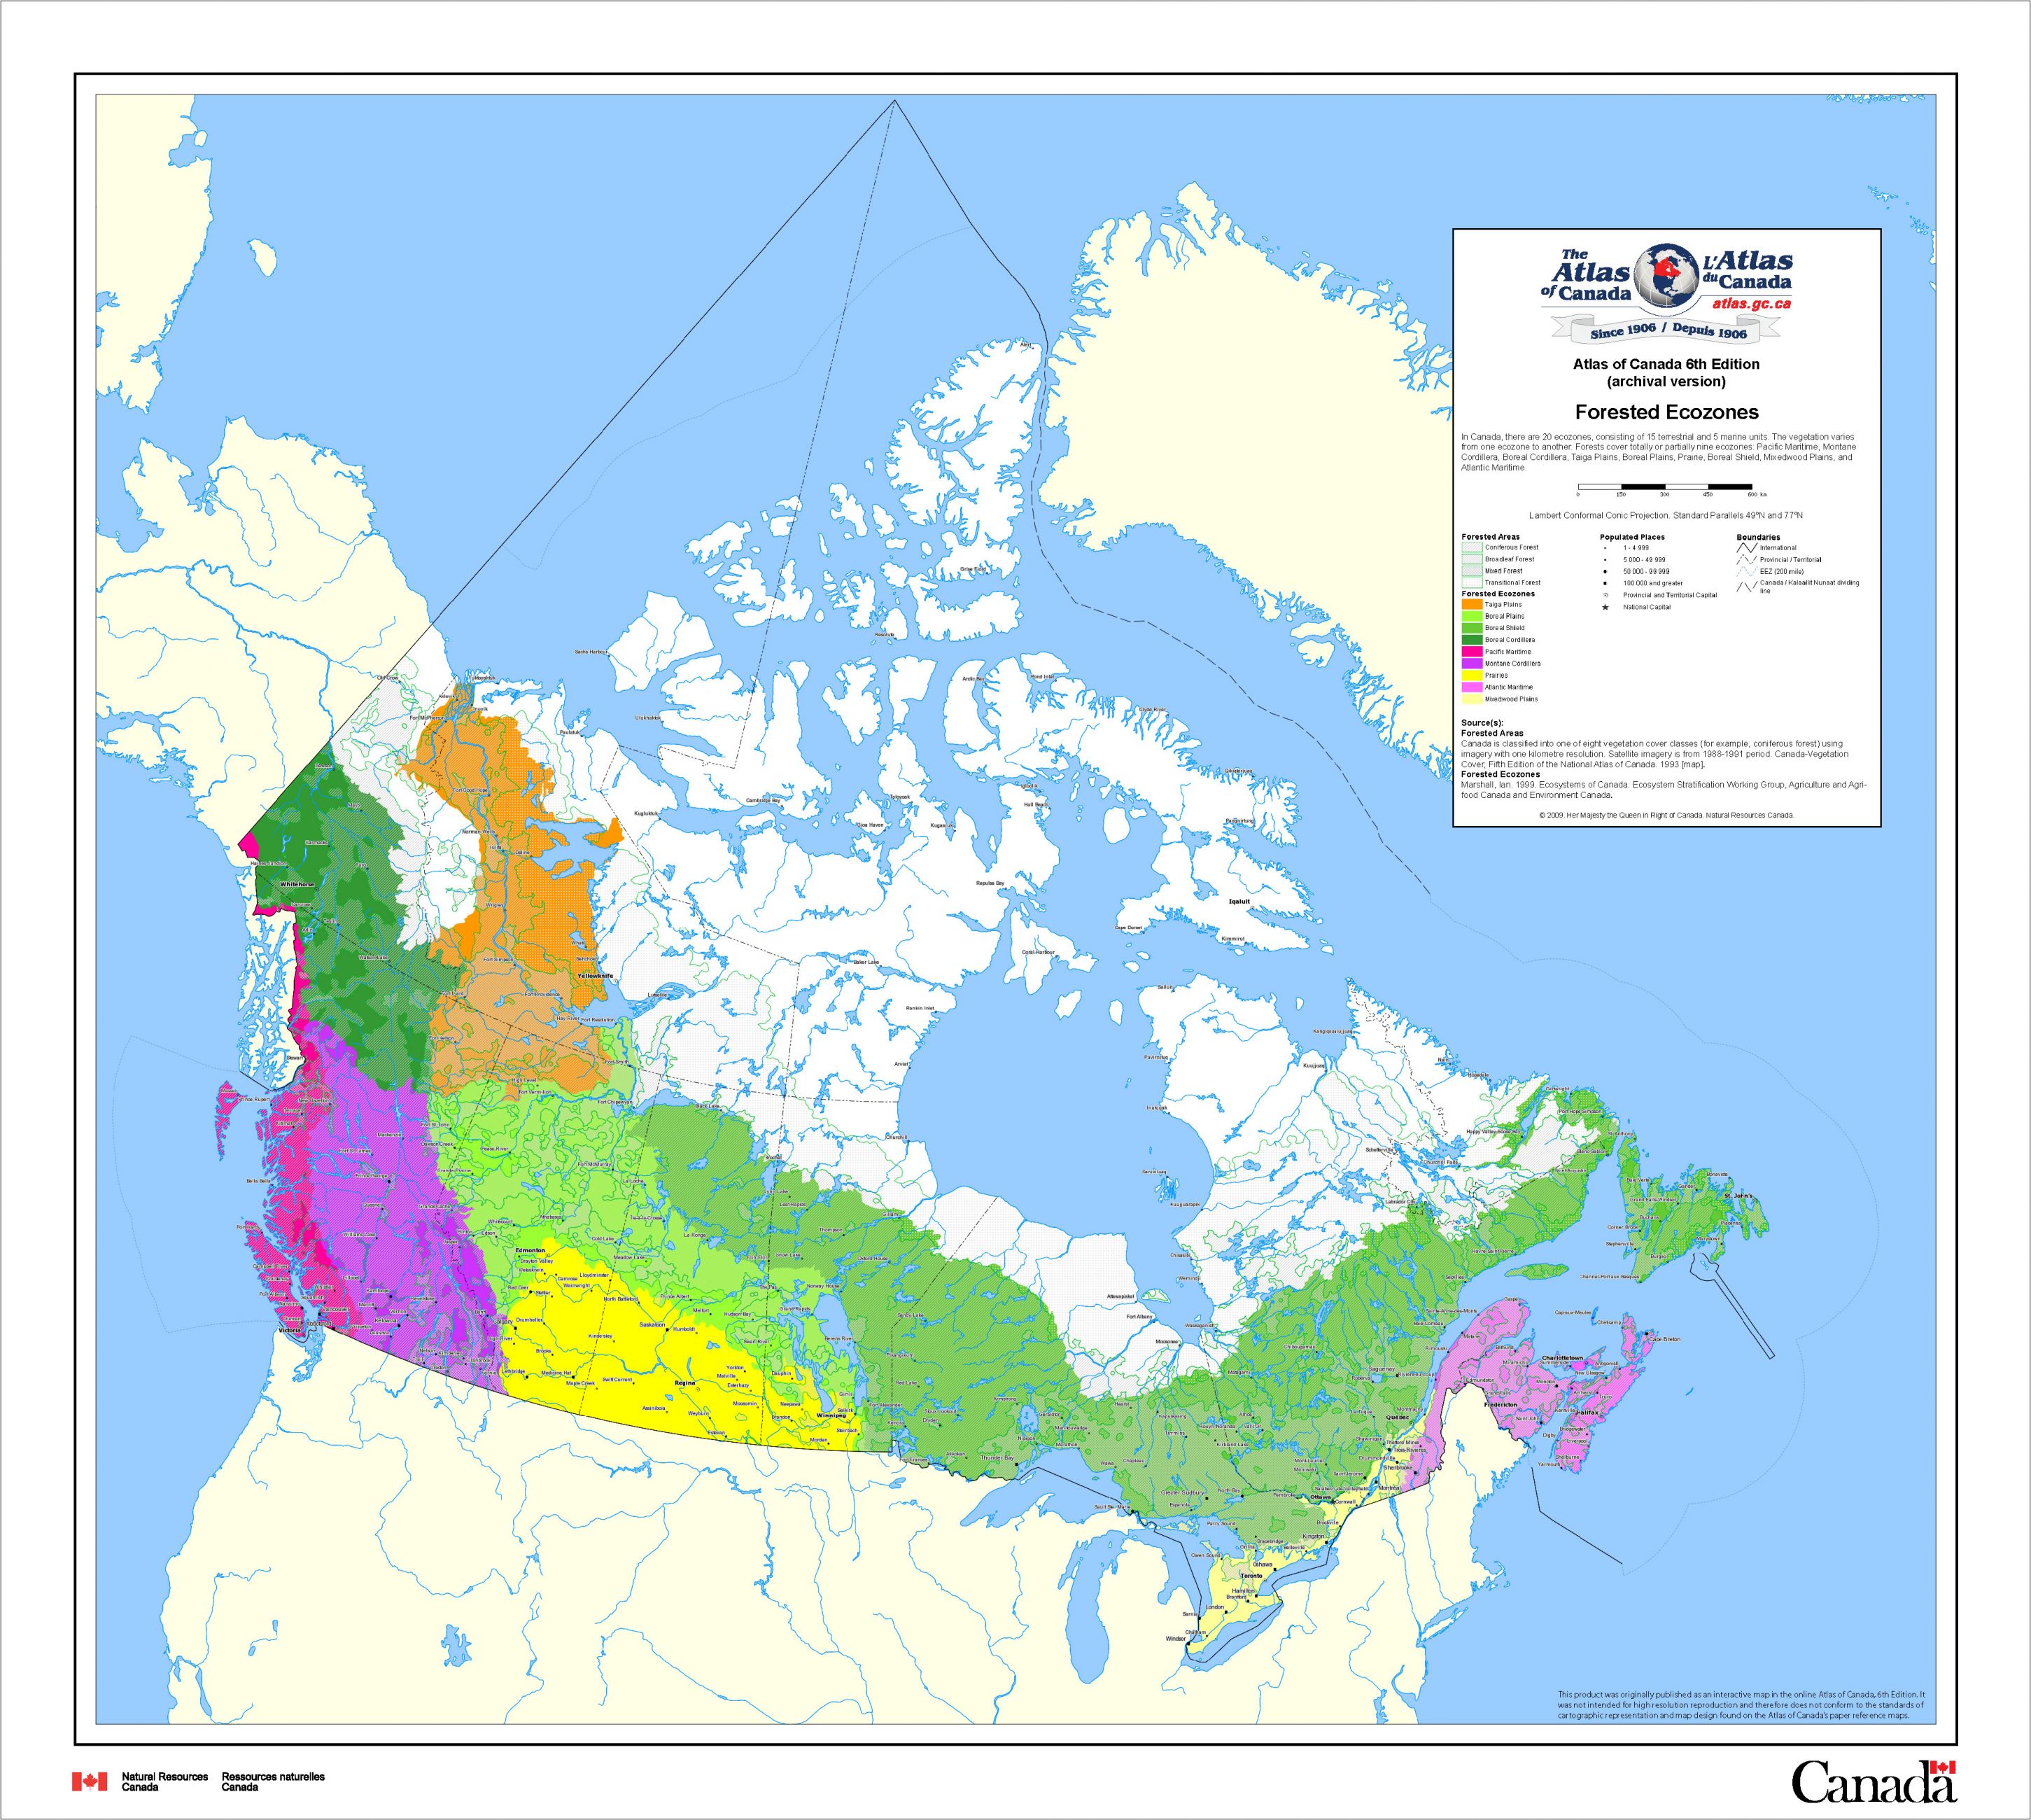
Forested Ecozones
Date of publication: 2010, 6th edition
Download the map (ZIP – PDF/JPG, 5.41 MB)
This map shows ecozones that have some forest coverage. In Canada, there are 20 ecozones, consisting of 15 terrestrial and 5 marine units. The vegetation varies from one ecozone to another. Forests cover totally or partially nine ecozones: Pacific Maritime, Montane Cordillera, Boreal Cordillera, Taiga Plains, Boreal Plains, Prairie, Boreal Shield, Mixedwood Plains, and Atlantic Maritime.
Wetlands

Ecosystem Components: Wetland Diversity
Date of publication: 2010, 6th edition
Download the map (ZIP – PDF/JPG, 4.46 MB)
This map shows the percentage of ecoregions covered by wetland. Wetlands are lands where water saturation is the dominant factor. Wetlands occupy about 18% of Canada, and Canada has about 25% of the world's wetlands. Wetlands foster the growth of hydrophytic vegetation and other biological activities such as the sustenance of large numbers of waterfowl, storage and release of large quantities of water, and the production of large amounts of energy in the form of peat. They offer food and shelter, slow down soil erosion, and contribute to the natural water purification process. Wetland conservation is important particularly in the human-dominated ecozones of southern Canada.
Hazards
Meteorological-Hydrological
Floods
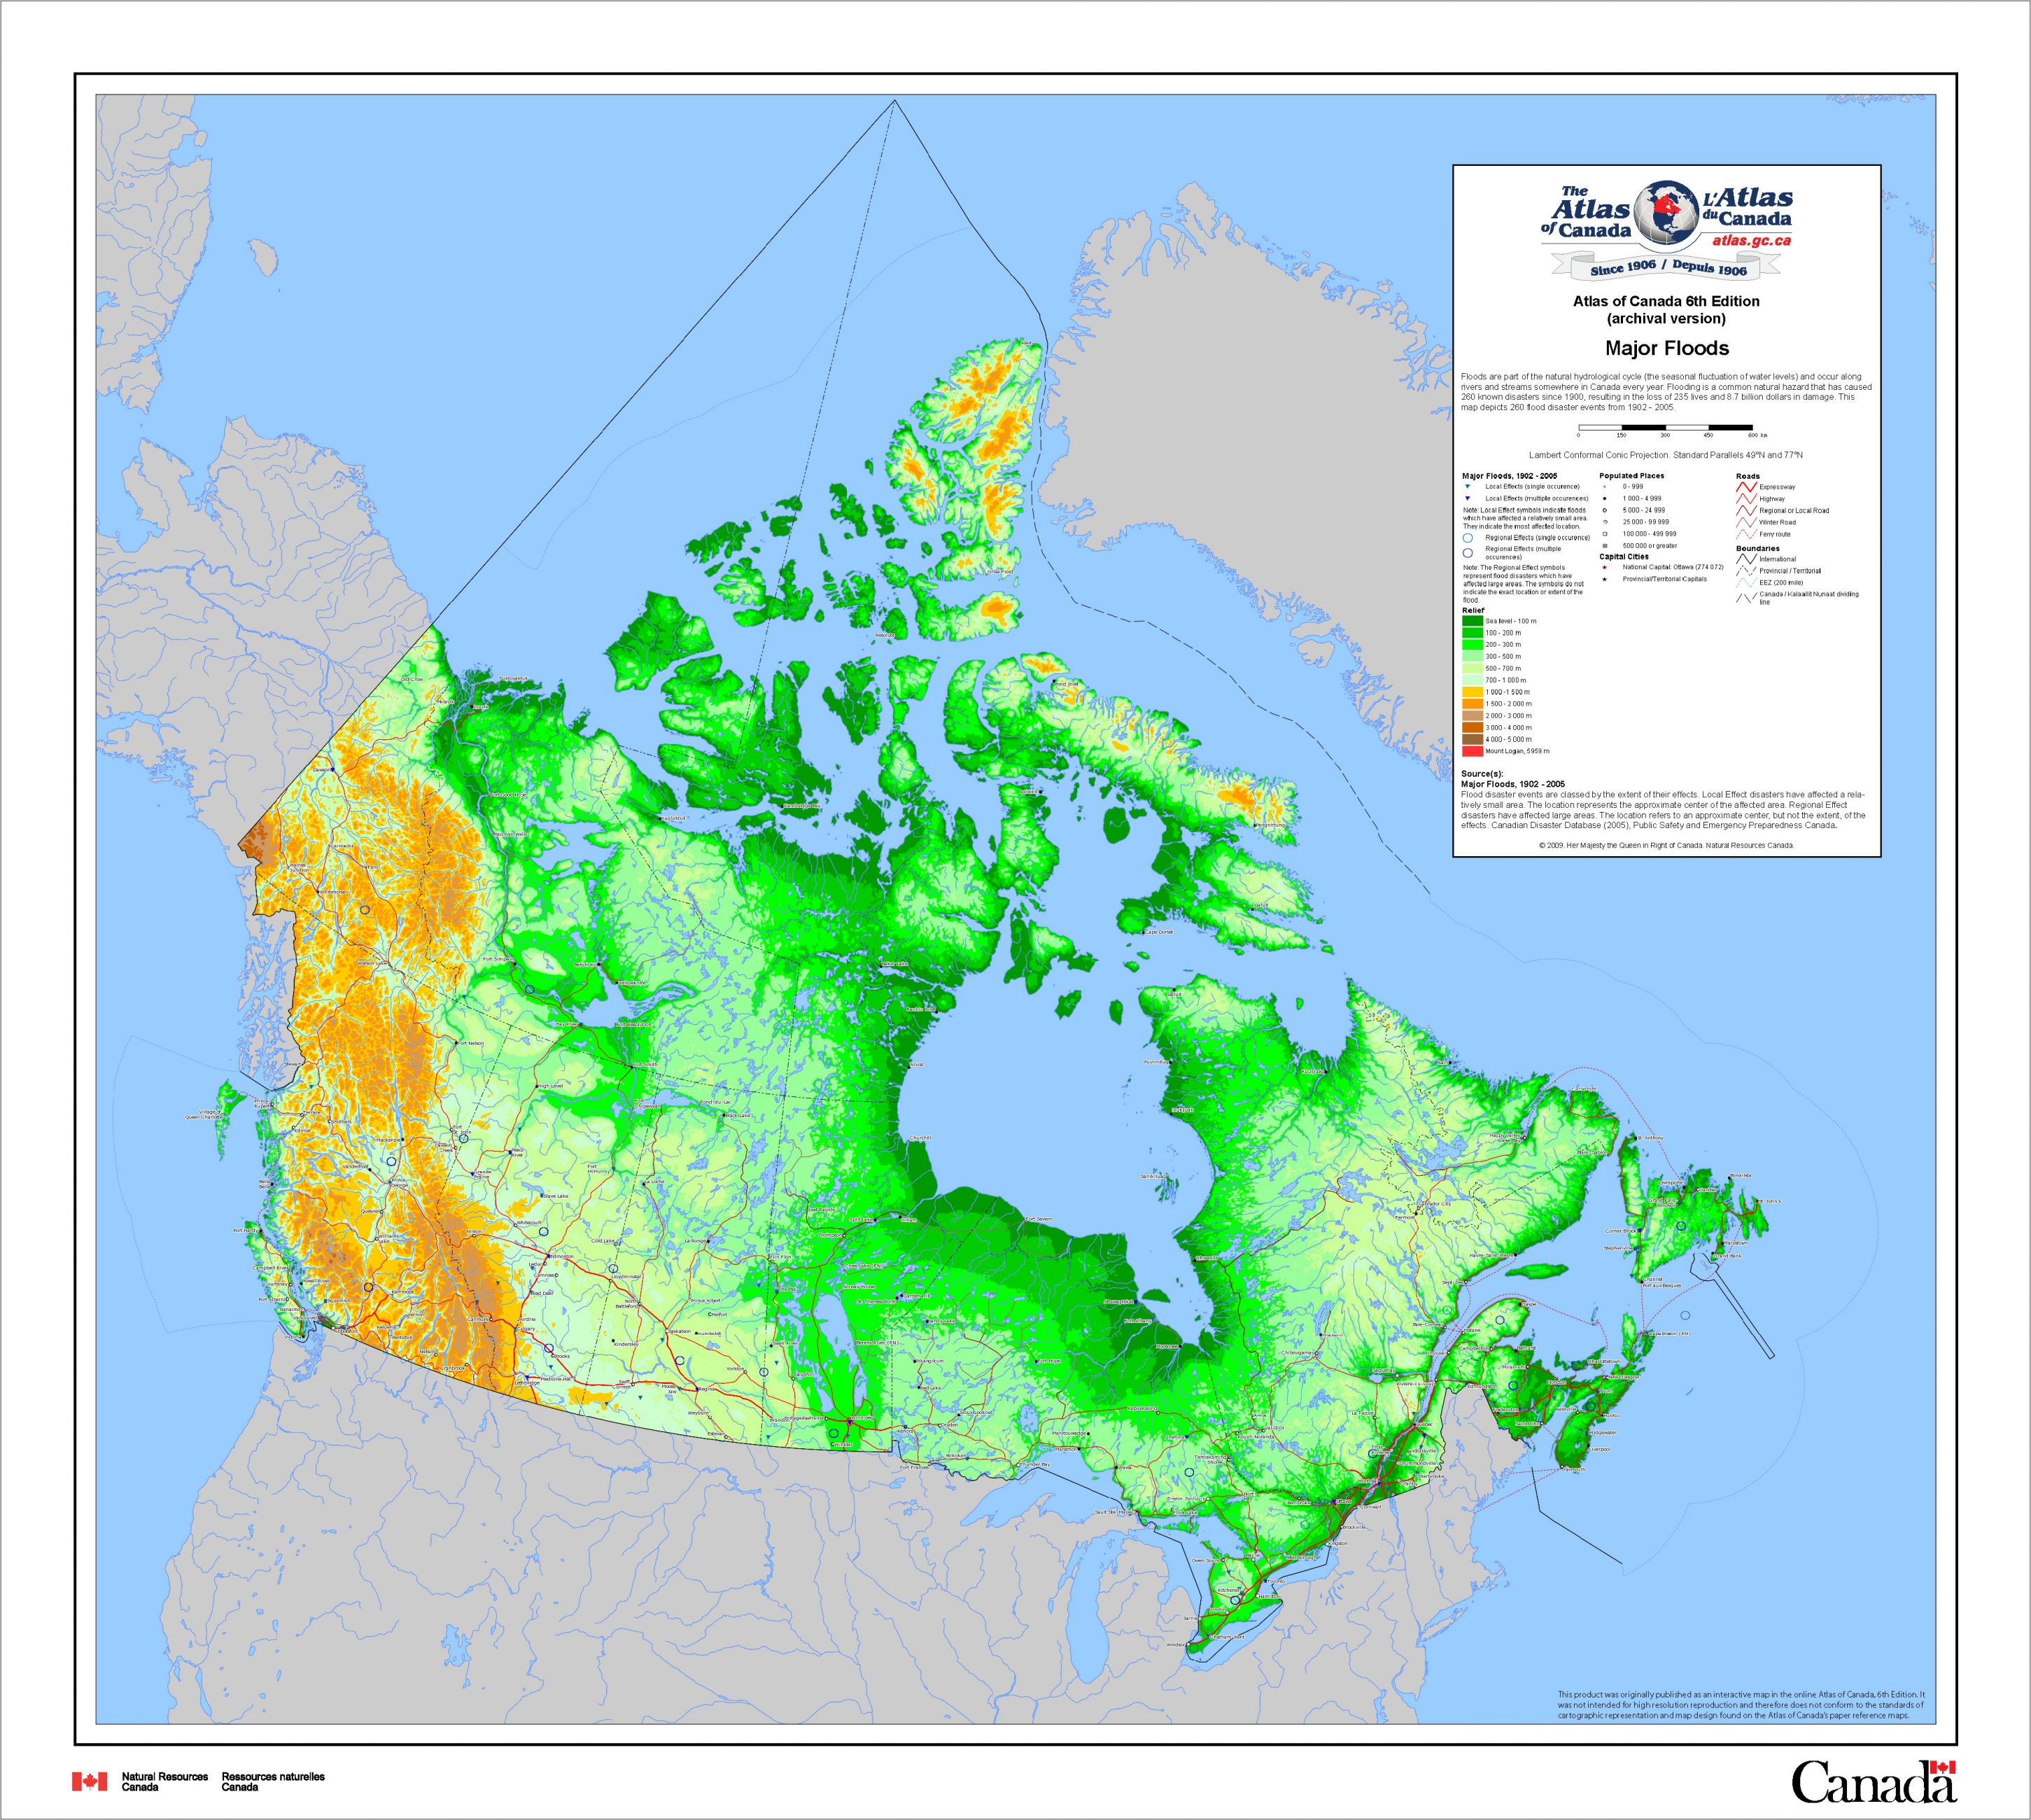
Major Floods
Date of publication: 2010, 6th edition
Download the map (ZIP – PDF/JPG, 9.45 MB)
This map depicts 260 flood disaster events from 1902 - 2005. Floods are part of the natural hydrological cycle (the seasonal fluctuation of water levels) and occur along rivers and streams somewhere in Canada every year. Flooding is a common natural hazard that has caused 260 known disasters since 1900, resulting in the loss of 235 lives and 8.7 billion dollars in damage. For more flood information visit:
Forest fires 2023
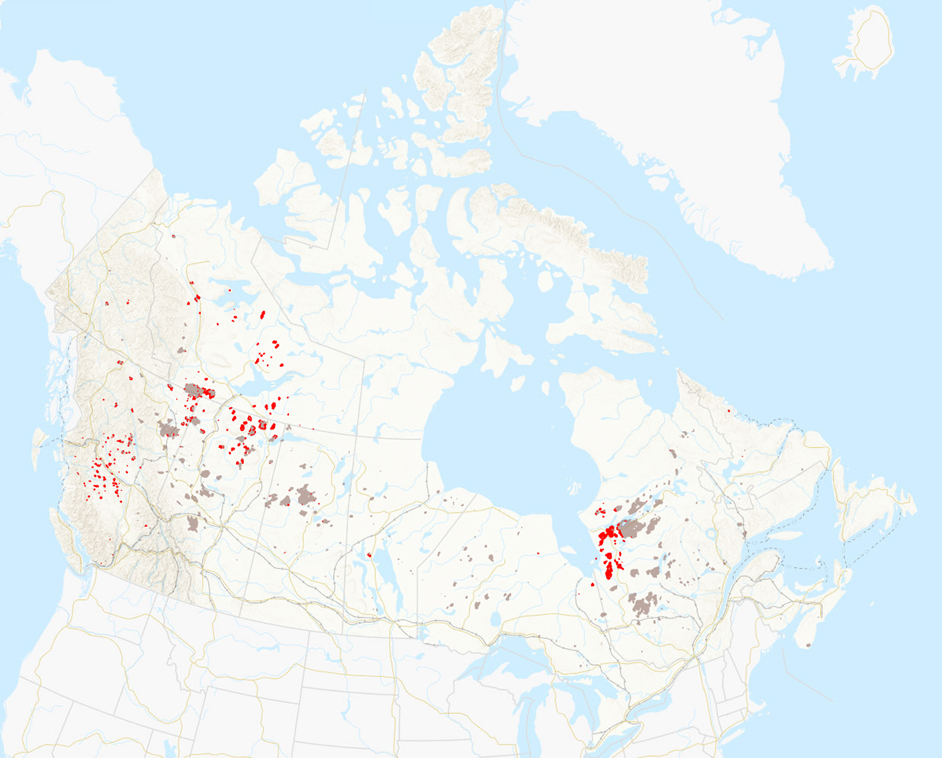
2023 Forest Fires
Date of publication: 2025
This map shows a time-lapse of wildfires between April 19th and September 9th of 2023. Season-to-date wildfire hotspot data were combined and processed to generate the map. During the 2023 season, the most destructive recorded to date, there were 6,132 fires by September 5th.
Forest fires 1980 to 2003

Forest Fires Areas 1980 – 2003
Date of publication: 2010, 6th edition
Download the map (ZIP – PDF/JPG, 6.84 MB)
This map shows fires greater than 1000 hectares from 1980 to 2003. The data represent a compilation of all fire point location and areas for fires greater than 1000 hectares, as provided by fire management agencies of provinces, territories, and Parks Canada.
Avalanches
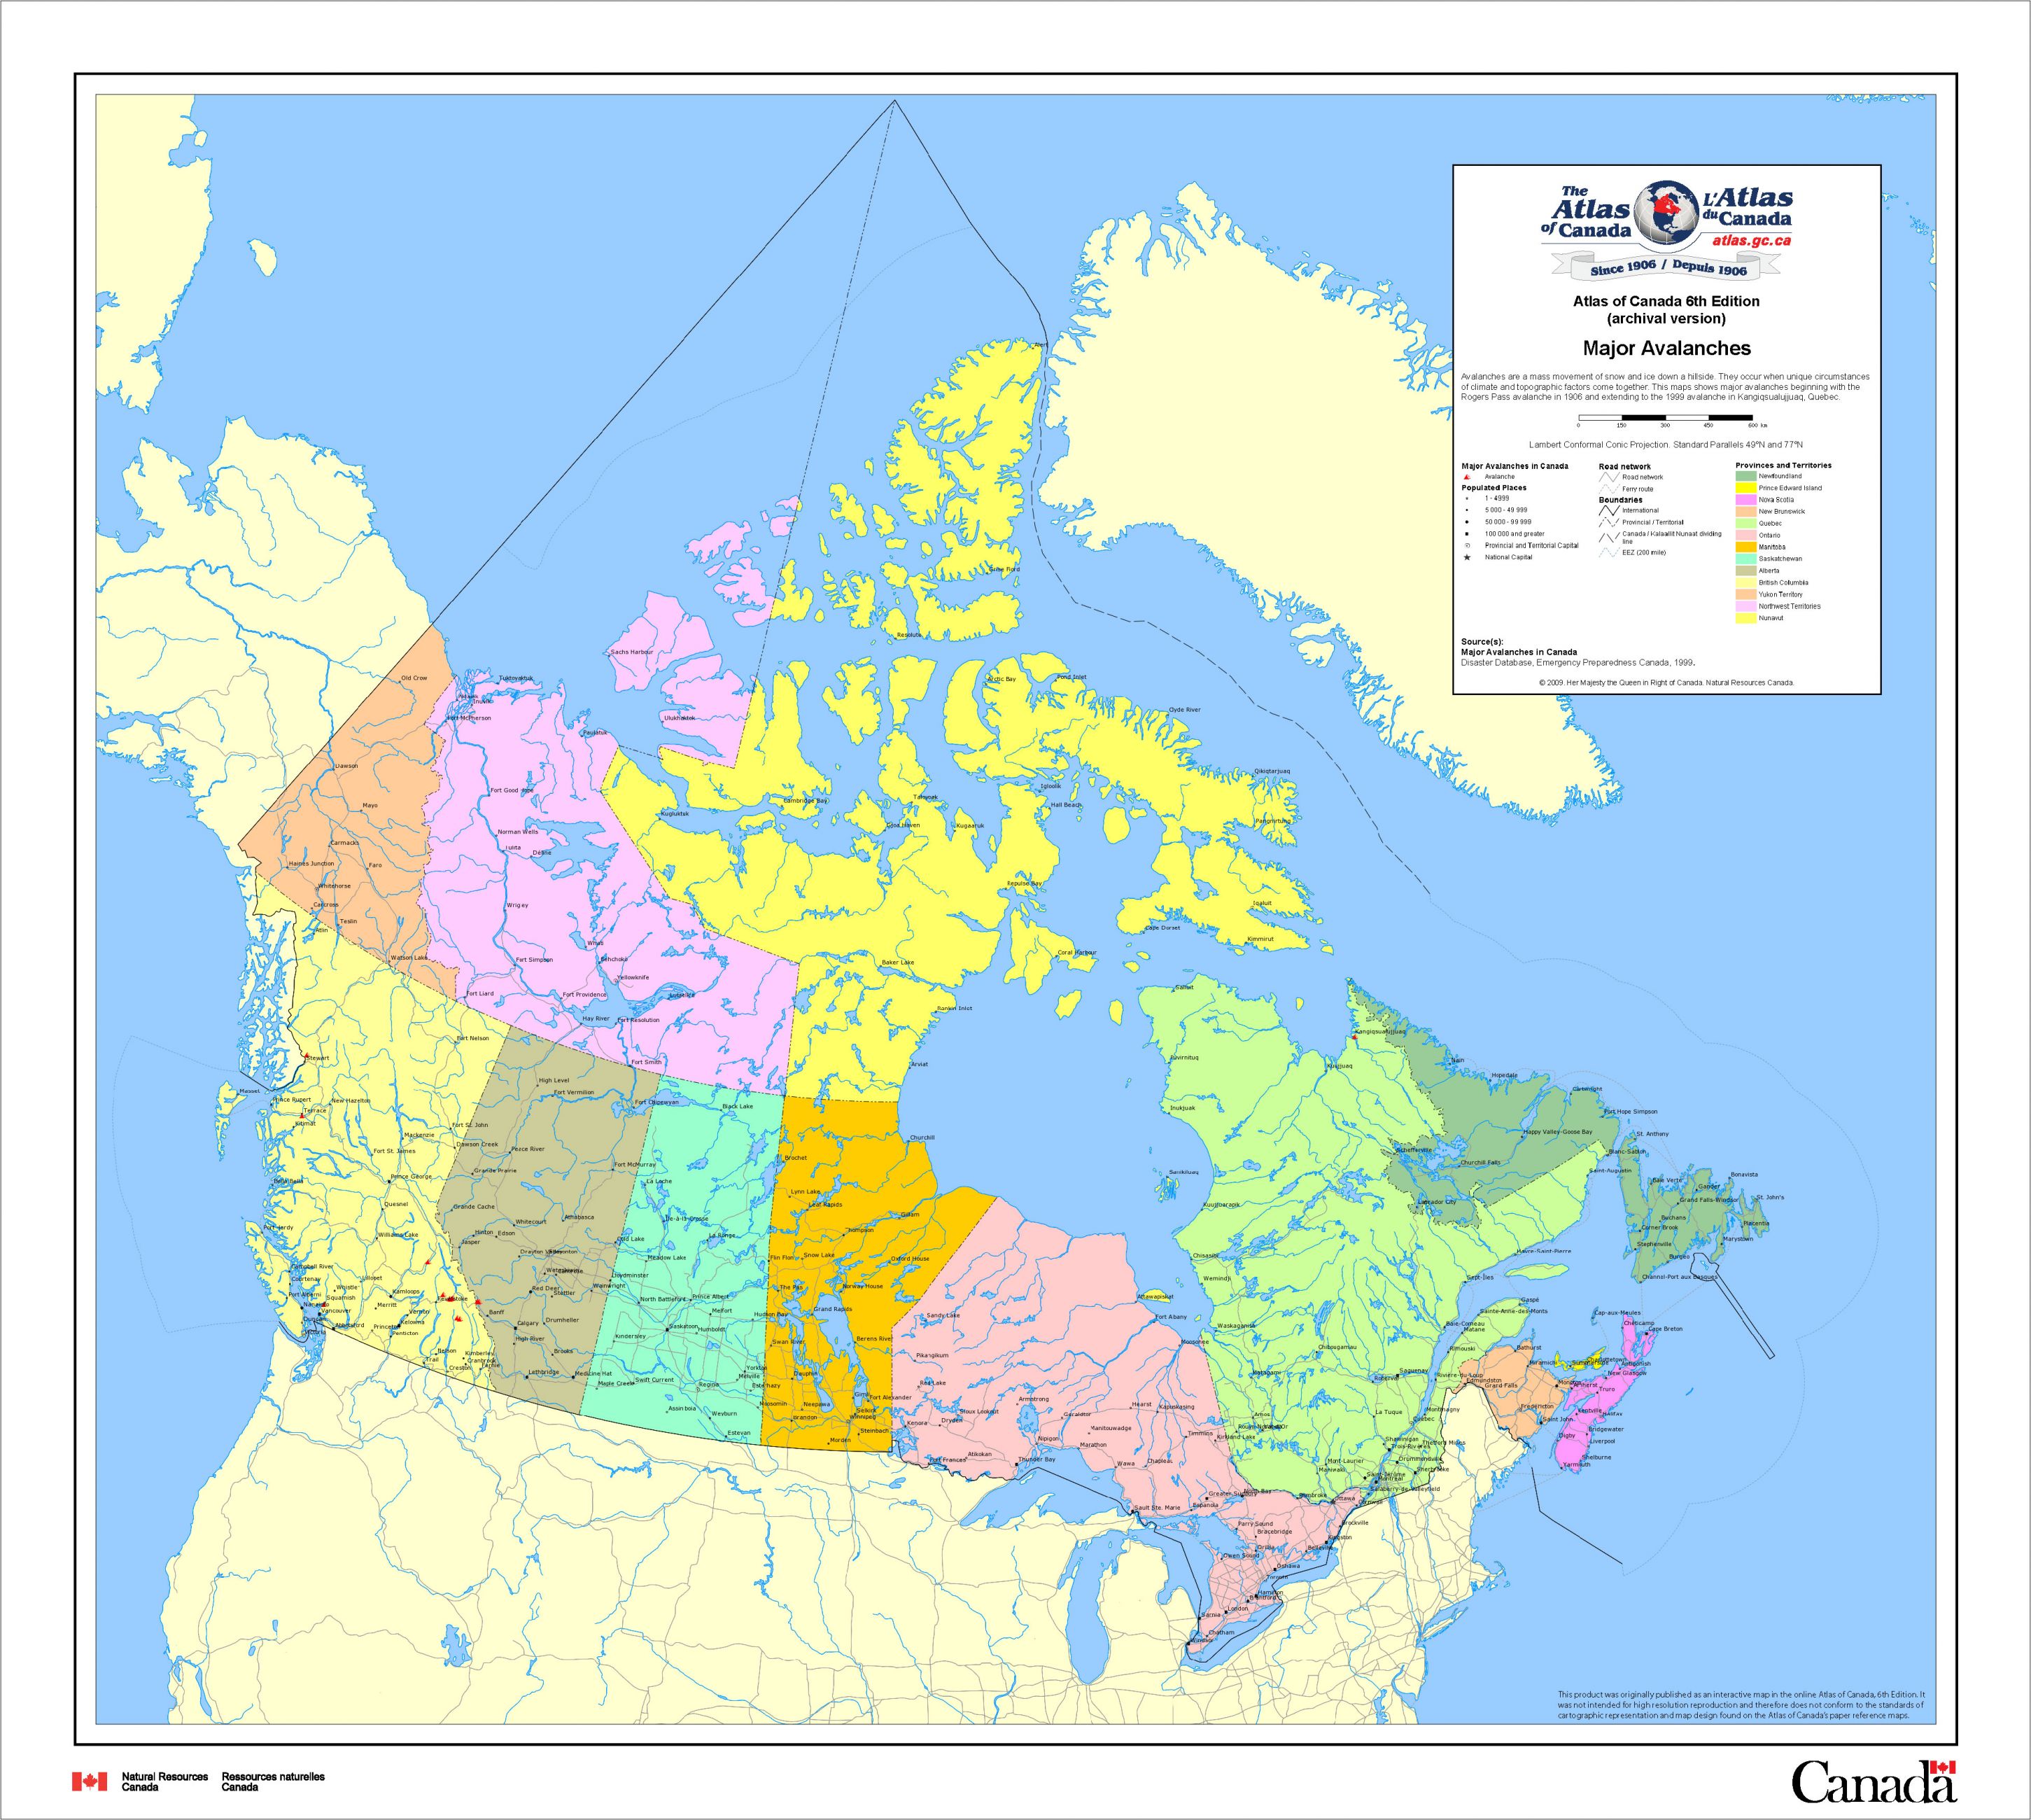
Major Avalanches
Date of publication: 2010, 6th edition
Download the map (ZIP – PDF/JPG, 4.63 MB)
This map shows major avalanches beginning with the Rogers Pass avalanche in 1906 and extending to the 1999 avalanche in Kangiqsualujjuaq, Quebec. Avalanches are a mass movement of snow and ice down a hillside. They occur when unique circumstances of climate and topographic factors come together.
Hailstorms

Major Hailstorms
Date of publication: 2010, 6th edition
Download the map (ZIP – PDF/JPG, 4.66 MB)
This map shows some of the major hailstorms that happened in Canada since the beginning of the 20th Century to 1999. Hail is precipitation consisting of ice pellets with a diameter of 5 millimetres or more. Hailstorms can occur anywhere in Canada. The most common period when hailstorms occur is from May to July, usually occurring with afternoon thunderstorms. Hailstorms with large hail pellets are spectacularly damaging. Smaller storms during the summer growing season cause serious damage to crops.
Hurricanes

Major Hurricanes that Affected Canada
Date of publication: 2010, 6th edition
Download the map (ZIP – PDF/JPG, 4.70 MB)
This map shows some of the major hurricanes that affected Canada from the beginning of the 20th century to 1999. “Hurricane” is one of the names given to a tropical storm whose winds revolve around a center of low pressure, at a minimum speed of 120 kilometres per hour. At a center of hurricanes vortex - the eye - there is calm area of blue sky. Around this central column, there are very strong winds accompanied by torrential rains. A large area beyond the system is affected by violent winds and heavy continuous rain. It is usually this outer area that affects eastern parts of Canada between June and November.
Tornadoes

Major Tornadoes
Date of publication: 2010, 6th edition
Download the map (ZIP – PDF/JPG, 4.72 MB)
This map shows some of the major tornadoes that happened in Canada between the beginning of the 20th century to 1999.Tornadoes are columns of air that spin at a high rate of speed. The area affected by a tornado's passage is between about 40 and 400 metres in width and between 1.7 and 36 kilometres in length. During a tornado, strong winds and an extremely sudden drop in pressure can lead to severe damage. Tornadoes vary in intensity, measured on the Fujita or F scale, graduated from 0 to 5 based on the level of damage. The main season for tornadoes is from April to October, and every province is subject to the risk of tornadoes.
Geological
Earthquakes

Significant Earthquakes and Seismic Hazard
Date of publication: 2010, 6th edition
Download the map (ZIP – PDF/JPG, 4.50 MB)
This map shows the most significant earthquakes recorded in Canada up to 2006. An earthquake is the rapid shaking of the Earth's surface that follows the sudden release of energy within the Earth. They are most caused by movements along the edges of the plates that make up the Earth's crust. Each year, more than 3500 mostly small earthquakes are recorded in or near Canada, 50 of which can be felt. More than half of all the earthquakes in Canada occur along the west coast. There is also scattered activity in southeastern Canada and in the Arctic. The size of an earthquake is measured on a magnitude scale, and its intensity is measured on the Modified Mercalli Scale. Visit Earthquakes Canada for current information on earthquakes across Canada.
Download previous editions:
Landslides

Major Landslides Causing Fatalities
Date of publication: 2010, 6th edition
Download the map (ZIP – PDF/JPG, 7.48 MB)
This map depicts 45 landslides in Canada from 1840 to 2006 that resulted in more than 600 fatalities. Landslides are the downslope movements of sediment and rock. They can be found in any part of Canada, even in areas with very little relief. They happen in bedrock or in loose sediment, on land or under water. They can be large or small, rapid, or slow, and generally occur without warning.
Tsunamis
Tsunamis
Date of publication: 2010, 6th edition
Download the map (ZIP – PDF/JPG, 6.05 MB)
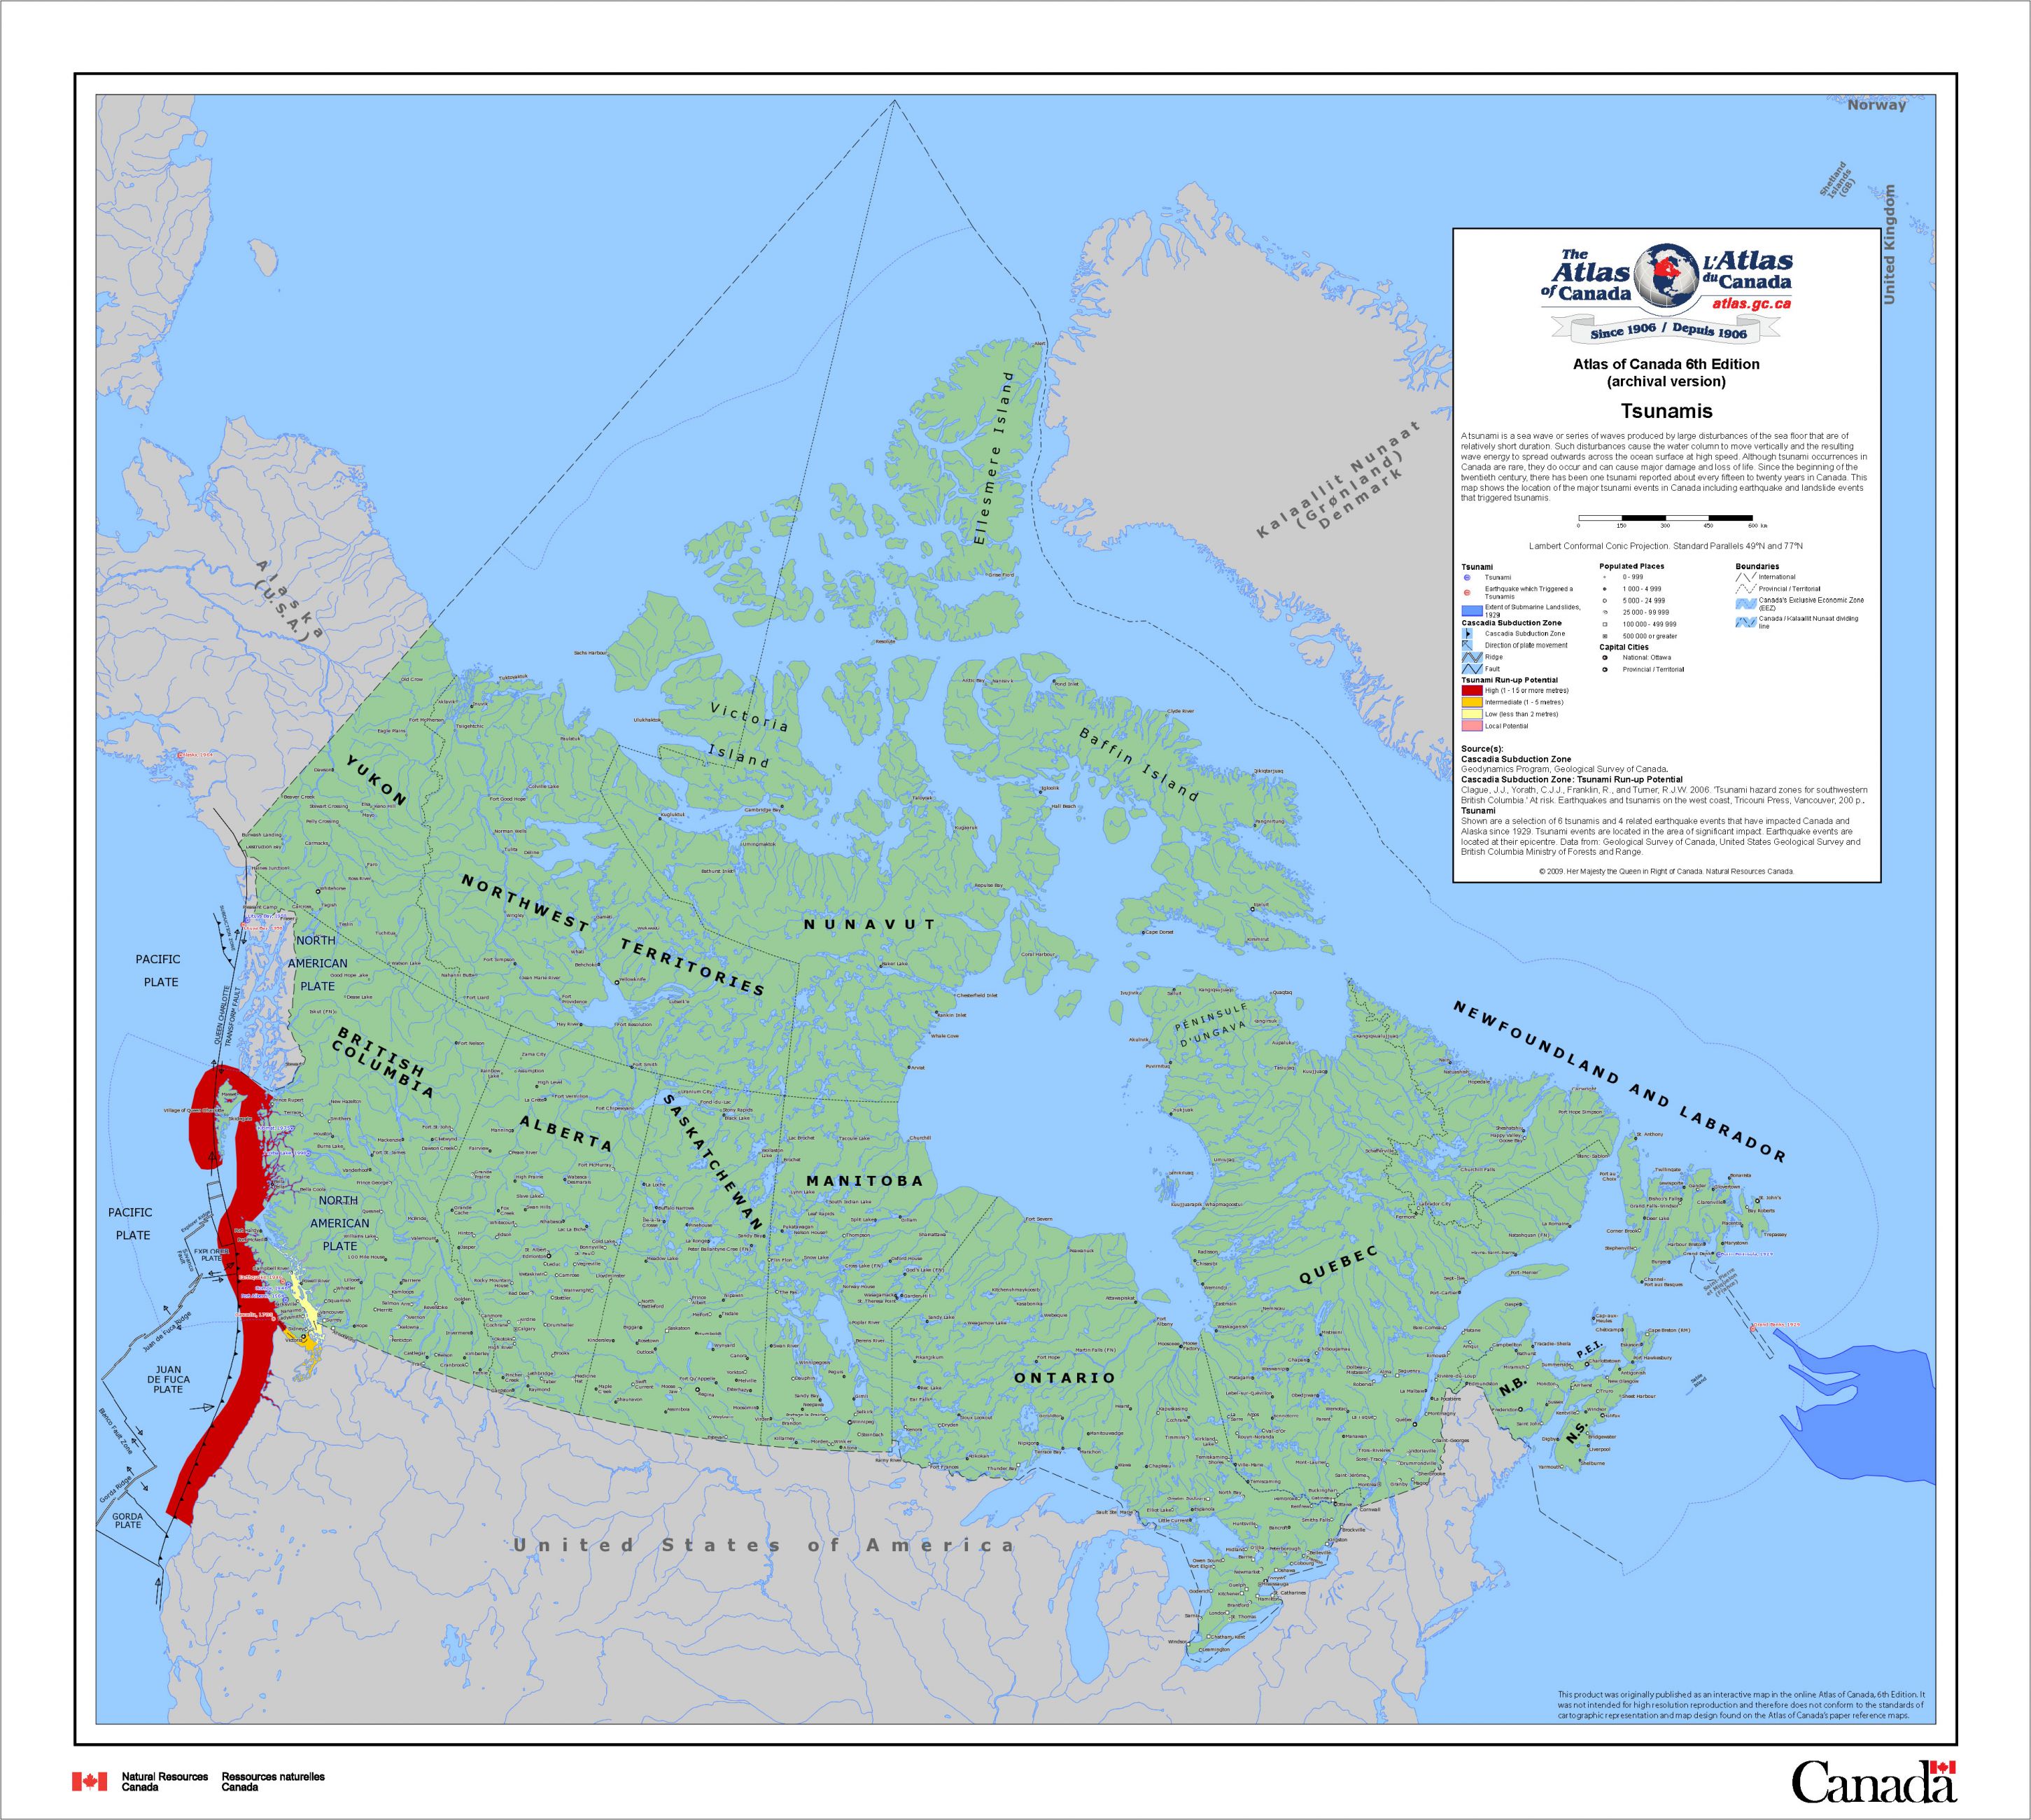
This map shows the location of the major tsunami events in Canada including earthquake and landslide events that triggered tsunamis. A tsunami is a sea wave or series of waves produced by large disturbances of the sea floor that are of relatively short duration. Such disturbances cause the water column to move vertically and the resulting wave energy to spread outwards across the ocean surface at high speed. Although tsunami occurrences in Canada are rare, they do occur and can cause major damage and loss of life. Since the beginning of the twentieth century, there has been one tsunami reported about every fifteen to twenty years in Canada.
Volcanoes
Major Volcanoes
Date of publication: 2010, 6th edition
Download the map (ZIP – PDF/JPG, 8.80 MB)
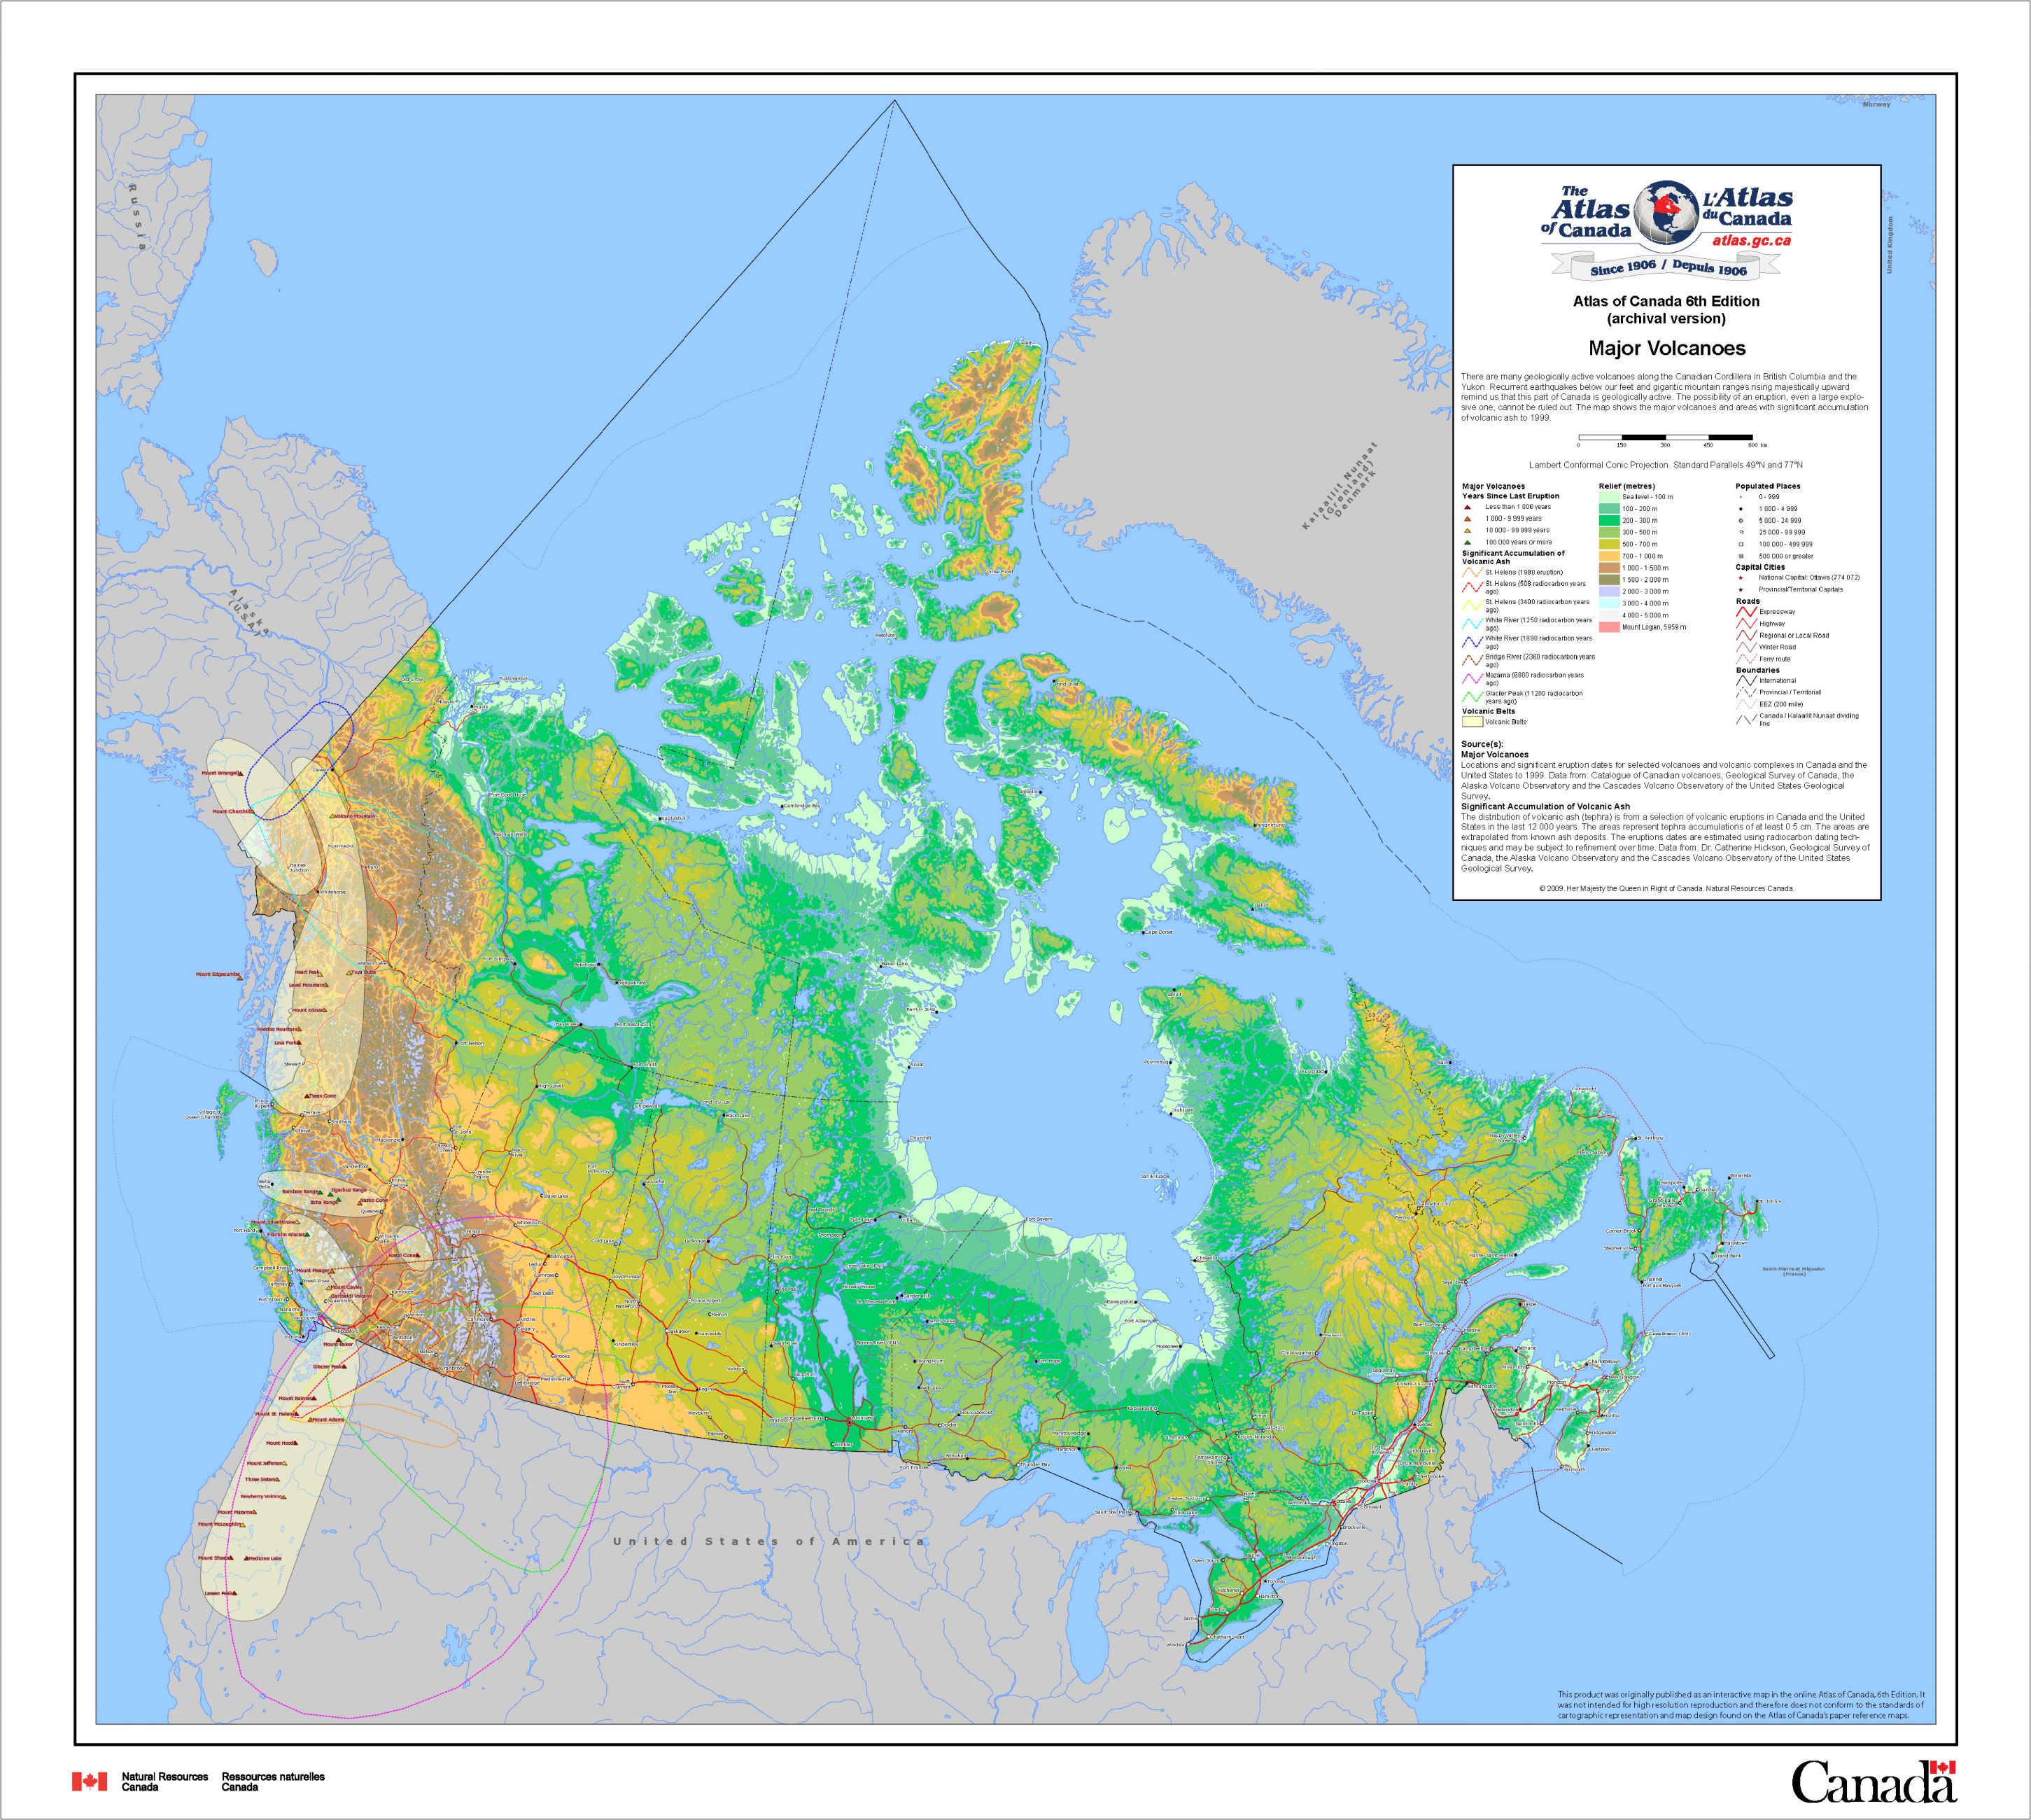
This map shows the major volcanoes and areas with significant accumulation of volcanic ash until 1999. There are many geologically active volcanoes along the Canadian Cordillera in British Columbia and the Yukon. Recurrent earthquakes below our feet and gigantic mountain ranges remind us that this part of Canada is geologically active. The possibility of an eruption, even a large explosive one, cannot be ruled out.
Space weather
Geomagnetic activity zones

Space Weather – Geomagnetic Activity Zones
Date of publication: 2010, 6th edition
Download the map (ZIP – PDF/JPG, 3.35 MB)
This map shows geomagnetic activity zones across Canada. The magnetic field of the Earth is influenced by the electromagnetic environment of the solar system. The disturbed interplanetary environment changes the conditions of the natural electromagnetic environment of our planet and affects normal operation of space and ground technological infrastructures, such as power grids and pipelines. Geomagnetic activity can be described by the sizes of the disturbances in the Earth magnetic field and how often they occur. Geomagnetic activity depends on the geographic location of the observing point. It is defined by the geometry of the Earths geomagnetic field and its interaction with both the charged particles produced by the Sun and the solar/interplanetary magnetic field fluctuations. Canadian territory covers three zones of geomagnetic activity: the polar cap (north of Cambridge Bay), the auroral zone (between Cambridge Bay and Meanook) and the subauroral zone (south of Meanook). The highest geomagnetic activity is observed in the auroral zone.
Telluric activity zones

Space Weather – Telluric Activity Zones
Date of publication: 2010, 6th edition
Download the map (ZIP – PDF/JPG, 3.36 MB)
This map shows telluric activity zones across Canada. The magnetic field of the Earth is influenced by the electromagnetic environment of the solar system. The disturbed interplanetary environment changes the conditions of the natural electromagnetic environment of our planet and affects normal operation of space and ground technological infrastructures, such as power grids and pipelines. The geomagnetically induced currents that directly affect vulnerable infrastructure are driven by the geoelectric (telluric) field. On the map, telluric activity is defined as the annual percentage of the time when variations in the activity is above the normal level of 20 millivolts per kilometre.
Sea ice
Freeze-up of sea ice

Freeze-up of Sea Ice
Date of publication: 2010, 6th edition
Download the map (ZIP – PDF/JPG, 5.55 MB)
This map shows the typical advance of the sea ice cover from late summer (mid-September) to late winter (mid-March). The dates shown in the legend of the map indicate the extent of the sea ice cover at those dates. Sea ice is any form of ice that is found at sea and has originated from the freezing of seawater. Formation of sea ice begins in mid-September in the Canadian Arctic and advances southward through the onset of winter. Sea ice begins to form in the St. Lawrence estuary around the first of January, and advances from coastal inlets into the Gulf of St. Lawrence. Sea ice in Canada normally reaches a maximum extent at the beginning of March.
Break-up of sea ice

Break-up of Sea Ice
Date of publication: 2010, 6th edition
Download the map (ZIP – PDF/JPG, 5.85 MB)
This map shows the typical retreat of the sea ice cover from late winter (mid-March) to late summer (mid-September) on a bi-weekly basis. The dates shown in the legend of the map indicate the extent of the sea ice cover at those dates. Sea ice is any form of ice that is found at sea and has originated from the freezing of seawater. Sea ice begins to melt in spring in the Gulf of St. Lawrence and East Newfoundland, retreating northward towards the Labrador coast. In June openings appear in Baffin Bay and the Beaufort Sea, while clearing is already underway in Hudson Bay. Break-up continues throughout the summer months, reaching a minimum extent around mid-September.
Late winter sea ice conditions

Late Winter Sea Ice Conditions
Date of publication: 2010, 6th edition
Download the map (ZIP – PDF/JPG, 6.05 MB)
This map shows the typical sea ice types near the end of the winter season (February 26) and as well as frequency of sea ice on that date. The frequency of sea ice indicates how often sea ice has been present on February 26 from 1969 to 1998. Based on the observations of sea ice extents and ice types over the 30 year period, this map shows how frequently sea ice has been present, what is the most likely predominant ice type, and where it is located. Sea ice is any form of ice that is found at sea and has originated from the freezing of seawater. The ice type gives an indication of the thickness of sea ice such as new ice, grey ice, grey-white ice, first year ice, and old ice.
Late summer sea ice conditions

Late Summer Sea Ice Conditions
Date of publication: 2010, 6th edition
Download the map (ZIP – PDF/JPG, 5.58 MB)
This map shows the typical sea ice types at the end of the summer melt season (September 10) as well as frequency of sea ice on that date. The frequency of sea ice indicates how often sea ice has been present on September 10 from 1969 to 1998. Based on the observations of sea ice extent and types over the 30 year period, this map shows how frequently sea ice has been present and what is the most likely predominant ice type and where. Sea ice is any form of ice that is found at sea and has originated from the freezing of seawater. The ice type gives an indication of the thickness of sea ice such as new ice, grey ice, grey-white ice, first year ice, and old ice.
Download previous editions:
- Canada, Sea Ice. 5th edition, 1993 (PDF, 14.7 MB)
Species at risk

Threats to Ecosystems – Species at Risk
Date of publication: 2010, 6th edition
Download map (ZIP – PDF/JPG, 4.91 MB)
This map shows the number of species at risk per ecoregion. For most species the greatest threat is the alteration of habitat or essential growing conditions. Species at risk include native mammals, birds, fish, reptiles, amphibians, plants and molluscs that have been assessed as being at risk of extinction at a national level. For more and recent information about permits, funding, consultations, and recovery news visit: Species at risk.