
Updated forecasts of vehicle charging needs, grid impacts and costs for all vehicle segments
February 2024
Prepared for:
 Natural Resources Canada
Submitted to:
Natural Resources Canada
Lawrence Ejike
Engineer, Transportation and Fuel Decarbonization Programs Branch
natural-resources.canada.ca
Dunsky Project Number: 23028
Prepared by:

Dunsky Energy + Climate Advisors
50 Ste-Catherine St. West, suite 420
Montreal, QC, H2X 3V4
www.dunsky.com | info@dunsky.com
+ 1 514 504 9030
With support from:
 The International Council on Clean Transportation (ICCT)
Executive Summary
To meet its climate targets, Canada must reduce GHG emissions from the transportation sector, responsible for 22% of national emissions in 2021. This will require a rapid transition from internal combustion engine (ICE) vehicles to electric vehicles (EVs) and other zero-emission vehicles (ZEVs), alongside other measures like increasing the use of public transit and active transportation. The federal government has set rising sales targets for ZEVs, reaching 100% by 2035 for new light-duty vehicles (LDVs) and 2040 for medium- and heavy-duty vehicles (MHDVs) where feasible.Footnote 1 To achieve this, the government published its Electric Vehicle Availability Standard in December 2023 which will apply to LDV sales starting in 2026. The government is also developing a strategy and regulations to support its MHDV targets.
A key component of these targets will be ensuring sufficient availability of EV charging infrastructure across Canada. Natural Resources Canada (NRCan) commissioned Dunsky Energy + Climate Advisors (Dunsky) and the International Council on Clean Transportation (ICCT) to develop updated charging forecasts for Canada and its provinces and territories, plus key urban regions, for the period 2025 to 2040. Our study expands on previous studies by updating our methodology, incorporating MHDVs, exploring how EV growth will increase demand on electricity grids, and estimating the capital costs and electrical grid investments needed.
Our key findings are as follows:
1. Growing EV adoption will drive the need for public charging infrastructure and EV ready multifamily buildings.
Based on the EV Availability Standard and provincial ZEV Sales Mandates, the number of zero-emission LDVs on the road is expected to grow from approximately 480,000 today to 5 million by 2030, and eventually reach 21 million in 2040.Footnote 2 Under our baseline scenario, this will require about 679,000 public charging ports (a mix of Level 2 [L2] and direct current fast charging [DCFC]) across the country in 2040, or one port for every 31 light-duty EVs (Figure ES 1). This will require the installation of, on average, 40,000 public ports each year between 2025 and 2040, on top of the nearly 30,000 public ports currently available or planned in Canada.Footnote 3
Most EV charging is done at home, but many Canadians in multifamily housing will be unable to install chargers unless existing buildings are retrofitted and new buildings are required to be EV ready. Our baseline scenario is a high home charging access scenario where governments and building owners invest in retrofits of 1.6 million parking spaces in multifamily buildings by 2030 (30% of units that exist today) and nearly 3.2 million by 2035 (60% of units that exist today). Simultaneously, this scenario assumes policy changes that require all new housing to be EV ready starting in 2030. This will require a concerted effort by all levels of government to incentivize and require EV ready retrofits through a mix of regulations (e.g., updates to the building and/or electrical codes) and financial incentives.
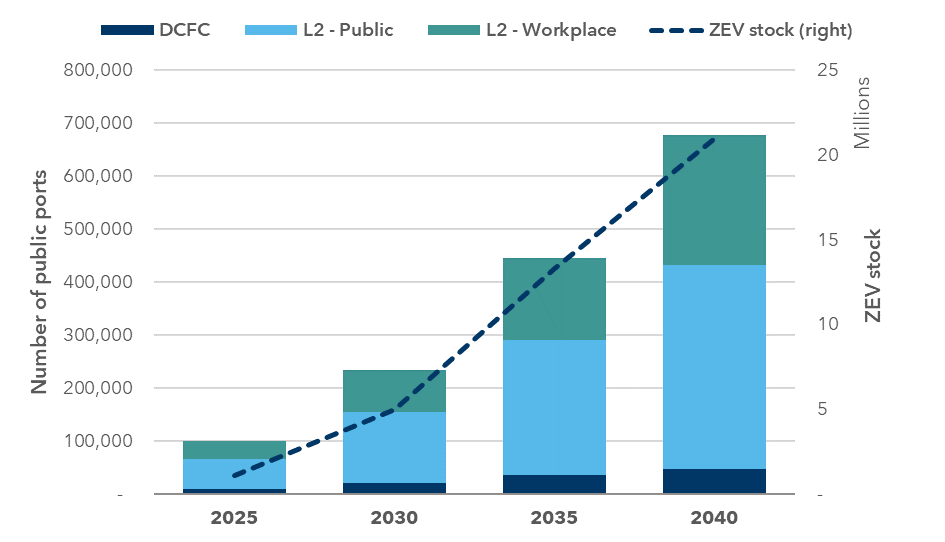
Note: DCFC stands for ‘direct current fast charger’. L2 stands for Level 2.
2. Adoption of zero-emission MHDVs—and the demand for associated charging infrastructure—is in its infancy but is likely to undergo rapid growth in the coming decade.
For the first time, this study estimates the charging needs for MHDVs to support the federal sales target of 100% zero-emission MHDVs by 2040, where feasible. We assume that battery electric vehicles (BEVs) will be the predominant technology, based on previous research by the ICCT and other groups.Footnote 4 However, we also model an alternate scenario under which hydrogen costs fall to competitive levels and a portion of the HDV fleet switches from BEVs to hydrogen-fueled ZEVs (either fuel cell electric vehicles or hydrogen combustion vehicles), and assess by how much the demand for electric charging would be reduced as a result. We do not attempt to model hydrogen refueling infrastructure needs.
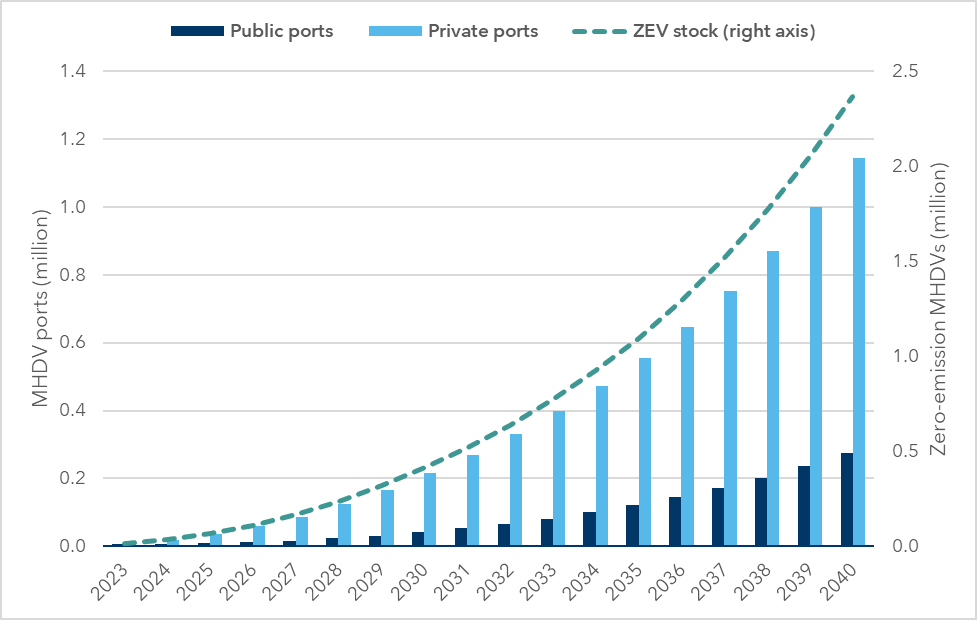
To meet the upper range of the federal sales targets, the number of zero-emission MHDVs on the roads under our policy reference scenario grows to 414,000 in 2030 and 2.4 million by 2040. Relative to LDVs, the growth of demand for public MHDV chargingFootnote 5 starts at close to zero today but grows comparatively quickly over the near term, reaching 41,000 ports in 2030, before growing rapidly to reach 120,000 in 2035 and 275,000 in 2040 (Figure ES 2). Private MHDV charging (including overnight charging in fleet depots and opportunity charging at destination locations such as warehouses) will also play a critical role in electrification of the MHDV fleet, especially in early market development stages. We expect that private and fleet depot charging will require an additional 217,000 ports in 2030 and 1.1 million in 2040.
3. Significant capital investments by governments and private actors will be required between now and 2040 to meet these charging requirements.
Deploying EV charging infrastructure will involve capital costs, including equipment, installation and local electrical upgrades. We developed estimates of national and regional capital costs for the deployment of both LDV and MHDV charging infrastructure, based on per-port cost estimates for various port types, and without considering necessary upgrades to electricity grids (discussed in Section 5).
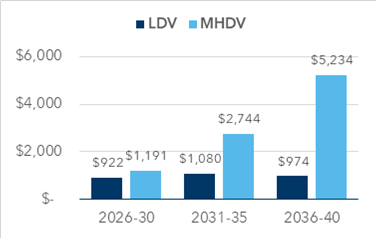
For LDVs, the cumulative capital costs to 2040 for public charging is nearly $18 billion under our baseline scenario. DCFC ports account for 64% of these costs despite making up a small share of ports (7%), due in part to their significant and growing power requirements (from an average of 125 kW per port in 2025 to 300 kW in 2040). For MHDVs, capital costs are generally higher on a per-port basis due to the higher average charging power needs for heavier vehicles with larger batteries. Cumulative capital investments of $47 billion are needed by 2040 to support public charging needs in the MHDV sector (Figure ES 3).
These significant investments in public charging infrastructure will be spread out over the next 15 years. However, the timing is different for each vehicle category. LDV capital costs remain constant – at about $1 billion annually – over the study period. Meanwhile, MHDV capital costs grow from $340 million in 2025, to more than $1.7 billion by 2030, and $6.4 billion by 2040. MHDV charging will also require significant grid upgrades that can be costly and involve long lead times. The associated investments need to happen up to 10 years before the chargers are deployed in order to ensure sufficient power is available at the charging sites. Significant investments for MHDV charging are therefore also expected prior to 2030.
Figure ES 3. Cumulative (left) and annual (right) capital costs for public LDV and MHDV charging from 2025 to 2040, in $ millions
Our analysis does not specify where these investments will come from. Governments at all levels will continue to play a major role in funding public charging infrastructure; for example, the Quebec government recently committed $514 million to add 116,700 chargers to the province’s public network.Footnote 6 Given the scale of investments required, however, public funds will increasingly need to leverage additional private investments; for example, the federal government’s Zero-Emissions Vehicle Investment Program (ZEVIP) provides contributions of up to 50% of capital costs. An earlier iteration, the Electric Vehicle and Alternative Fuel Infrastructure Deployment Initiative (EVAFIDI), leveraged $2 of private capital for every $1 of government funding.Footnote 7 Private sector actors, including automakers and charging providers, are also planning major investments in Canada’s public charging network, in particular DC fast charging in urban areas and along key travel corridors.Footnote 8
4. While most charging infrastructure is concentrated in urban regions and the largest provinces, programs must also consider how to provide equitable coverage across Canada, in particular for rural and remote communities.
We find that community public charging (i.e., located in population centres) represents more than half of future LDV charging needs, with around one-third for workplace charging (which in our model is a mix of public and private). Charging along highway and road corridors and in rural/remote regions represents a relatively small share of total ports (1-2%), although this type of charging is essential to ensure network connectivity and reduce range anxiety among EV owners. A recent federal audit found that “many areas of the country still lacked access to public charging stations … including rural, remote, and Indigenous communities and lower-income areas.”Footnote 9 Future network expansion plans should address these gaps in coverage to ensure equitable access to charging for all residents, and provide reliable charging along travel corridors in remote regions to reduce range anxiety.
For long-haul trucks, the need for a connected highway charging network is even more critical, as gaps in one province could reduce the uptake of EVs in other provinces. A recent study from the US found that long-haul HDV infrastructure can be concentrated along a few “no regrets” corridors, covering just 3% of the national highway freight network.Footnote 10 This suggests that a strategic approach to target highway MHDV charging investments may help achieve adoption targets at lower cost.
We found that four provinces (Ontario, Quebec, British Columbia, and Alberta) dominate overall future charging needs for both LDVs and MHDVs, accounting for 84% of public LDV ports and 92% of MHDV ports in 2040. However, all regions will need to rapidly grow their public networks from the current baseline to meet near-term milestones. We also explored charging needs in three major urban regions – Toronto, Montreal and Vancouver – finding that in addition to significant public charging needs (for example, the Toronto region alone will be home to more public charging ports (167,000) in 2040 than any province other than Ontario), more than 1.6 million EV-ready retrofits will be needed to enable residents in apartments and condos to charge at home.
5. The growing demand for EV charging will require upgrades and investments in electricity grids across Canada.
EV charging presents a significant additional load on electricity grids, adding to both energy and capacity needs. In speaking to utilities and system operators for this project, we heard that in many cases they are already planning for significant demand growth from electrification of transportation and other end uses (e.g., home heating). Utility representatives also told us how important it is to have federal targets and regulations (e.g., the EV Availability Standard and ZEV sales targets) to provide critical certainty and enable them to plan and invest in a future electricity system that is both larger and emissions-free.
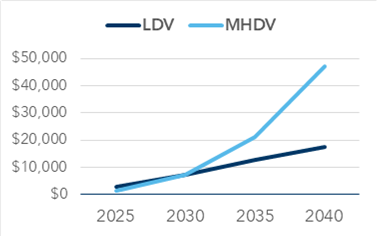
We estimate that LDV and MHDV charging could add up to approximately 4,300 MW of demand in 2030, growing to 22,500 MW in 2040. Our estimate of grid upgrades required to meet EV demand—including generation, transmission and distribution—ranges from $26 billion to 294 billion (mid-range: $94 billion) over the 2025 to 2040 period, reflecting the significant uncertainty around the magnitude of costs, as well as regional variations. On a per-vehicle basis this works out to $3,000 per LDV and $17,000 per MHDV. To put this cost into further context, Canadians spent approximately $70 billion on gasoline in 2022; in a future where the vehicle fleet is increasingly electric, we expect to see greater revenues for electric utilities which can use this to finance necessary grid upgrades.
Since EV charging is a flexible load, our results incorporate management mechanisms to shift the timing of charging from peak to off-peak periods. Actual charging patterns will depend on several factors which are difficult to forecast; however, other studies have shown significant potential for EVs to provide grid services acting as distributed energy resources (DERs), such as behind-the-meter battery storage. Managed EV charging is one of the most cost-effective measures to reduce peak electricity demand.Footnote 11 If utilities and provincial governments implement such strategies at scale, they could further reduce the overall demands on the grid and the need for costly generation, transmission and distribution upgrades, beyond what is forecast by our results.
6. The overall need for public charging—and associated investments—can be reduced through public policy interventions.
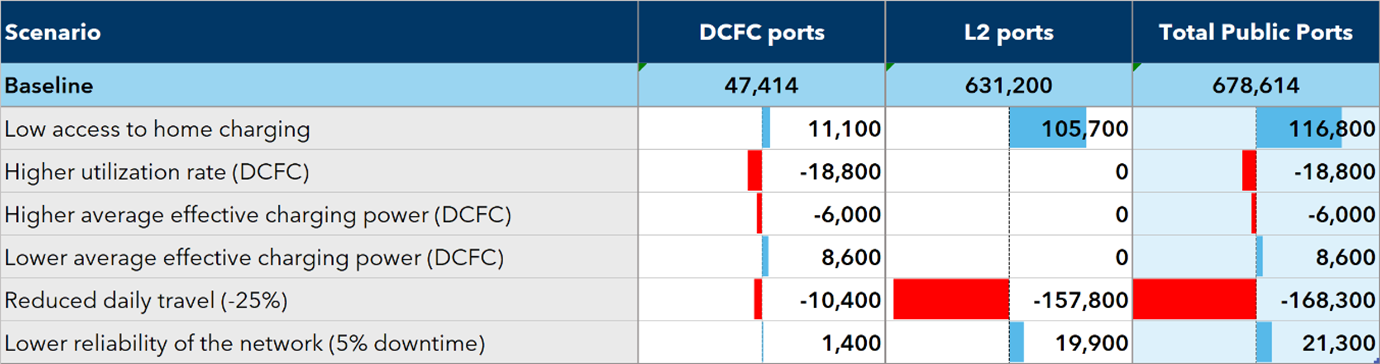
We developed several alternative scenarios to explore what different EV charging futures could look like (Figure ES 4). Under a scenario where Canadians drive 25% fewer kilometres, the number of public LDV ports required is 58,000 lower in 2030 and 168,000 lower in 2040. In scenarios where effective charging power and utilization rates are higher, the number of public ports could fall by another 25,000. A 25% decrease in driving distance would require significant investments in alternative modes of transport—including public transit, cycling and walking—as well as changes to urban planning and design to encourage less car-oriented communities.
Text Version
| Scenario | DCFC ports | L2 ports | Total Public Ports |
|---|---|---|---|
| Baseline | 47,414 | 631,200 | 678,614 |
| Low access to home charging | 11,100 | 105,700 | 116,800 |
| Higher utilization rate (DCFC) | -18,800 | 0 | -18,800 |
| Higher average effective charging power (DCFC) | -6,000 | 0 | -6,000 |
| Lower average effective charging power (DCFC) | 8,600 | 0 | 8,600 |
| Reduced daily travel (-25%) | -10,400 | -157,800 | -168,300 |
| Lower reliability of the network (5% downtime) | 1,400 | 19,900 | 21,300 |
An alternate future pathway in which multifamily buildings have less access to charging, public networks are less reliable, and charging power is lower, could result in a need for 153,000 (+23%) more public ports across Canada than the baseline (Figure ES 5). Under this pathway, public charging networks would need to be overbuilt to compensate for lower reliability, and more public charging would be required to compensate for the slower pace of MFU EV-ready retrofits. Avoiding this scenario would require policy interventions to update regulations and standards (e.g., model building and/or electrical codes) as well as financial and other incentives to support EV-ready retrofits.
Figure ES 5. Selected alternative future LDV charging pathways (High, Baseline or Low charging pathways)
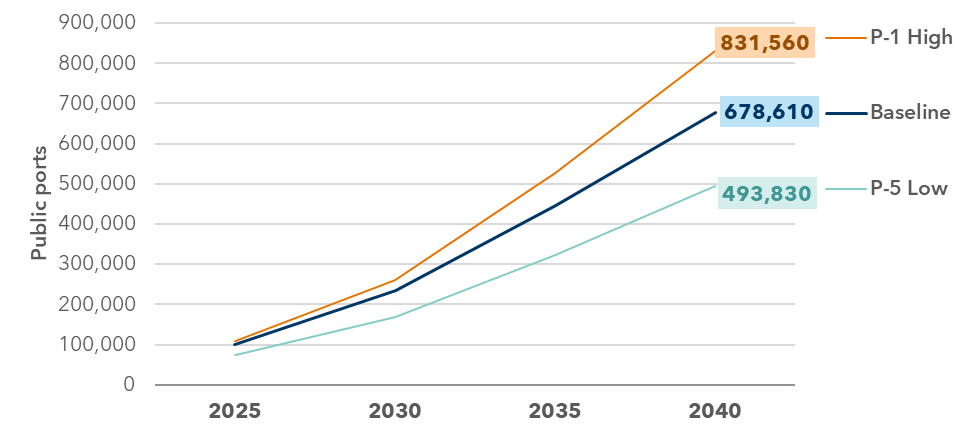
Exploring such alternate scenarios, as Figure ES 5 illustrates, is useful to help understand how future policy changes, technology shifts and market trends could impact the demand for EV charging infrastructure and to understand the degree of uncertainty associated with the results. This study provides an assessment of charging needs at both national and regional levels that can provide direction to program administrators, policymakers, communities, companies and landowners in continuing and accelerating EV charging deployment. The results should be regularly updated with on-the-ground utilization data, learnings from user experience, and market shifts. It will be up to governments at all levels, along with other public and private sector EV stakeholders, to further build on this work by developing more targeted plans and strategies to guide future investment and deployment decisions.
Table of Contents
- Executive Summary
- Table of Contents
- 1. Introduction
- 2. Light-Duty Vehicle Charging Needs
- 3. Medium- and Heavy-Duty Vehicle (MHDV) Charging Needs
- 4. Regional Findings
- 5. Grid Impacts Assessment
- 6. Conclusion
- Appendix A. Literature Reviewed
- Appendix B. Supplemental Information on LDV Charging Needs
- Appendix C. Supplemental Information on MHDV Charging Needs
- Appendix D. Supplemental Information on Regional Infrastructure Needs
- Appendix E. Supplemental Information on Grid Impacts
Chapter one
1. Introduction
1.1 Background
In support of its legislated goal of net zero emissions by 2050, the Government of Canada has introduced policies and targets to decarbonize the transportation sector, which is responsible for 22% of national greenhouse gas emissions.Footnote 12 Increasing the adoption of zero-emission vehicles (ZEV) is a key component of this goal. The federal government has published regulations (the Electric Vehicle Availability Standard) to require ZEVs to make up a growing share of new light-duty vehicle (LDV) sales, rising from 20% in 2026 to 60% by 2030 and 100% by 2035.Footnote 13 For the medium- and heavy-duty vehicle (MHDV) segment, the federal government has set targets for 35% of total sales to be ZEVs by 2030, reaching 100% by 2040 (where feasible). It is currently developing regulations to establish these targets in law (with interim sales requirements that would vary for different MHDV categories based on feasibility).Footnote 14
Achieving these targets will require coordinated action from all levels of government, as well as the automotive industry, utilities, and other private sector stakeholders. A key component is ensuring sufficient electric vehicle (EV) charging infrastructure to support the anticipated uptake of EVs across the country. Through Natural Resources Canada (NRCan) and the Canada Infrastructure Bank (CIB), the federal government has provided funding to support the installation of thousands of EV charging stations across Canada since 2016.Footnote 15 The federal Emissions Reduction Plan for 2030 sets a target of adding 50,000 new ZEV charging stations to Canada’s network, and commits $400 million of additional funding to support this goal.Footnote 16 This is in addition to the Canada Infrastructure Bank’s $500 million (ZEV) Charging and Hydrogen Refuelling Infrastructure Initiative (CHRI).Footnote 17
It is critical that policymakers and funders have a detailed understanding of how and where EV charging infrastructure needs to be deployed to meet anticipated demand. Accordingly, Natural Resources Canada commissioned Dunsky Energy + Climate Advisors (Dunsky) to develop an EV charging needs assessment for Canada, with support from the International Council on Clean Transportation (ICCT), building on previous studies in 2018 and 2022. This study expands the scope of previous work, which assessed Canada-wide EV charging needs, to include:
- Charging needs for medium- and heavy-duty vehicles (MHDVs).
- Regional differences and needs regarding the amount and type of charging infrastructure required over time.
- Potential electric grid impacts and investments required to accept new charging infrastructure.
The results are intended to support the Government of Canada—as well as provincial and municipal governments, utilities, and other stakeholders—in planning to ensure that sufficient charging infrastructure will be deployed to support Canada’s targets.
1.2 Structure of the report
Section 1 describes the background and general research approach taken for this study, comparing it to Dunsky’s 2022 charging needs assessment.
In Section 2, we focus on light-duty vehicles (LDV) requirements for residential and public/community charging infrastructure. This includes a description of Canadian and provincial EV sales forecasts from now to 2040, our high-level methodology, inputs and assumptions, and combined Canada-wide results showing the number of charging ports by type and location as well as energy requirements, EV/port ratios, and capital costs. We also summarize the results from our sensitivity analysis for LDVs.
In Section 3, we describe the methodology used to determine MHDV charging infrastructure needs to 2040. This includes our estimate and assumptions for MHDV stock growth to 2040, expected energy demand from EV growth, the number of sites and charging ports needed to meet this demand across Canada, and the associated capital costs.
In Section 4, we present our EV charging port count and capital cost results by region, with results for each province and territory as well as the three census metropolitan areas (CMAs) with highest EV uptake.
In Section 5, we assess the impacts of EV adoption and charging needs on Canada’s electricity systems for both LDVs and MHDVs. This section includes regional findings for growth in peak demand to 2040, and an assessment of the upgrades and investments required to prepare for future EV-related electricity demand growth.
Finally in Section 6, we summarize the results and discuss some of the key findings and their implications for Canada and the federal government as it develops policies and programs to support the rollout of EV charging infrastructure across the country.
1.3 Concepts and Definitions
To ensure consistency, the following definitions will be used throughout the report:
- Electric Vehicle (EV): An EV is a vehicle that uses one or more electric motors for propulsion with onboard energy storage that is recharged by plugging it into an external source of electric power. For the purposes of this report, light-duty EVs have a weight rating of 4,535 kg or less. EVs include:
- Battery Electric Vehicle (BEV): A BEV is a type of EV that only uses electric motors and the energy stored in its rechargeable battery packs. It does not use an internal combustion engine (ICE).
- Plug-in Hybrid Electric Vehicle (PHEV): A PHEV is a type of EV that includes both electric motors and an ICE. Its battery can be recharged by plugging it into an external source of electric power.
- Charging Port:Footnote 18 An EV charging port is the outlet used to charge the EV. The port can be located at a charging site and is categorized as a “permanent installation” if hard-wired. Although not always technically correct, the term “charger” is often used to refer to a charging port for simplicity’s sake. Charging ports are also sometimes referred to as Electric Vehicle Supply Equipment (EVSE). Charging ports include:
- Direct Current Fast Charger (DCFC): A type of charging port that allows for faster charging of the EV. With current technology, drivers can typically charge 80% of their battery in 30 minutes.
- Level 2 (L2) Charger: A type of charging port that can provide power at 240 volts and up to 30 amps. Drivers can typically add 15 to 40 km of range in one hour of charging.
- Charging Site: An EV charging site is an infrastructure location where electric energy can be supplied to recharge EVs. A charging site can have multiple charging ports that are permanent installations.Footnote 19
- EV ready: means parking spaces that feature an adjacent energized electrical outlet at which Level 2 charging can be installed in the future. A comprehensive EV-ready retrofit prepares nearly 100% of parking spaces to be EV ready.
- Public charging: charging ports on public or private land that can be used by any EV driver. This type of charging is typically visible through data accessible online.
- Includes charging along highways, in communities, and at certain workplaces offering public charging (to all, not just employees).
- Private charging: charging ports located on private land and providing charging services to a restricted number of EV drivers determined by the charging station operator.
- Includes charging provided to employees (and not the general public) at the workplace, charging at the depot, and charging at home.
- Workplace charging: charging ports used primarily by employees while they are working. Workplace charging may be public (i.e., accessible by anyone regardless of whether they work nearby; public charging in commercial areas operates in this manner) or private (i.e. located on private lands and accessible only by employees). In our modelling, we consider that workplace charging is 50% public and 50% private.
- Shared commercial charging: This type of charging is shared among fleets but is exclusively dedicated to commercial vehicles. It is placed in strategic locations for fleets like taxi stands and downtown delivery zones.
- Multifamily units (MFU): We used the Canadian Census Structural Dwelling Type (Table 98-10-0138-01) to categorize dwellings into single-family units (SFU) or MFU. We consider row houses and apartments of any height to be to MFU based on the following common characteristics: apartments in multifamily building feature shared parking areas, either in parking structures or surface parking. It is more challenging for multifamily building residents to install EV charging in these building types, even when they do have access to a parking spot, due to legal, financial, technical and logistical barriers inherent in both condominiums and rental apartments. The rationale for this approach is to differentiate between building types where charging infrastructure installation will be relatively straightforward, and those where government or other support is likely to be needed due to building type, tenure, or both. This does not necessarily map onto program definitions for multifamily buildings as they exist today.
- Single family units (SFU): We used the Canadian Census Structural Dwelling Type (Table 98-10-0138-01) to categorize dwellings into SFU or MFU. We consider single-detached, semi-detached, and duplexes to be SFU. People living in single family units (single family homes, duplexes, triplexes and row houses) are more likely to have access to, and ownership of, a parking space attached to their living space (e.g. a private garage or parking pad). Installation of EV charging in these settings can be relatively simple, although panel and/or service upgrades or other electrical works are sometimes required and implementing appropriate EV energy management systems in these building types can be complicated.
1.4 Study Background and Approach
The study took two broad approaches to understanding EV charging needs, costs, and grid impacts across Canada: fact-finding and data gathering through a review of existing literature and stakeholder interviews, and modelling and analysis.
1.4.1 Information Gathering
We reviewed academic and grey literature to ensure our methodology was grounded in current best practices and based on the latest data. Appendix A includes a list of sources reviewed and incorporated into our analysis. We also reviewed EV charging commitments made by the automotive industry in Canada to understand how these relate to government targets.
We conducted stakeholder interviews in spring and summer 2023 to incorporate input from a wide range of stakeholders in the LDV, MHDV and utility sectors to better understand Canada’s charging infrastructure needs and approaches to quantifying them. This included 14 utilities across nine provinces, who were able to provide (1) quantitative information related to grid capacity, expected impacts from EV adoption, and likely costs; and (2) their overall perspective of the feasibility of supporting the transition towards EVs. We also conducted interviews with other key stakeholders (Table 1) who were able to provide useful data (e.g., province-specific highway traffic data and/or vehicle registration data, targets and forecasts and utilization rate of the ports).
We identified data availability gaps that could limit our ability to forecast EV adoption, EV charging needs and grid impacts. To mitigate this risk, we leveraged alternate data sources to fill gaps, using professional judgement as needed to adapt data sets. This included such steps as taking province-wide ratios of BEVs and PHEVs to assess PHEV sales by region in cases where PHEV registration data has been lumped in with conventional hybrids. We also used our stakeholder interviews and industry context to fill jurisdiction-specific data gaps based on local knowledge (e.g., necessary geographic coverage and identifying key travel corridors.)
| Stakeholder | Number interviewed | Notes |
|---|---|---|
| Utilities | 14 | Across nine provinces |
| Provincial and Territorial governments | 6 | Additional PTs were engaged informally |
| Industry groups and associations | 11 | Includes associations representing Canadian LDV and MHDV sectors |
| International experts | 4 | Included experts in the US, Germany and China |
1.4.2 Modelling and Analysis
EV charging users include the public (residents, workers, and tourists) and fleet operators. Each of these user groups has different needs related to how, when, and how much they charge; as a result, they each use different combinations of charging locations, as shown in Figure 1.
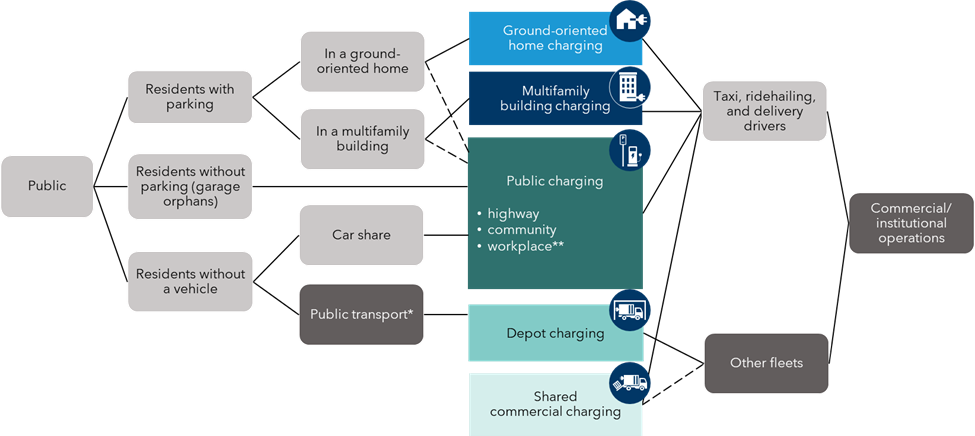
* Public transport fleets occasionally use on-the-go/overhead charging, but this practice is not yet widespread.
** We consider workplace charging to be a form of both public and private charging; some is accessible only to employees (private) while other “workplace” charging is at charging sites that are open to the public. This analysis assumes that 50% of workplace charging is public and 50% is private.
Figure 1. Charging users and the charging categories that meet their needs
This study’s primary focus is on understanding infrastructure needs for public charging and shared commercial charging. However, to understand the amount of public and shared commercial charging required, and to assess the overall grid impacts of EVs, we also had to understand the potential levels of home charging access and deployment in depots. To understand this interdependency, we conducted scenario analysis on levels of home charging access (more details in Section 2).
We performed in-house modeling to establish the EV charging requirements for each region to meet federal ZEV sales targets for LDVs and MHDVs. In addition to the 13 provinces and territories, we conducted more granular analysis at the three largest Census Metropolitan Areas (CMAs) in Canada (Toronto, Montreal and Vancouver). The provincial numbers reported below include the results for the three CMAs.
Given the significant differences in charging use cases and needs between LDVs and MHDVs, we assessed these two sectors separately with tailored approaches. We provide more detail on the specific methodologies used in the LDV and MHDV sections below.
Estimating EV charging needs is an emerging practice. There is consensus in the literature and practice around certain aspects: for example, separately analyzing needs along corridors and in communities. As for more detailed aspects of the methodology (for example, setting the right balance of public DCFC and Level 2 charging infrastructure), there are not yet norms or standards — each region has different needs, urban form, and behaviours. Finding the right balance will involve making careful policy choices rather than finding the one clear path forward. Our aim in this study was to integrate emerging best practices with a tailored approach, based on local contexts and input from key stakeholders.
Our overall results present total charging infrastructure needs by type in each region by scenario, including estimated deployment costs and high-level grid impacts (qualitative issues raised by interviewees and high-level estimates of grid upgrade costs). We also present the results in terms of the effective ratio of EVs per charging port which allows us to compare our results with findings in other studies/jurisdictions.
1.4.2.1 LDV Charging Scenarios
We established two scenarios for the LDV charging needs assessment (Table 2) that are each based on the same EV adoption trajectories provided by Transport Canada (see Section 2.1).
The high scenario, which is considered the base case, assumes ambitious, Canada-wide action to support EV ready housing, wherein:
- A policy change, likely at the federal level, occurs that requires all new housing (including multifamily buildings) to be EV ready starting in 2030. This policy could be enacted through the federal Building Code, Electrical Code, or provincial/municipal codes covering a majority of Canada’s population; our analysis is non-prescriptive about the specific policy mechanism(s). Quebec has announced its intent to adopt such a policy at the provincial level, while several municipalities in BC and Ontario have these rules in place.
- Widespread investment in retrofits that provides charging in 30% of parking spaces in the existing residential stock by 2030 and 60% by 2035.
The low home charging access scenario assumes that current and announced policy measures remain in place, but that no additional policy measures are adopted to spur retrofits and new construction of EV ready housing. This scenario therefore results in higher public charging needs.Footnote 20
| Policy area | Criteria | Low Home Charging Scenario | High Home Charging Access (Base Case) |
|---|---|---|---|
| New construction | % new single-family units with EV ready parking | Quebec: 100% (regulations in place) | Quebec: 100% (regulations in place) |
| Everywhere else: 95% | Everywhere else: 95% | ||
| % new multi-family units with comprehensive EV ready parking | Vancouver CMA: 80%. Rest of BC: 40% | Federal policy change effective 2030 and applies to 100% of new units | |
| Toronto CMA: 50% | |||
| Quebec (incl. Montreal CMA): 100% starting in 2024 | |||
| Everywhere else: 0% | |||
| Retrofits of existing multifamily buildings | % of 2021 stock that undergoes comprehensive EV ready retrofits | BC, Vancouver CMA: 10% by 2030, no change after 2030 | Everywhere: 30% by 2030, 60% by 2035 |
| Everywhere else: 0% |
1.4.2.2 MHDV Charging Scenarios
We consider three scenarios for the MHDV charging needs assessment. All three scenarios meet the target of 100% ZEV sales by 2040, but the alternate scenarios show different trajectories to get there, as shown in Table 3. The pace at which the zero-emission MHDV market develop will significantly impact the needs for supporting infrastructure in the short term. We further assume that all MHDVs will be battery-electric vehicles (BEVs), due to a higher degree of technology maturity and a better economic performance in all MHDV segments.Footnote 21 We also perform a sensitivity analysis to assess the extent to which charging needs for BEVs would be reduced if hydrogen-powered vehicles were to see a significant market uptake as a result of lower hydrogen prices.
| Year that ZEVs make up 35% of all MHDV sales | Year that ZEVs make up 100% of all MHDV sales | |
|---|---|---|
| Base Case | 2030 | 2040 |
| Early Case | 2028 | 2040 |
| Late Case | 2032 | 2040 |
1.4.2.3 Updates to previous Dunsky Charging Infrastructure Needs Projections
In our previous study, conducted in 2021, we estimated the Canada-wide EV charging needs (on corridors and in communities) for light-duty vehicles to 2050, based on optimal ratios of EVs to chargers for both L2 and DCFC charging infrastructure.Footnote 22 This study presented two scenarios: high and low home charging access for EV owners in multifamily buildings. We present the results from the 2021 study in Section 2.4.1, in a comparison with the updated results from this study.
For this 2024 study we updated both the scope and methodology to provide a more granular understanding of Canada’s EV charging infrastructure needs, and to reflect evolving best practices and information when it comes to forecasting future infrastructure needs.
The main scope updates for the current study are:
- Added assessment of MHDV charging needs.
- Provided province/region-specific estimates of infrastructure needs and impacts.
- Assessed grid readiness and costs associated EV charging infrastructure.
- Adjusted the study horizon to 2040 (as opposed to 2050 in the 2021 study).
We also made several updates to our previous methodology and assumptions for LDV charging needs. Most notably, we based our infrastructure needs forecast on an estimate of regional energy demand (in kWh) for different vehicle and charger types and expected charger utilization, instead of the previous approach that used an assumption of optimal EV-to-charger ratios to estimate the numbers of chargers for a given vehicle stock. This bottom-up approach helped us develop a more accurate understanding of how EV charging needs vary by province and region, and provided the input data needed for the grid impacts assessment.
We also extended our analysis to include additional charging use cases, such as shared commercial vehicles (taxis, ride-hailing fleets), depot charging, tourism needs, and additional coverage of rural and remote communities. Other modeling changes include an updated Transport Canada LDV EV sales forecast resulting in more EVs on the roads in 2040; a higher ratio of BEVs to PHEVs; and updated assumptions on effective charging power, utilization rate, and infrastructure costs. See the following sections for a more detailed description of our methodology. A more detailed comparison of the assumptions for the two studies can be found in Appendix B.
Chapter two
2. Light-Duty Vehicle Charging Needs
Light-duty vehicles (LDV) are responsible for approximately 50% of Canada’s transportation sector GHG emissions, and 12% of national emissions across all sectors. Transport Canada defines LDVs as cars, sports utility vehicles, or light trucks with a Gross Vehicle Weight Rating of 4,535 kg or below.
2.1 EV Adoption Forecast
The first step in our analysis was to establish forecasts of EV sales for Canada and for each province or territory. We based our forecast on Canada’s announced ZEV sales targets and the December 2023 ZEV Availability Standard, which would require a ZEV sales share of at least 60% of new vehicles by 2030 and 100% by 2035 nationwide. We began with Transport Canada’s internal forecast, which is updated annually and distributes EV sales across provinces and territories based on historical adoption trends and is aligned with the Availability Standard.
We also accounted for provincial requirements by updating Transport Canada’s forecast to align with recently updated provincial ZEV mandates in British Columbia and Quebec (Table 4). For all other provinces, we used the Transport Canada forecast. This resulted in a slightly higher total ZEV stock than would be required to meet Canada’s federal targets.
| 2026 | 2030 | 2035 | |
|---|---|---|---|
| Canada | 20% | 60% | 100% |
| BC | 26% | 90% | 100% |
| Quebec | - | 2 million EVs in circulation | 100% |
Figure 2 shows the forecast of EVs as a share of total LDV stock by province and territory between 2022 and 2040.
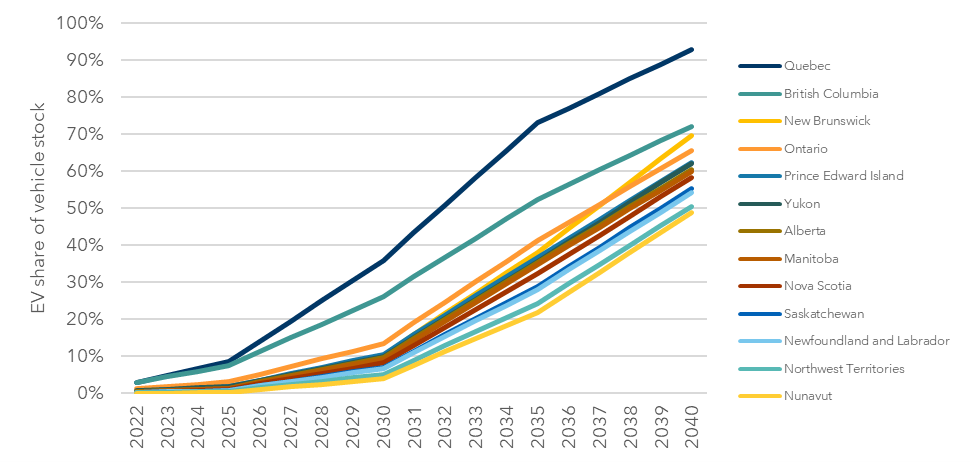
Figure 2. Electric vehicles as a share of the total light duty vehicle stock by province and territory, 2022-2040
2.2 Residential Charging
Key inputs and assumptions to residential charging demand forecasts
- Population forecasts: We used Statistics Canada forecasts for Canada, Provinces and Territories.Footnote 23
- Census Metropolitan Area (CMA): Private parking access varies between 50% (duplex) and 85% (single or semi-detached, apartment).
- Non-CMA: Private parking access assumed to vary between 75% (duplex) and 95% (single or semi-detached house, apartments).
- Charger types: We assume 10% of light-duty BEVs and 25% of PHEVs use L1 at home; the remainder use L2.
- Charging access in existing multifamily buildings is assumed to be 1%.
- In 2023, less than 1% of EV owners live in multifamily buildings. Single family unit owners are more likely to purchase an EV until 2040, by which point all residents are equally likely to own an EV regardless of housing type.
- Sensitivity analysis: We compared residential charging under “High” and “Low” home charging access scenarios.
Although our primary objective was to forecast public and shared commercial private charging needs, we needed to first understand the presence of residential charging to understand the magnitude of public charging required.
Charging at home (whether in single family homes or in multifamily buildings) plays the largest role in the charging ecosystem in terms of the number of ports and the overall amount of energy dispensed at those locations, and this is expected to continue in the future. Indeed, a customer survey by Hydro Quebec showed that residents with access to home charging do 90% of their charging at home in that province.Footnote 24 Similarly, a survey of EV owners in the U.S. found that 90% charge at home daily or weekly.Footnote 25
Additional housing stock classifications and assumptions are presented in Appendix B.
2.2.1 Multifamily Buildings
Multifamily building residents often face higher barriers to EV charging than residents in ground-oriented dwellings (although these residents can also face barriers, e.g., access to on-street parking only). While one-third of Canadians live in multifamily buildings, only 12% of EV owners do, according to a 2022 survey.Footnote 26 This disparity is even greater in cities like Metro Vancouver where, as of 2021, 43% of residents live in apartments; this share is expected to rise.Footnote 27 Retrofits in multifamily buildings allow people living in apartments or condos to have access to residential charging.Footnote 28 Without such access, owners of EVs in multifamily buildings must rely on public or workplace charging.
Furthermore, not all multifamily housing offers parking; indeed, while most post-war developments until recently do include at least one parking space per unit, municipalities are increasingly reducing or eliminate parking minimums in new developments to help encourage more sustainable travel modes. Multifamily housing without parking can never be made EV ready. Our model includes estimates of the share of existing and future housing units that will offer no parking. Appendix B provides our parking and charging access assumptions.
While there is no data on EV ready parking spaces that are currently EV ready, we estimate that there are under 50,000 EV ready multifamily parking spaces today in Canada. Our base scenario (high home charging access) sets a course where: (1) all new residential buildings are required to be EV ready starting in 2030 and, (2) comprehensive EV ready retrofits are conducted on 30% and 60% of the 2021 residential building stock by 2030 and 2035, respectively. Our analysis found that under this scenario, an average of 87 to 88% of all households live in EV ready units (meaning they have the ability to install a charger without further upgrades) across the time period from 2025 to 2040—effectively, the policy package to improve home charging access keeps pace with a shift towards greater EV adoption among residents of multifamily buildings. Under this scenario, 2.1 million multifamily units will have EV ready parking by 2030, 4.3 million by 2035 and 4.7 million by 2040 (Table 5).
Under our alternate low home charging access scenario, we find that the share of EV owners living in EV ready units falls from 88% in 2025 to 82% in 2040, with variation between provinces depending on housing type and mix. In other words, policies do not keep pace with EV adoption, and an increasing number of EV users rely exclusively on public charging over time. The number of EV ready retrofits in multifamily buildings, which is driven only by programs that exist or have been announced today, reaches approximately 81,000 in 2030, with no further growth in retrofits after 2030. The pre-2030 trend is driven by BC, where there is a growing movement towards EV ready building policies and a greater push towards retrofitting multifamily buildings.
| MFU parking spaces that are EV ready | Scenario | 2030 | 2035 | 2040 |
|---|---|---|---|---|
| From retrofits | High (base) | 1.6 million | 3.2 million | 3.2 million |
| Low | 81,000 | 81,000 | 81,000 | |
| From new construction | High (base) | 590,000 | 1.0 million | 1.5 million |
| Low | 390,000 | 560,000 | 700,000 | |
| Total | High (base) | 2.1 million | 4.3 million | 4.7 million |
| Low | 480,000 | 640,000 | 790,000 | |
| % of all MFU that is EV ready | High (base) | 29% | 52% | 54% |
| Low | 7% | 10% | 12% | |
| % of all housing (SFU and MFU) that is EV ready | High (base) | 87% | 88% | 87% |
| Low | 85% | 82% | 79% |
2.3 Public Charging
Our analysis split public EV charging into three categories (Figure 3):
- Community charging: Level 2 and DCFC stations in communities of various sizes, including workplaces, public parking lots, and curbside charging.
- Corridor charging: DCFC stations along major highway and road corridors, as well as in remote and rural communities to maximize geographical coverage.
- Shared commercial charging: ultra-fast charging stations accessible only to commercial fleets (e.g., taxis and ride hailing), either on public or private lands.
The textbox presents the main inputs and assumptions for public charging. For more details, see Appendix B.
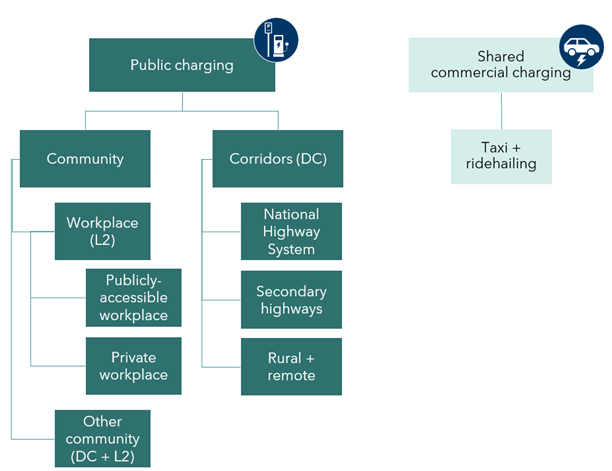
Figure 3. Public LDV charging includes community, corridors, and shared commercial charging infrastructure.
Key inputs and assumptions to public and shared commercial charging demand forecasts
- NRCan’s Electric Charging and Alternative Fuelling Stations Locator was used to develop a baseline estimate of public charging.
- People with home charging access use public charging 15% of the time, while people without home charging use it 100% of the time.
- 50% of workplace charging is public charging (i.e. at charging sites that anyone can access), while 50% of workplace charging access is restricted and is private charging (i.e. accessible only to employees at that location). We followed the approach of NREL in setting this assumption.Footnote 29
- Vehicles travelling on highway trips longer than 160 km use corridor charging.
- The number and type of public charging ports is based on the average energy use of BEVs and PHEVs, which is a function of average vehicle efficiency (data from NREL and ICCT), average annual driving distances (provincial/territorial data), charging preferences (share of charging at home, at work, public) and port utilization rates (based on utilization data in advanced EV markets).
- We use the average effective charging power of port types, which is a more realistic number than the nameplate charging power. However, both are correlated. Port charging power increases over time in line with technology forecasts. See Appendix B for details.
- We use an average charging port utilization rate based on a review of actual utilization data from charging network operators and professional judgement. See Appendix B for details.
- We assume a 97-98% reliability factor over the study period, meaning that public charging ports are in operation for 97-98% of the timeFootnote 30. This means that the network will be “overdesigned” by 2-3% relative to demand (i.e., more ports than would otherwise be needed if the network was 100% reliable). This assumption is based on the 97% reliability requirement embedded in the US National Electric Vehicle Infrastructure (NEVI) program; most charging networks in Canada today have not reached this level of reliability but we expect improvements over time. In Section 2.6 we explore the impact on results if reliability is lower. See details in Appendix B.
- We calculated the average annual historical (2013-2022) temperature data (provincial/territorial) using Weather Canada’s average monthly temperatures. We used this to estimate total daily EV energy needs, using the relationship between EV electricity consumption and ambient temperature (e.g., EVs consume 16% more energy at 0°C than at 8°C).
- For our corridor assessment along the National Highway System (NHS) and other secondary highways, we assumed that 100% of charging would be provided by DCFC (due to their faster charge times versus L2), and there would be a charging station at least every 65 km. We assumed that only trips over 160 km would require charging.
- To expand the geographical coverage of our corridor assessment, we also assessed the DCFC needs in rural and remote communities that were located outside of our geographical buffers. More details can be found in Section 2.3.2.
2.3.1 Community Charging Needs
Community charging infrastructure is needed to support EV charging for day-to-day needs, and for people without access to private charging, in cities, towns and other population centres. Community charging includes workplaces, curbside, and publicly accessible parking lots. Access to these types of charging is crucial to enabling EV adoption, especially for people without access to home charging. Diversified charging infrastructure, incorporating both fast- and slower-charging infrastructure, will allow EV owners to select the optimal charging methods for their individual needs. Community charging consists of public DCFC (i.e., fast charging) and Level 2 ports (which are located at workplaces, on-street and off-street parking).
Our general methodology for estimating community public charging needs is as follows (Figure 4):
- We estimated average daily driving distances (vehicle-kilometres travelled, or VKT) as a product of annual average driving distances in each province and the share of days a vehicle is driven (80%).Footnote 31
- We then developed an average daily energy use (in kWh) based on average VKT and vehicle efficiency (which varies by vehicle type).
- We estimated the average daily energy use (kWh) by vehicle and charging type, using behavioural insights on charging preferences (from NREL).
- Finally, we developed or estimate of total daily regional energy needs (by vehicle and charging type), as a factor of daily energy use, EV uptake forecasts (by region and vehicle type), and the share of EV owners with/without home charging access (by region). We used a temperature adjustment to factor in regional climatic variations and how that might impact vehicle and charging use/efficiencies.
- The final step was to estimate the total number of ports required by charging type (L2 and DCFC). This is based on the total daily regional energy needs, adjusted for several key factors: effective charging power for each vehicle and charging type; port utilization rate; reliability factor; and the number of hours in a day.
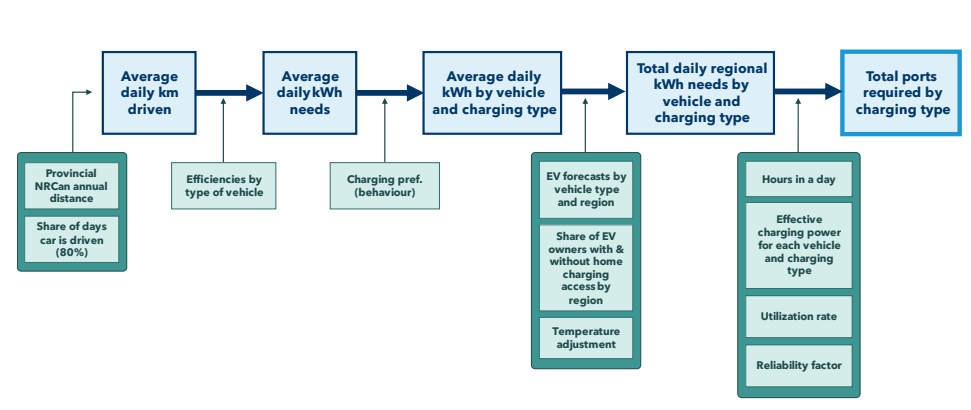
Figure 4. Methodology to estimate total daily energy demand from light-duty vehicles (LDVs)
2.3.2 Corridor Charging Needs
A key component of the LDV analysis was understanding needs for fast charging infrastructure along transportation corridors. The National Highway System (NHS) includes 38,000 km of highways across Canada, with additional provincial and secondary highways adding to this total. Highway corridor charging is assumed to exclusively use DCFC due to their faster charging times relative to L2 chargers. As a result, energy needs are higher for corridor stations. We separated highway corridor charging from community DCFC charging for this analysis as highway systems often cut across provinces or regions, and as such their expansion benefits from a coordinated planning approach by federal and/or provincial governments.
To understand corridor charging needs we took the following steps:
- Identified the highways to be included as charging corridors. To ensure the proposed coverage met the needs of travellers within each province, we used the National Highway System (NHS) as a starting point (all core, feeder, and northern/remote routes), and supplemented this with secondary and provincially significant highways not covered by the NHS, based on input received from provincial and rural community stakeholders.Footnote 32,Footnote 33 A list of all the secondary highways and their length, by region, considered in this analysis can be found in Appendix B.
- Calculated the number of stations required, assuming that there would be one DCFC station every 65 km on all highway types (in accordance with best practices in CanadaFootnote 34). Also, a minimum of 2 ports per station was assumed for the NHS network and a minimum of 1 port per station for the secondary highways until 2035, after which it also increased to 2 ports per station. This allows the infrastructure to be build out gradually on the secondary highways.
- Assessed BEV travel volumes over time based on average annual daily traffic (AADT), adjusted to represent peak volumes, which is the more important parameter when estimating EV charging needs.Footnote 35 If the regional AADT data was unavailable, the vehicle-kilometres-travelled (VKT) data was utilized to estimate peak traffic volumes along the NHS corridors.Footnote 36 We estimated future peak BEV volumes based on our adjusted TC forecasts for EV penetration by region. (Note that the analysis only includes BEVs as PHEVs do not use fast charging).
- Assessed climatic or geographic impacts (i.e., cold weather, significant elevation change) on energy demands.
- Assessed charging needs as a function of travel volume and the share of trips requiring a charge (e.g., we excluded trips that are short enough to accomplish with one full charge, which we consider to be less than 160 km).
- Calculated charging time as a function of average charging power levels (kW) and battery capacity (kWh).
Figure 5 outlines the approach we used to estimate the number of DCFC ports required across the main highway corridors in each region.
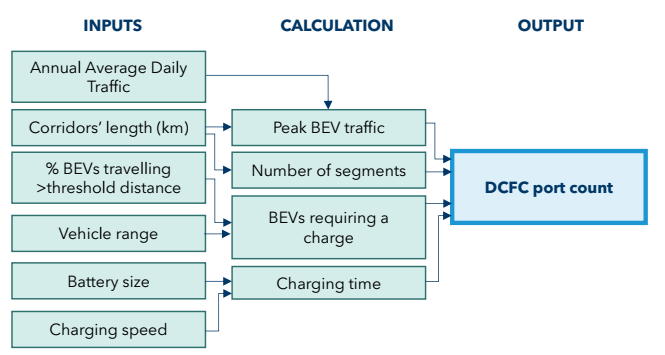
Figure 5. Methodology for Estimating DCFC Port Count Along NHS Corridors
Rural and Remote Communities
We performed additional analysis to ensure that rural and remote communities, particularly in Canada’s north, received adequate geographical coverage creating an effective DCFC network. First, we identified all population clusters greater than 1,000 residents that are further than 32.5 km from the National Highway System. Footnote 37 We then allocated two DCFC ports for each of these communities. The map below (Figure 6) shows the distribution of these rural and remote communities.
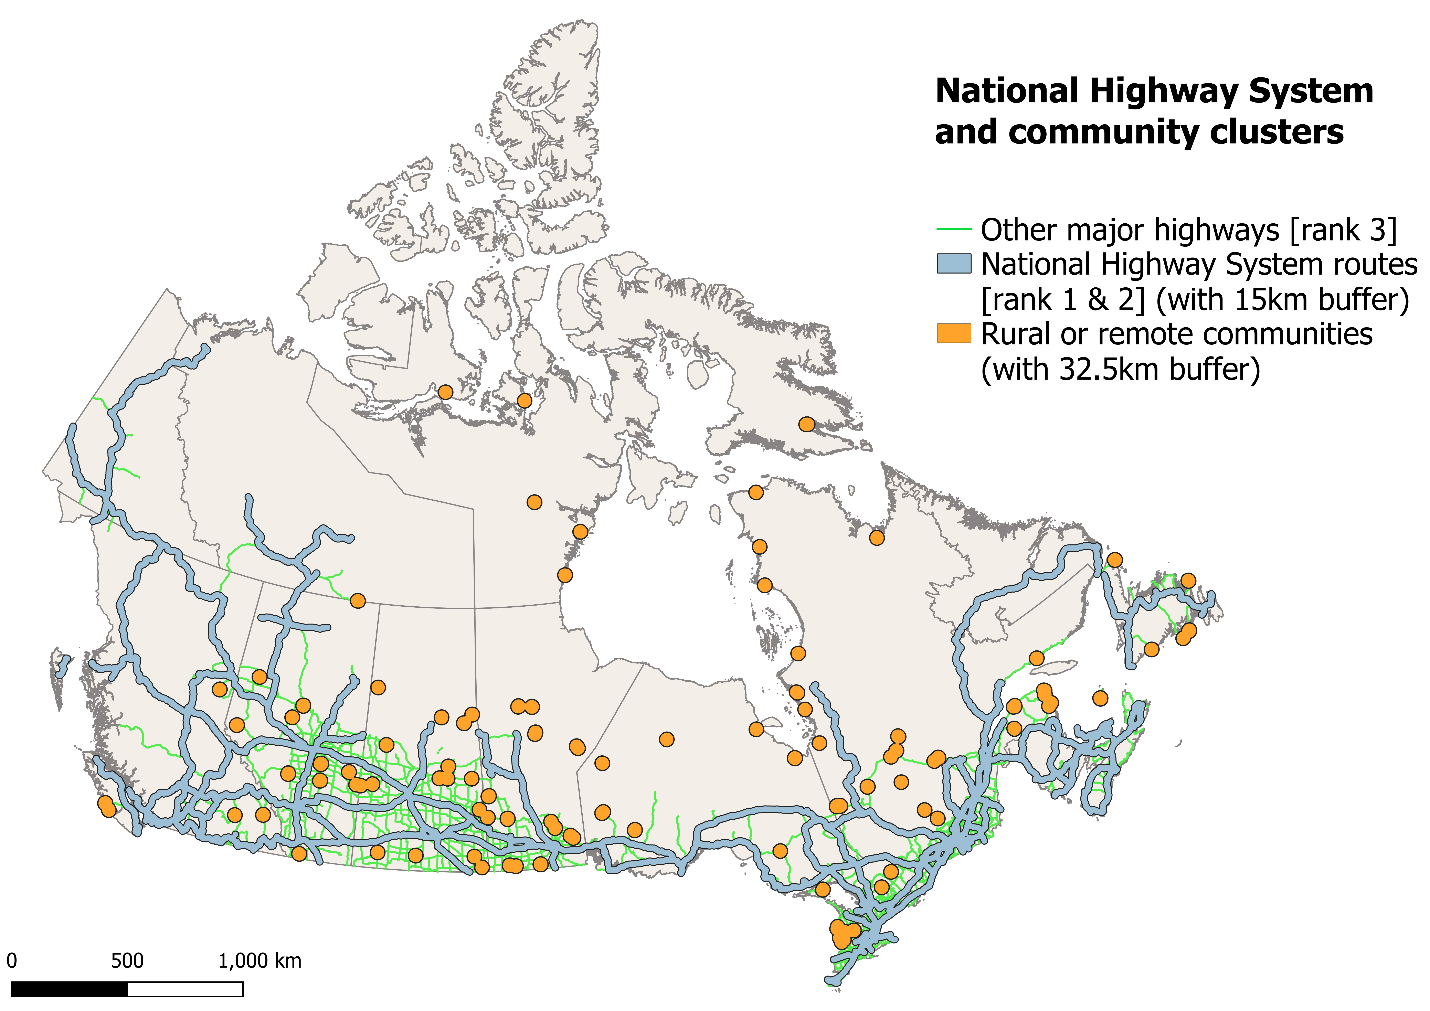
Figure 6. Map of Canada showing rural and remote community clusters with fast charging needs
2.3.3 Tourism Charging Needs
In addition to our analyses above we developed a model to account for the specific needs of some communities that receive very high peak traffic from tourism. The impact of tourism on highway corridors was already accounted for in the hourly peak AADT values analyzed for each province, as it quantifies the tourism on road as well. However, additional analysis was required to account for tourism impact on DCFC and L2 community charging, especially in certain regions with higher levels of tourism. Based on the visitor volume data available by each provincial and territorial government, the daily average number of tourist vehicles in 2019 was calculated, with an assumption of 2.5 tourists per vehicle and similar ratio of EV-to-LDV as the provincial numbers. This was supplemented to the previously calculated EV fleet size to factor the impact of tourism on community charging needs.
2.3.4 Shared Commercial Vehicles: Taxis and Ride-Sharing Services
The business case for building charging infrastructure can be particularly challenging if overall utilization of the infrastructure is low — a challenge many site hosts face in the near term as EVs still represent a relatively small portion of the overall vehicle stock, and potentially even into the longer term depending on improvements to charging access at home. This challenge is exacerbated by the fact that most personal EV owners do most of their charging at home.
Charging infrastructure specifically targeting shared fleets can result in much higher utilization rates due to (1) their higher annual mileage than personal vehicles and (2) their higher dependence on DCFC infrastructure. Because of their long daily commutes, taxis and commercial ride-sharing services (such as Uber) also present an excellent opportunity for electrification and being early adopters.
Most shared fleet segments prefer DCFCs over L2 charging. Electric taxis, ride-hailing, and vanpool vehicles are looking for a fast way to top up and one-way car share vehicles would ideally have staff charge them up quickly before bringing them back to an ideal location. This need for fast top-ups supports the rationale of providing dedicated ports for shared fleets. It is important to design charging infrastructure for this type of EV owner because they need very fast charging (DCFC of at least 250 kW) strategically located along the route, and because drivers don’t always have access to residential charging.
To estimate fast-charging infrastructure needs for taxis and ride-sharing services, we took the following steps:
- Quantified the number of vehicles using publicly available fleet estimates from key markets, including the City of Toronto and the province of Quebec. These were then scaled across provinces relative to labour force numbers from Statistics Canada on the share of people employed as taxi or limousine drivers. Our assumptions for taxi and ride-hailing fleet size are presented in Table 35, Appendix B.
- Forecasted the fleet growth to 2040 using a fleet compound annual growth rate of 1% to the 2023 baseline.
- We followed the same approach to estimate vehicle energy needs as the community charging analysis (Figure 4).
- We assumed that 100% of taxis and on average 20% of ride-sharing drivers are driving full time.Footnote 38 Across all drivers, we use an implicit assumption of an average of 81.5% of home charging access for taxis and ride-sharing drivers.
Our results for shared commercial charging needs are presented as part of our public and home charging results. In our results, we outline specific number of ports estimated for taxis and ride-sharing services.
2.4 Combined Results
Figure 7 shows the growth in public charging ports (DCFC and L2) relative to EV adoption to 2040 under our base scenario (high home charging), showing that the need for public ports grows in step with EV adoption, but that the ratio of public ports to EVs becomes more efficient over time. Table 6 shows the combined results for Canada-wide LDV charging infrastructure needs between 2025 and 2040. Assuming a federal ZEV sales regulation is implemented as planned, Canada would need approximately 447,000 public ports by 2035, rising to 679,000 by 2040. Of this total, around 9 in 10 are expected to be Level 2 chargers in communities and publicly accessible workplace parking areas. The remainder are DCFC installed in communities, along highway corridors, and for use by taxis and other shared commercial vehicles.
The number of private ports (in homes and workplaces) is significantly larger than the number of public ports, reaching 11.9 million in 2035 and 18.5 million in 2040, due to the reliance on home charging (and to a lesser extent, private workplace charging) among Canadian vehicle owners. The share of EV ready multifamily buildings will need to increase substantially to meet these numbers, as discussed in Section 2.2.1.
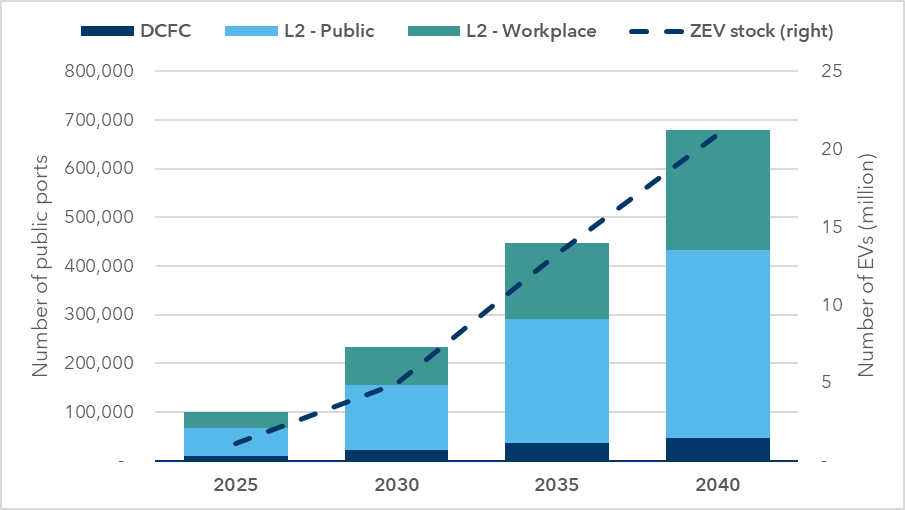
Figure 7. Public charging needs (L2 and DCFC) and EV growth to 2040 under base case (high home charging)
| Scenario | Type of port | 2025 | 2030 | 2035 | 2040 |
|---|---|---|---|---|---|
| High access to home charging (base case) | DCFC - community | 6,200 | 18,900 | 31,400 | 41,700 |
| DCFC - corridor + rural | 1,600 | 1,900 | 3,100 | 3,900 | |
| DCFC - taxis + rideshare | 1,200 | 1,200 | 1,800 | 1,800 | |
| Total - DCFC | 9,000 | 22,000 | 36,300 | 47,400 | |
| L2 - community | 58,200 | 132,900 | 255,000 | 385,300 | |
| L2 - workplace | 33,300 | 79,600 | 155,500 | 245,900 | |
| Total - L2 | 91,500 | 212,500 | 410,500 | 631,200 | |
| Total – Public ports | 100,500 | 234,500 | 446,800 | 678,600 | |
| L1 - home | 141,100 | 588,500 | 1,470,900 | 2,207,300 | |
| L2 - home | 828,100 | 3,718,600 | 10,250,500 | 16,065,900 | |
| L2 - work | 33,300 | 79,600 | 155,500 | 245,900 | |
| Total Private | 1,002,500 | 4,386,700 | 11,876,900 | 18,519,100 | |
| Low access to home charging | DCFC - community | 6,300 | 20,200 | 37,800 | 52,800 |
| DCFC - corridor + rural | 1,600 | 1,900 | 3,100 | 3,900 | |
| DCFC - taxis + rideshare | 1,200 | 1,200 | 1,800 | 1,800 | |
| Total - DCFC | 9,100 | 23,300 | 42,700 | 58,500 | |
| L2 - community | 58,400 | 135,500 | 270,900 | 418,700 | |
| L2 - workplace | 33,500 | 84,500 | 188,300 | 318,300 | |
| Total - L2 | 91,900 | 220,000 | 459,200 | 737,000 | |
| Total – Public ports | 101,000 | 243,300 | 501,900 | 795,500 | |
| L1 - home | 140,600 | 571,800 | 1,358,200 | 1,983,200 | |
| L2 - home | 825,300 | 3,614,400 | 9,458,300 | 14,404,400 | |
| L2 - work | 33,500 | 84,500 | 188,300 | 318,300 | |
| Total Private | 999,400 | 4,270,700 | 11,004,800 | 16,705,900 |
Figure 8 and Figure 9 compare public charging needs for DCFC and L2 ports, respectively, between the high and low home charging scenarios. These show that lower home charging access leads to higher demand for public charging due to a greater need for public charging access by those without parking and/or charging at home. As a result, the low home charging access scenario results in a need for an additional 8,800 public ports in 2030, 55,100 in 2035, and 116,900 in 2040.
Table 7 shows the EV-to-port ratios associated with these outputs. By 2030, if Canada acts to ensure home charging access for multifamily building residents (see Section 2.2.1), Canada should target having roughly one public port (L2 and DCFC) for every 21 EVs on the road. The ratios broken down by type of charging range from 170 BEV/DCFC ports to 17 EV/public and private workplace L2, reflecting the differences in charging power and expected utilization between these different port types. Our forecast shows that, over time, the ratio of EVs to ports grows as the network is built out, EV ownership increases, and charging power and charger utilization increase over time. The total number of EVs/ports including all private charging remains fairly constant over the study period at slightly less than one-to-one.
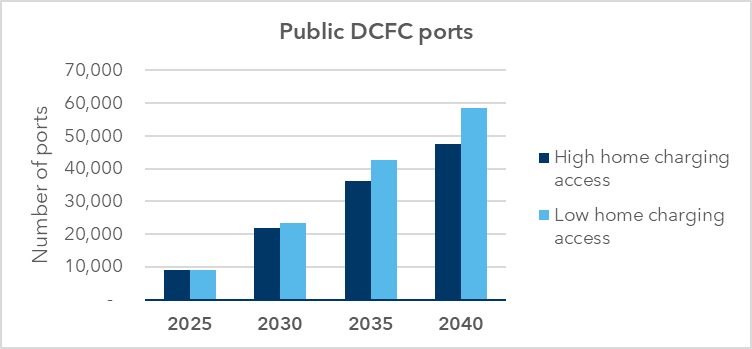
Figure 8. Assessed needs for public DCFC ports under both home charging access scenarios (2025-2040)
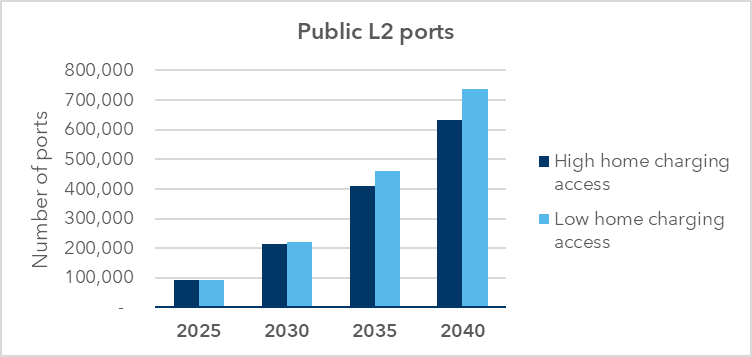
Figure 9. Assessed needs for public L2 ports under both home charging access scenarios (2025-2040)
| Scenario | EV-to-Port-Ratios | 2025 | 2030 | 2035 | 2040 |
|---|---|---|---|---|---|
| High home charging access (base case) | BEV / DCFC ports | 85 | 170 | 303 | 379 |
| EV / L2 port (community + public and private workplace) | 9 | 17 | 24 | 24 | |
| EV / public L2 ports (community + public workplace) | 12 | 23 | 32 | 33 | |
| EV / public ports | 11 | 21 | 30 | 31 | |
| EV / total ports (including residential) | 1.0 | 1.1 | 1.1 | 1.1 | |
| Low home charging access | BEV / DCFC ports | 84 | 161 | 257 | 307 |
| EV / L2 port (community + public and private workplace) | 9 | 16 | 21 | 20 | |
| EV / public L2 ports (community + public workplace) | 12 | 23 | 29 | 28 | |
| EV / public ports | 11 | 20 | 27 | 26 | |
| EV / total ports (including residential) | 1.0 | 1.1 | 1.2 | 1.2 |
2.4.1 Comparison with Dunsky’s 2021 Assessment
Table 8 shows the key results of Dunsky’s previous assessment, conducted in 2021, compared with the updated results from this 2024 study (using the high home charging access scenario in both cases).Footnote 39 Due to updates in methodology and scope, the updated study forecasts a need for a higher number of public charging ports in the near term (2025 to 2030 period), resulting in a lower ratio of EVs to public ports for these years (i.e., more public ports needed for every EV on the road). The port counts and ratios converge between the studies in 2035 and 2040 as the network is built out.
Notably, our updated assessment calls for nearly twice the number of public DCFC and L2 ports in 2025 than previously. This difference in the near term is due to a more granular scope of analysis (we set a higher bar for geographical coverage, conducted a detailed assessment of provincial requirements, and ensured broader coverage along highway corridors and in remote/northern communities), integrating shared commercial vehicle charging needs, and more conservative assumptions around charger utilization and power levels.
| Study | Type of port | 2025 | 2030 | 2035 | 2040 |
|---|---|---|---|---|---|
| Current (2024 study) – Base scenario (High home charging access) | Public ports | 100,520 | 234,440 | 446,760 | 678,610 |
| L2 | 91,520 | 212,510 | 410,480 | 631,200 | |
| DCFC | 8,998 | 21,931 | 36,282 | 47,414 | |
| EV/Public Port ratio | 11 | 21 | 30 | 31 | |
| EV/L2 ratio | 9 | 17 | 24 | 24 | |
| BEV/DCFC ratio | 85 | 170 | 303 | 379 | |
| Previous (2021 study) – High home charging access scenario | Public ports | 52,000 | 195,000 | 442,000 | 643,000 |
| L2 | 48,000 | 181,000 | 410,000 | 593,000 | |
| DCFC | 4,300 | 13,800 | 32,000 | 50,200 | |
| EV/Public Port ratio | 20 | 24 | 28 | 32 | |
| EV/L2 ratio | 21 | 26 | 30 | 35 | |
| BEV/DCFC ratio | 180 | 250 | 300 | 330 | |
| Difference | Public ports | 48,520 (+93%) | 39,440 (+20%) | 4,760 (+1%) | 35,610 (+6%) |
| L2 | 43,520 | 31,510 | 480 | 38,200 | |
| DCFC | 4,698 | 8,131 | 4,282 | -2,786 | |
| EV/Public Port ratio | -9 (-45%) | -3 (-13%) | +2 (+7%) | -1 (-3%) | |
| EV/L2 ratio | -12 | -9 | -6 | -1 | |
| BEV/DCFC ratio | -95 | -80 | +3 | +49 |
Note: We present results from 2025 to 2040 to align with our current study period, although the 2021 study modelled EV charging needs to 2050.
2.4.2 Comparison with Other Studies and Jurisdictions
Table 9 compares our 2030 results to outputs from studies by two leading U.S. agencies: the National Renewable Energy Laboratory (NREL) and the California Energy Commission (CEC). Controlling for differences in assumptions (for example, the California study considers a scenario with much lower home charging access), the BEV-to-DCFC and EV-to-L2 port ratios are comparable with this study’s findings.
| Study | Juris-diction | Projection year | Market share (BEV/ PHEV) | Average charge power (kW) | Home charging access among EV owners | BEV/ DCFC | EV/ all public + workpl. L2 |
|---|---|---|---|---|---|---|---|
| Dunsky, 2023 (high home charging) | Canada | 2030 | 75/25 | 233 | 87% | 170 | 17 |
| NREL, 2023Footnote 40 | U.S. | 2030 | 90/10 | 150-350 | 90% | 1631 | 21 |
| CEC, 2023Footnote 41 | California | 2030 | 88/12 | 2902 | 66% | 160 | 10 |
Policymakers in the European Union have begun to use installed kilowatt-to-EV ratios rather than EV-to-port ratios to set policy and track progress. This approach has the benefit of controlling for differences in average port charging power that are often obfuscated by direct comparisons of EV-to-port ratios. Table 10 shows the required energy output for public EV charging infrastructure installed per all EVs on the road, according to this study. By 2030, our results show a need for 1.2 kW to 1.3 kW per EV.
| Scenario | 2025 | 2030 | 2035 | 2040 |
|---|---|---|---|---|
| High home charging (base case) | 1.7 | 1.2 | 1.0 | 1.0 |
| Low home charging | 1.7 | 1.3 | 1.2 | 1.3 |
| ZEV stock shares in % of all LDVs | 4.3% | 18% | 45% | 66% |
The European Union Alternative Fueling Infrastructure Regulation (EU AFIR) requires member states to ensure, at the end of each year, a public charging infrastructure total power output of at least 1.3 kW for each BEV and 0.8 kW for each PHEV registered in its territory.Footnote 42 The Regulation stipulates that states can target a lower power output once the share of ZEV in the territory reaches at least 15% of LDV stock, and does not prescribe this ratio, recognizing that charging provisions can become more efficient as the concentration of EVs increases.
We cannot directly compare the ratios in Table 10 with the AFIR requirements because the ratios in Table 10 are for all EVs, while the AFIR provides requirements on the basis of BEV and PHEV separately. To directly compare, we made the following calculation in Table 11:
Total kW required (AFIR) = 1.3 * nBEV+ 0.8 * nPHEV
This analysis shows that if public charging in Canada were built to meet this study’s high home charging access scenario (a lower public charging requirement than in the low home charging access scenario), the EU’s AFIR requirement would be exceeded, even in the years after the ZEV stock share is greater than 15%.
| Installed energy output (GW) | 2025 | 2030 | 2035 | 2040 |
|---|---|---|---|---|
| Total required in EU (AFIR) | 1.3 | 5.8 | 16.1 | 25.8 |
| Dunsky, 2023 total needs assessedFootnote 43 | 1.9 (>AFIR) | 6.2 (>AFIR) | 16.1 (=AFIR) | 26.2 (>AFIR) |
| ZEV stock as % of all LDVs | 4.3% | 18% | 45% | 66% |
2.5 LDV Charging Infrastructure Costs
2.5.1 Methodology
We developed per-port cost estimates using 2022 dollars and based on in-house total installation and equipment costs assessment. Our results include estimated costs for utility upgrades, installation and equipment, and include discussion on the level of uncertainty and variation associated with each. These cost estimates were informed by discussions with utilities, municipalities and governments to understand the total costs of installation plus charging equipment.
Importantly, the cost per port for the same type of infrastructure varies widely across projects, depending especially on:
- Charging power (Level 2 vs DCFC infrastructure, DCFC from 25 kW to 350 kW and beyond).
- The number of ports deployed per site (there are economies of scale with a greater number of ports per site, though larger sites might exceed available electrical capacity triggering more costly upgrades).
- The location (e.g., curbside charging is more expensive than in off-street locations).
- The quality of the design. The use of load management techniques including EV energy management systems, can significantly reduce per-port costs.
A number of studies have attempted to quantify per-port equipment and installation costs. One such study is a study that Dunsky conducted for NRCan in 2021, with the goal of advising NRCan as it contemplated shifting focus towards higher power levels for DCFC infrastructure. The figures below compare our own estimates with estimates made under previous studies by the International Council for Clean TransportationFootnote 44, the National Renewable Energy LabFootnote 45, and RMI.Footnote 46
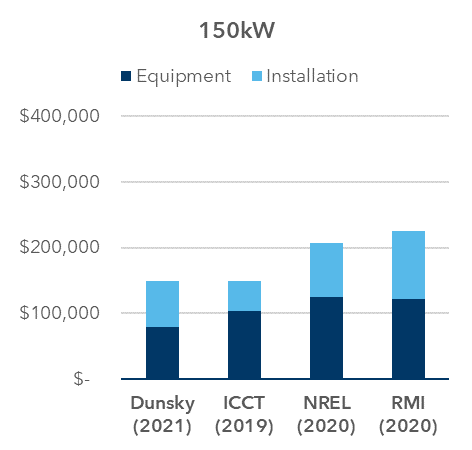
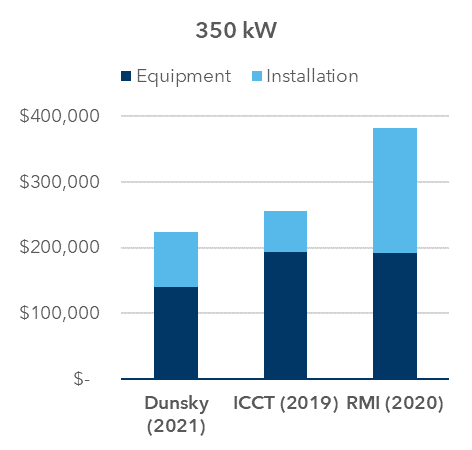
Figure 10: Comparison of DCFC deployment cost estimates per port, various years
Multiple factors will influence how these capital costs change over time. An increase in these costs could be expected as labour and equipment costs increase over time. To counteract that increase, however, we expect that economies of scale will be realized from installing multiple ports in the same location, along with increased equipment supply and familiarity in the market among contractors, electricians, and designers. This could cause costs to decline from their current levels by 2030 and 2035. Indeed, a study from the International Council on Clean Transportation estimates that 150 kW DCFC costs will decrease by 3% in 2030 compared to 2021, even when including an increase in installation costs of 4% per year.Footnote 47 At the same time, a trend towards higher power output for DCFC infrastructure will ultimately lead to a long-term increase in per-port costs while the costs per kW nameplate capacity (values in parenthesis in Table 12) will decrease.
For Level 2 charging, on the other hand, we do not anticipate as significant an increase in charging power over time. Instead, we expect that the primary factors impacting L2 deployment costs will relate to where chargers are installed, including whether they are installed in on-street locations (where costs can easily exceed $20k per port) vs off-street parking lots, the number of ports deployed in a given location and associated economies of scale, and the degree to which installations may become more expensive over time if locations with simpler installations are targeted first.
| Type of Port | 2025 | 2030 | 2035 | 2040 |
|---|---|---|---|---|
| DCFC | $160,000 (125 kW average) |
$240,000 (175 kW average) |
$240,000 (250 kW average) |
$240,000 (300 kW average) |
| L2 | $15,000 | $10,000 | $10,000 | $10,000 |
Further studies on actual infrastructure deployment costs and key factors could help to further refine this analysis. Public organizations that fund charging infrastructure deployment are in an excellent position to report on actual costs from funded projects and help to refine our collective understanding of the likely costs of expanding on this infrastructure in the future.
2.5.2 Results
Our cost assessment in Table 13 shows that meeting public charging infrastructure needs for LDVs would cost $17.7 billion by 2040. Most of these costs come from the installation of fast-charging ports, even though they account for less than 10% of total public ports.
| Type of Port | 2025 | 2030 | 2035 | 2040 |
|---|---|---|---|---|
| DCFC | $1,500 | $5,300 | $8,700 | $11,400 |
| L2 | $1,400 | $2,100 | $4,100 | $6,300 |
| Total Public Cost | $2,900 | $7,400 | $12,800 | $17,700 |
2.6 Alternate Scenarios for LDV Charging Needs
We performed a sensitivity analysis to assess the impacts of varying key assumptions on the number of public ports needed for LDVs. This section presents the individual impacts of changing assumptions on number of ports and explores different alternate scenarios, illustrating the range of possibilities that may unfold in response to changing conditions in the EV charging ecosystem.
2.6.1 Sensitivity Analysis
We conducted a sensitivity analysis on five key modeling inputs:
- Access to home charging (see Table 2 for a detailed description).
- Utilization rate of DCFC ports.
- Effective charging power of DCFC ports.
- Daily vehicle kilometres travelled.
- Network reliability.
The scenarios and their descriptions are presented in Table 14, and Table 15 outlines the impact on the number of ports needed by 2040 for each individual scenario modelled. The results are presented relative to the base case (high home charging access).
| Scenario | Definition & Assumptions | Source |
|---|---|---|
| Base case | Baseline assumptions + high access to home charging (see Table 2). Assumptions: 1) Federal policy change (e.g. building/electrical code) happens in 2030 and applies everywhere (100% EV ready new MFU after 2030). 2) Retrofits: 30% of 2021 stock is EV ready by 2030, 60% by 2035. |
Dunsky analysis |
| Low access to home charging | Low home charging access, in MFUs especially. No or few additional efforts on building/electrical code and retrofits to increase home charging access. Assumptions: 1) EV ready for new construction only in regions where already announced (Quebec, BC, Toronto, Vancouver, Montreal). 2) 10% of BC-Vancouver 2021 stock retrofitted, 0% elsewhere. |
Dunsky analysis |
| Higher utilization rate of DCFC ports | Assumes utilization-oriented pathway (economically viable utilization rate of network for private sector). Assumptions: Roughly doubles utilization rate of network relative to baseline, reaching 20% by 2040, leading to a higher portion of “profitable” chargers but an increased likelihood of congestion and lineups for EV drivers: 11% (2025), 18% (2030) and 20% (2035-2040). |
"Average network utilization of 15% for DC fast charging, the rate currently observed by top-tier charge point operators in Europe." Footnote 48 |
| Higher effective charging power of DCFC ports | Assumes higher nameplate capacity of DCFC ports and higher voltage architecture for EV to accept higher capacity. Assumptions: Assumes average charging power of all DCFC ports installed in Canada 50kW higher than baseline:175 kW (2025), 225 kW (2030), 300 kW (2035) and 350kW (2040). |
Identified ±50 kW as interval around baseline assumptions based on various studies. Footnote 49 Footnote 50 |
| Lower effective charging power of DCFC ports | Assumes lower nameplate capacity of DCFC ports and business-as-usual voltage architecture development for EV. Assumptions: Assume average charging power of all DCFC ports installed in Canada of 50 kW lower than baseline (75 kW by 2025, 125 kW by 2030, 200 kW by 2035 and 250 kW by 2040). |
ICCT assumes 75 kW and 125 kW by 2025 and 2030 respectively in its 2030 analysis for USA.Footnote 51 |
| Reduced daily travel | Assumes citizens will reduce their daily travel through densification policies and increasing use of public transit. Assumption: All LDVs reduce daily travel distance by 25% relative to baseline. |
NREL uses a 25% lower daily travel distance in its sensitivity analysis.Footnote 52 |
| Lower reliability of the network | Assumes overall network uptime is reduced by 2-3% compared to baseline of 97%-98%. This likely still reflects an improvement over current Canada-wide reliability. Assumption: Assumes all ports are on average down for 18.25 days per year (95% reliability). |
Based on: “A report commissioned by Natural Resources Canada showed that, in January 2022, 6% of AC and 5% of DC chargers were offline while 7% and 11% of AC and DC (respectively) charging sessions failed, lasting less than 5 minutes”.Footnote 53 |
Table 15: Impacts of alternate scenarios on 2040 number of ports required for Canada relative to baseline

Text version - Table 15
| Scenario | DCFC ports | L2 ports | Total Public Ports |
|---|---|---|---|
| Baseline | 47,414 | 631,200 | 678,614 |
| Low access to home charging | 11,100 | 105,700 | 116,800 |
| Higher utilization rate (DCFC) | -18,800 | 0 | -18,800 |
| Higher average effective charging power (DCFC) | -6,000 | 0 | -6,000 |
| Lower average effective charging power (DCFC) | 8,600 | 0 | 8,600 |
| Reduced daily travel (-25%) | -10,400 | -157,800 | -168,300 |
| Lower reliability of the network (5% downtime) | 1,400 | 19,900 | 21,300 |
The low access to home charging scenario assumes that the federal government and provinces generally do not adopt EV ready requirements for new construction, and little effort is made to retrofit the existing building stock to increase home charging access. This results in a greater reliance on public charging, especially for EV owners living in multifamily homes. By 2035, the impact on the number of ports is relatively limited, increasing needs by 55,000 ports (+12%), because our baseline scenario assumes that policies targeting home charging access start taking effect after 2030. However, by 2040, the impact is more significant and results in increased need of 117,000 public ports (+17%). We expect the impact of this sensitivity would increase further out to 2050 as a greater portion of EV drivers reside in multifamily buildings once the full LDV fleet has turned over to EVs.
The higher utilization rate of DCFC ports scenario assumes that utilization rates are roughly doubled compared to our baseline case. This would reflect a scenario in which a greater portion of public chargers are profitable, enticing greater investment interest from the private sector. However, higher utilization rates reflect a greater likelihood of charger congestion, leading to a greater chance of EV driver frustration due to lineups. This scenario has a relatively small impact on total number of public ports since it only affects DCFC, which account for a small share of total ports. However, the impact on DCFC needs (and related installation costs) is important, reducing needs by 18,800 (-40%) for 2040.
The higher DCFC power and lower DCFC power scenarios address the capability of fast-charging ports. In the high scenario, increased adoption of higher-power chargers (350 kW and above) and more EVs supporting such power levels would raise overall installed capacity and average effective power of DCFC. Conversely, the low scenario assumes DCFC installation in line with current deployment capacity. The power output of chargers is inversely proportional to the time required to deliver a given amount of energy, and therefore directly tied to the number of ports required to satisfy charging demand.
The reduced daily travel scenario envisions a 25% decrease in driving distances nationwide, reflecting a future where travel needs are increasingly met by public transit and active transportation, reliance on private vehicles decreases, and/or people drive less due to a continued impact from work from home provisions and/or more compact community development. This scenario has the biggest impact on infrastructure needs, reducing the required number of public ports by 168,300 (-25%) by 2040. These results showcase the important interconnectedness of electrification policies and investments in other sustainable mobility and land use.
Our baseline scenario assumes a network reliability of 97% by 2025 and 98% thereafter. This assumption is in line with the National Electric Vehicle Infrastructure Standards (NEVI) requirements for port uptime of 97%.Footnote 54 However, since the current reliability of AC and DC ports is lower than that (at 90%), we have modelled a scenario where uptime only reaches 95%, which would increase port requirements by 2-3% compared to baseline. While this would still reflect an improvement on current reliability levels according to some observations, we assume that the federal government and other stakeholders will take steps to address reliability issues directly, rather than implying that lower reliability levels would be acceptable if we design for a surplus of charging ports. For reference, NREL’s analysis of US charging needs assumes 100% uptime.
Overall, these results indicate that reduced driving distances and lower access to home charging have the most significant impacts on charging infrastructure requirements. Reduced driving distances decrease the demand for both L2 and DCFC ports, thus significantly reducing total public port requirements, while lower home charging access increases the need for public charging, particularly in the long term.
2.6.2 Pathways Analysis
The second step of this analysis involved combining some of the individual sensitivity scenarios to explore a range of possibles outcomes from evolving charging ecosystem conditions. To do so, we created five additional pathways using combinations of the scenarios used in the sensitivity analysis, as shown in Table 16.
| Scenario | Pathways | |||||
|---|---|---|---|---|---|---|
| Impact on public charging needs | P-1 High | P-2 Med High | P-3 Med | P-4 Med Low | P-5 Low | |
| Low access to home charging | + | x | x | Baseline assumption was used | Baseline assumption was used | Baseline assumption was used |
| Higher utilization rate of DCFC ports | - | Baseline assumption was used | Baseline assumption was used | Baseline assumption was used | x | x |
| Higher effective charging power of DCFC ports | - | Baseline assumption was used | Baseline assumption was used | x | Baseline assumption was used | x |
| Lower effective charging power of DCFC ports | + | x | Baseline assumption was used | Baseline assumption was used | Baseline assumption was used | Baseline assumption was used |
| Reduced daily travel | - | Baseline assumption was used | Baseline assumption was used | Baseline assumption was used | Baseline assumption was used | x |
| Lower reliability of the network | + | x | x | Baseline assumption was used | Baseline assumption was used | Baseline assumption was used |
Note: blank cells mean baseline assumption was used.
Figure 11 and Figure 12 illustrate that the charging needs under the various pathways vary most significantly in terms of the number of DCFC ports required since most of the scenarios specifically affect DCFC port requirements. Overall, our assessment shows that public port needs could range from 500,000 to over 830,000 by 2040 (relative to our baseline scenario at 678,000) based on different evolving market and policy conditions represented by the pathways. For DCFC, requirements range from 20,000 to up to 70,000 ports with our baseline scenario at 47,400 ports in 2040.
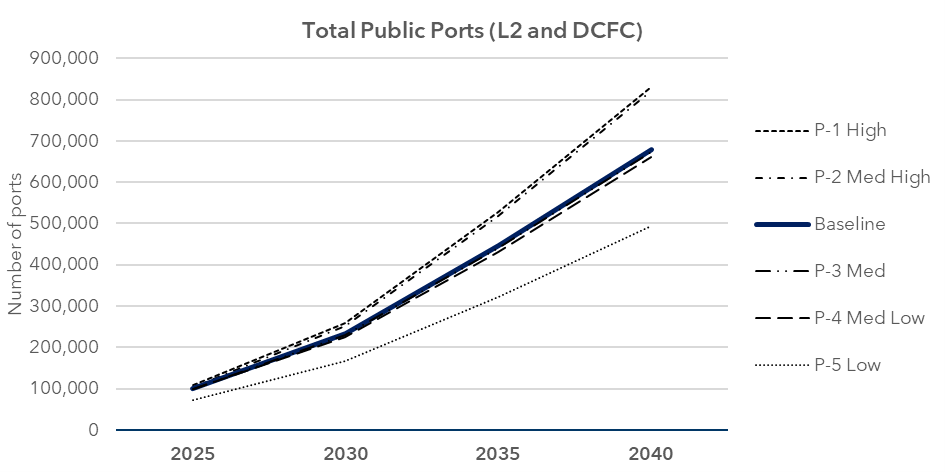
Figure 11. Public ports (L2/DCFC) needed from 2025 to 2040 under the baseline and five alternate pathways
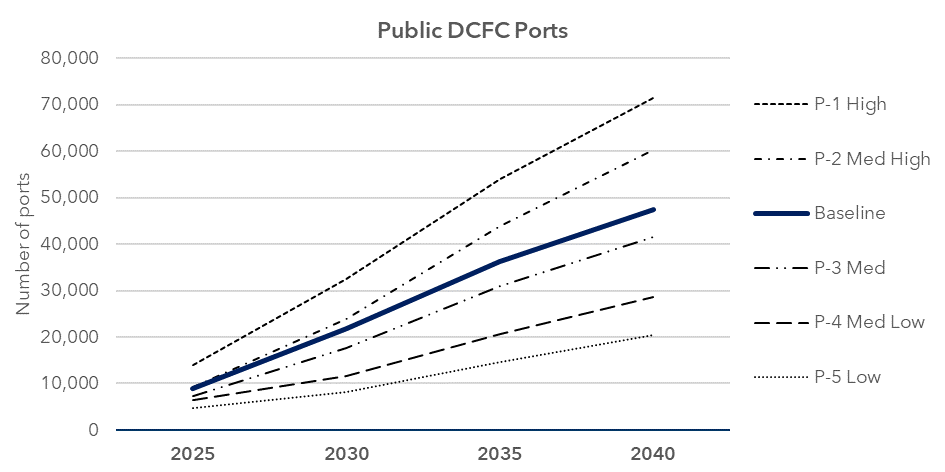
Figure 12. Public DCFC ports needed from 2025 to 2040 for the baseline and five alternate pathways
The difference between these scenarios is significant and highlights the need for complementary actions (e.g., increasing access to home charging, decreasing driving distance) to manage the scale of the EV charging challenge. These pathways also show that there is significant uncertainty in forecasting needs for charging infrastructure to 2040. Many factors such as home charging access, utilization rate, charging capabilities (charging power, reliability, bi-directional charging, etc.) and behavioural changes (daily travel, car ownership, ride sharing, etc.) could significantly impacts the number of ports required. Thus, the deployment of the infrastructure will have to be monitored and charging needs repeatedly assessed to ensure sufficient public charging infrastructure is available and support the adoption of zero-emission vehicles.
Chapter three
3. Medium- and Heavy-Duty Vehicle (MHDV) Charging Needs
Canada’s 2022 Emissions Reduction Plan sets zero-emission sales targets for new MHDVs at 35% by 2030 and 100% by 2040 (where feasible).Footnote 55 However, while there has been a considerable increase in the deployment of zero-emission LDVs in Canada, MHDVs are yet to see similar levels of uptake. A better understanding of the needs for supporting charging and refueling infrastructure and the pathways to deploy it is needed to support increased deployment of zero-emission MHDVs —including battery-electric and hydrogen powered vehicles.
In our base scenario, all zero-emission MHDVs are assumed to be battery-electric vehicles (BEVs) due to their higher level of technology maturity and better economic performance compared to hydrogen-powered trucks in all MHDV segments.Footnote 56 ICCT performed an analysis to determine the charging infrastructure needs for the growing battery-electric vehicle (BEV) fleet out to 2040, including the number of charging ports and associated costs, and the energy and power requirements from the grid. We also perform a sensitivity analysis to assess the extent to which charging needs for BEVs would be reduced if hydrogen-powered vehicles were to see a significant market uptake as a result of lower hydrogen prices (Section 3.5.1).
The greater diversity of MHDV vehicle types and utilization profiles compared to personal LDVs emphasizes the need for a more granular assessment of charging and energy needs. At the same time, the complexities associated with limited home charging access and public charging preferences are less important than they are with LDVs, with a large portion of fleets relying on return-to-base models. That said, certain MHDV use cases, especially long-haul trucks, are dependent on the availability of “public” (shared commercial) charging infrastructure designed for larger vehicles, and this will be a critical aspect of a comprehensive MHDV charging needs assessment. MHDVs have higher energy requirements than LDVs and are usually exposed to operational constraints that largely limit the time available for charging. As a result, MHDVs usually charge at much higher power levels, which is more dependent on electrical grids and can lead to significant upgrade requirements.
Our assessment of charging needs for MHDVs generally followed a similar approach to that for light-duty vehicles, although using a standalone model, inspired by previous ICCT analysis.Footnote 57
Key inputs and assumptions to mhdv charging demand forecasts
- Three MHDV sales forecast scenarios: Policy Reference (100% by 2040, 35% by 2030); Fast Adoption (35% by 2028); Slow Adoption (35% by 2032).
- Site spacing: 80 km for highways, 320 km for roads.
- Public/private charge site split: highways/rural highways are 100% public; roads are 25% public and 75% private.
- 2023 minimum port counts per site: 4 per site (highway and road – both private and public), 2 per site (rural highway).Footnote 58
- Three charger types: overnight (CCS 50 kW private and 100 kW public), fast charging (CCS 350 kW), and ultra-fast charging (MCS up to 2 MW).
- Charging type split for public sites: 44/56 overnight/fast charger (pre-2027); 54/38/8 overnight/fast/ultra-fast charger (post-2027).
- Charging type split for private sites: 88/12 overnight/fast charger (pre-2027); 89/10/1 overnight/fast/ultra-fast charger (post-2027).
- Average daily charger throughput: 3.2 vehicles/port (public); 1.2 vehicles/port (private)
- BEV stock build uptake assumption: assume 15% of “Light Truck” sales (in Statistics Canada classification) are Class 2b and 3 trucks (to avoid duplication with LDV forecast).
3.1 Overview of the Modelling Approach
As depicted in Figure 13, our modelling approach to generate annual estimates of charging infrastructure needs, installed power capacity requirements, and expected capital expenditures for charger deployment involved four key steps.
The first step in the analysis was to estimate the annual population of zero-emission MHDVs out to 2040. As shown in Figure 14, the source MHDV population data comes from Statistics Canada and is broken down into two trucks categories (medium and heavy trucks) and three buses categories (school, transit, and other buses). Of these five categories, medium trucks represent the largest portion of MHDV on the road with roughly 1.7 million vehicles, or 74% of the fleet. At just over 500,000 vehicles, heavy trucks are the next largest segment and make up 22% of the MHDV fleet. Together, the three bus categories include just above 90,000 vehicles, or 4% of MHDVs.
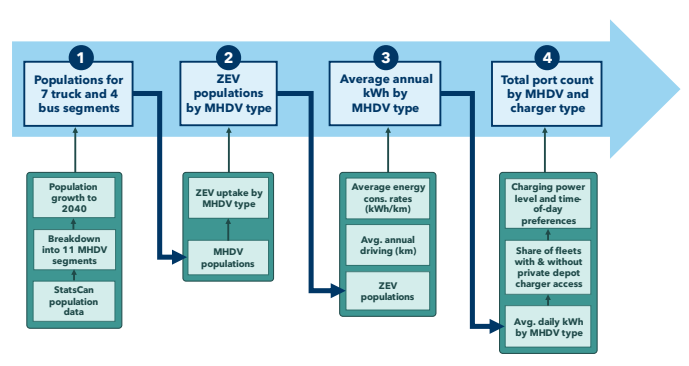
Figure 13. Methodology for estimating infrastructure requirements for MHDV
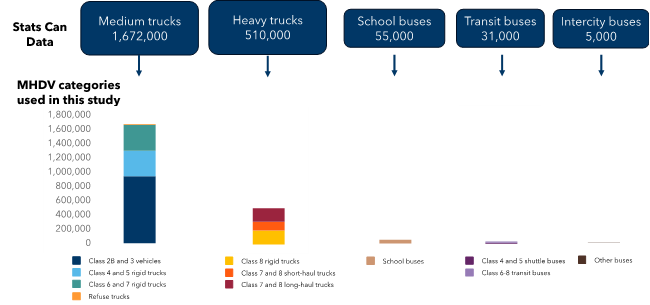
Figure 14. 2020 MHDV population estimates
The bottom portion of Figure 14 shows the vehicle categories used in this study. Taking the source Statistics Canada figures, we further segmented the MHDV fleet into seven truck and four bus categories based on truck and bus population breakdowns in the U.S. Environmental Protection Agency’s Motor Vehicle Emissions Simulator (MOVES) (see Table 17).
| Categories used for Canada | U.S. MOVES Category |
|---|---|
| Class 2b-3 | Single unit short-haul truck |
| Rigid Truck, Class 4-5 | Single unit short-haul truck |
| Rigid truck, Class 6-7 | Single unit short-haul truck |
| Rigid truck, Class 8 | Single unit short-haul truck |
| Refuse truck | Refuse truck |
| Tractor truck, short-haul | Combination short-haul truck |
| Tractor truck, long-haul | Combination long-haul truck |
| Shuttle bus, Class 4-5 | Transit bus |
| Transit bus, Class 6-8 | Transit bus |
| School bus, Class 6-8 | School bus |
| Other bus, Class 6-8 | Other buses |
With these baseline population figures, the second key step in the analysis was to develop estimates for the deployment of zero-emission vehicles over time based on the guiding assumption that all MHDV sales will be zero-emission by 2040. As described in more detail in Section 3.2, we developed ZEV sales and stock estimates for each of the 11 MHDV categories. In step three, we then used average per-vehicle energy consumption rates (i.e., kWh/km) and annual driving (vehicle kilometers traveled, or VKT) estimates to derive annual electricity demand needs by vehicle type.
Fourth, we estimated charging station and portFootnote 59 counts at the provincial level (summing this up into a national estimate) using assumptions about where vehicles charge (i.e., at public or private facilities) and how energy demands are met with various power levels of chargers (see Section 3.4). With this port count estimate by power level, we also determined the total installed capacity and requirements for the grid.
Finally, we assumed equipment and installation costs for each charger power level to determine the estimated annual capital expenses needed to roll out the nationwide charging network, which includes the costs of grid connections but not any upgrades required to the grid such as building extra substations, transformers, and distribution and transmission lines.
We used a coverage-based approach to infrastructure deployment for this study. In this approach, we assume an equal distribution of ports across all charging sites, as well as a minimum number of ports per site. Beyond this minimum port count per site, the number of ports is assumed to grow with energy demand and uniformly across all sites throughout the forecast period. As these modeling estimates are performed at the provincial level, we do not consider any infrastructure needs or costs for any specific city, corridor, or individual charging site.
3.2 Zero-Emission MHDV Stock Forecast
The MHDV segmentation in this analysis is based on categories in the MOVES model.Footnote 60 Our modifications for Canada’s MHDV fleet are outlined in Table 17 (a detailed description is found in Appendix C). The percentage of ZEVs sold over time are based on the federal government’s announcement in its March 2022 Emissions Reduction Plan that all new MHDV sales, wherever feasible, be zero-emission by 2040.
We developed three ZEV uptake scenarios that represent differing expectations on when an intermediate 35% ZEV sales target (i.e., 35% of all MHDV sales are zero-emission) will be reached. All three scenarios reach 100% ZEV sales in all MHDV categories by 2040. It should be noted that the federal target is 100% sales “for a subset of vehicle types based on feasibility”; as such our forecast should be viewed as an upper range for ZEV uptake. These three scenarios are:
- Policy Reference Scenario: 35% ZEV sales across all vehicle categories by 2030; 100% by 2040
- Fast Adoption Scenario: the 35% ZEV sales target is achieved in 2028; 100% by 2040.
- Slow Adoption Scenario: the 35% ZEV sales target is achieved in 2032; 100% by 2040.
Figure 15 is a graphical representation of these three scenarios. We assume a ZEV scrappage rate of 0% due to the lack of data on the typical lifetime of ZE-MHDVs; that is, we assume that all ZEVs remain in the fleet over time. The oldest vehicles in the analysis will therefore be 17 years old (2023 vehicles in 2040), while most will newer than that.
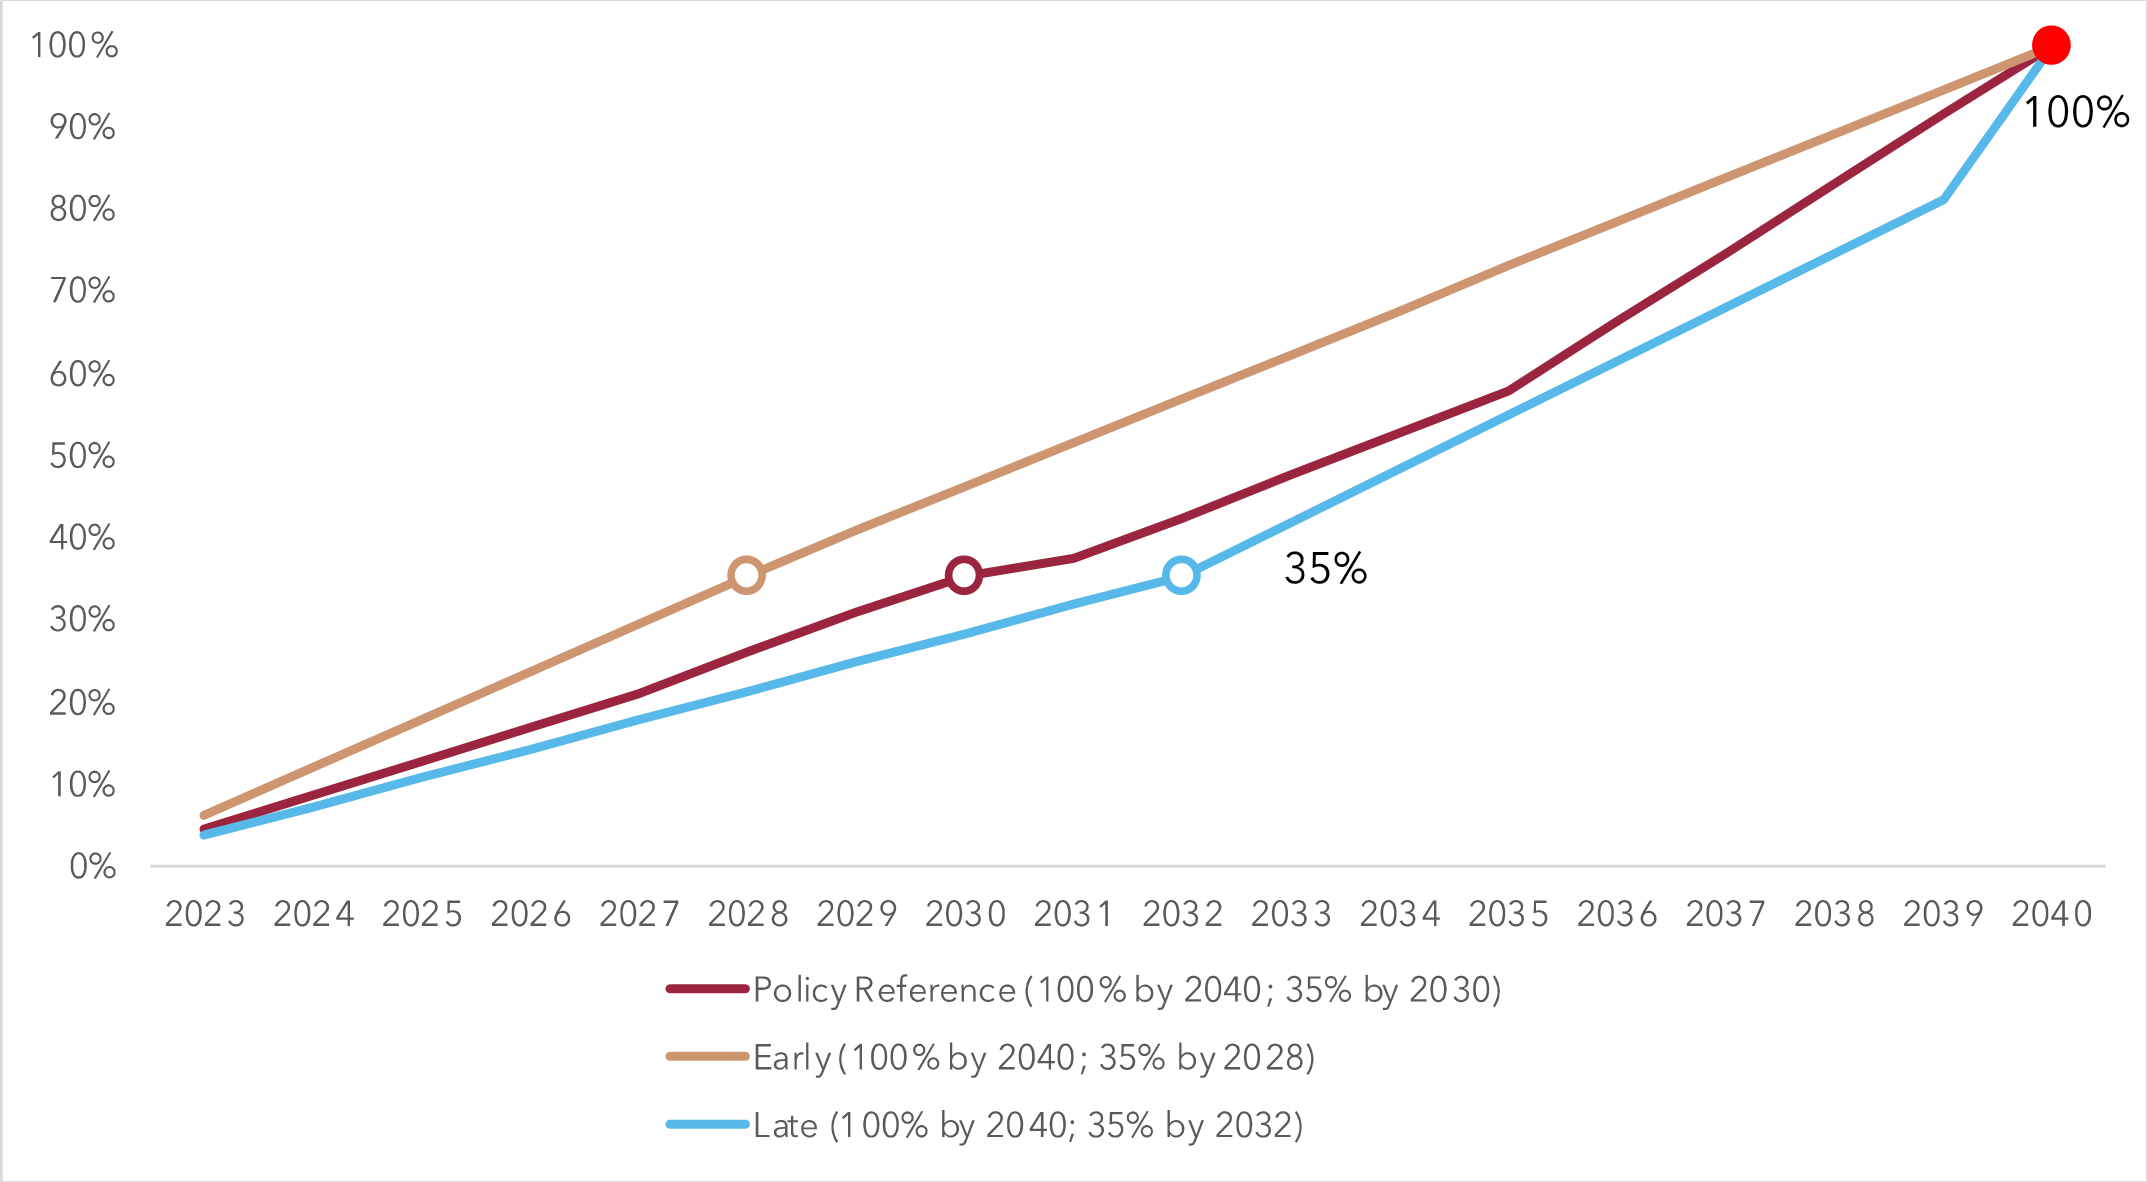
Figure 15. Zero-emission MHDV sales forecasts under three scenarios
Figure 16 illustrates total MHDV sales and ZEV sales assumptions for the Policy Reference scenario. All ZEVs are assumed to be battery-electric vehicles. MHDV sales growth is modeled to align with Canada’s GDP growth from 2023 to 2040. Footnote 61 The sales and stock estimates for Canada’s MHDV fleet are included in Appendix C.
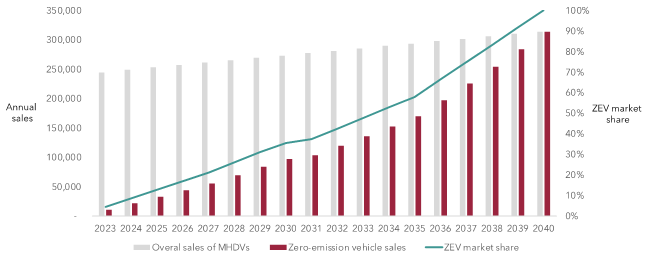
Figure 16. Total sales and zero-emission (battery electric) vehicle sales forecasts within the MHDV fleet for the Policy Reference scenario
Figure 17 illustrates the growing zero-emission MHDV stock, as well as the growing portion of the fleet that are ZEVs. Again, all ZEVs are assumed to be BEVs. The MHDV stock grows at a compound annual growth rate (CAGR) of 2.1% between 2023 and 2040. Also shown in Figure 17 is the breakdown by vehicle category of the ZEV stock, which demonstrates the significant prevalence of Class 2b and 3 vehicles in the vehicle population. In the Policy Reference scenario, the number of zero-emission MHDV’s in Canada grows from approximately 11,700 in 2023 to 414,000 in 2030, and nearly 2.4 million in 2040.
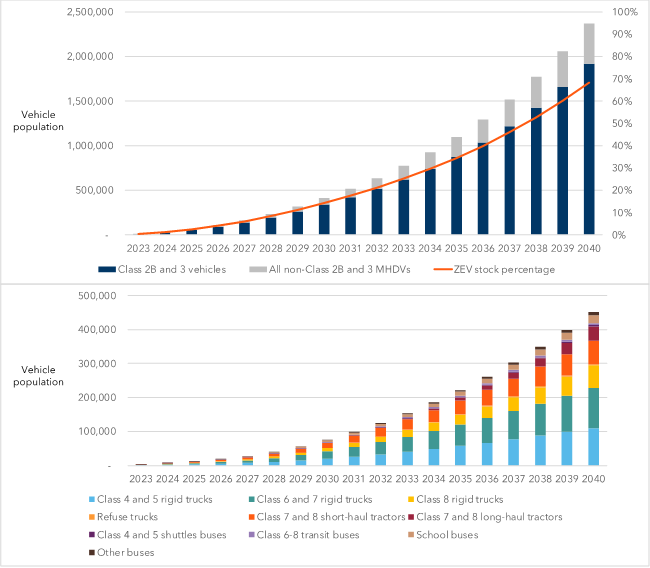
Figure 17. Zero-emission MHDV stock and percentage of the overall fleet
3.3 MHDV Energy Demand
We derived daily energy usage estimates for each vehicle class. The Comprehensive Energy Use Database (CEUD) presents annual kilometers driven by vehicle category, with 2019 figures shown in Appendix C for each province, as well as a national figure. Footnote 62 While 2020 data were available, we chose 2019 as a more representative data set given the limited economic activity in 2020 due to the COVID-19 pandemic. The vehicle-level activity is assumed to remain constant over time. We mapped the CEUD vehicle categories—medium trucks, heavy trucks, school buses, transit buses, and intercity buses—to the seven truck and four bus segments used in this study (as described in Section 3.1) and assigned daily activity (km) estimates, assuming MHDVs operate between 260 and 300 days per year. Appendix C outline the daily driving assumptions by province and by vehicle classification for the CEUD categories and as mapped to the 11 MHDV segments used in this analysis. Figure 18 shows the growing energy demand by vehicle category. Due to their higher energy intensity, non 2b-3 vehicles represent a disproportionate share of total energy consumption compared to their population share.
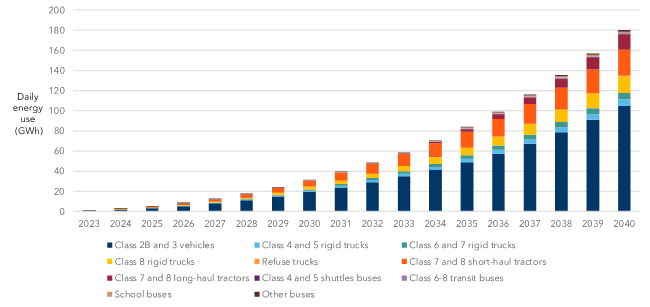
Figure 18. Daily energy requirements for zero-emission MHDVs
3.4 MHDV Charging Behaviour
3.4.1 Public and Private Charging
MHDV fleets can charge at either private or public locations, and with different power levels, based on operational constraints. Due to their higher energy needs compared to light-duty vehicles, MHDVs will rely exclusively on DC fast charging for the overwhelming majority of cases. The Combined Charging System (CCS) can deliver up to 350 kW of nominal power. The Megawatt Charging System (MCS), which is expected to be commercially available in 2027, can deliver up to 3.75 MW of nominal power. Current developments suggest that the first MCS chargers deployed in North America will first deliver up to 1.2 MW, and that they could quickly scale up to 2 MW.
Overnight charging at the fleet’s own depot is usually considered the most economical and least constraining option for return-to-base MHDV segments, as a lower charging power is usually associated with lower costs, and the flexibility of depot charging allows for managed charging techniques such as smart charging. Some segments, like long-haul trucks, do not return to a depot on a daily basis and need to rely on public charging only. Public overnight chargers for those vehicles are likely to materialize, to accommodate fleets operational constraint and give long-haul truckers access to low-cost energy. Overnight charging can occur at different power levels, depending on the vehicle’s energy needs and the fleet’s operational constraint. In this study, overnight chargers at depots are assumed to have a standard power level of 50 kW. Overnight chargers at public locations are assumed to be mostly designed for long-haul trucks with higher energy needs, and are therefore set at 100 kW.
The amount of energy charged overnight at the depot is limited by the battery capacity and is not always sufficient to satisfy the daily energy consumption of the vehicle. The remaining energy is provided by opportunity charging with “fast” chargers (CCS, 350 kW) and “ultrafast” chargers (MCS, 2 MW) when they become available. Opportunity charging occurs during breaks throughout the day, either at public charging stations on highways or at destination locations such as warehouses and intermodal hubs like ports. Opportunity charging is usually more constrained and presents less opportunities for managed charging. Charging sessions are assumed to last 30 minutes with both CCS and MCS chargers.
We made assumptions on charging behaviour by splitting the total energy demand from each MHDV segment by charger type and public or private locations, based on previous ICCT analysis, as shown in Table 18.Footnote 63 Those assumptions reflect our understanding of fleet preferences and operational constraints for each segment.
| Private | Public | |||||
|---|---|---|---|---|---|---|
| Overnight | Fast | Ultra-fast | Overnight | Fast | Ultra-fast | |
| Class 2B and 3 vehicles | 72% | 13.5% | 0.5% | 0% | 13.5% | 0.5% |
| Class 4 and 5 rigid trucks | 72% | 13.5% | 0.5% | 0% | 13.5% | 0.5% |
| Class 6 and 7 rigid trucks | 72% | 13.5% | 0.5% | 0% | 13.5% | 0.5% |
| Class 8 rigid trucks | 0% | 0% | 0% | 51% | 14% | 35% |
| Refuse trucks | 87% | 6% | 7% | 0% | 0% | 0% |
| Class 7 and 8 short-haul tractors | 15% | 2% | 8% | 44% | 7% | 25% |
| Class 7 and 8 long-haul tractors | 0% | 0% | 0% | 80% | 1% | 19% |
| Class 4 and 5 shuttles buses | 98% | 1% | 1% | 0% | 0% | 0% |
| Class 6-8 transit buses | 98% | 1% | 1% | 0% | 0% | 0% |
| School buses | 70% | 30% | 0% | 0% | 0% | 0% |
| Other buses | 99% | 0.5% | 0.5% | 0% | 0% | 0% |
Multiplying the percentages in Table 18 by the daily energy consumption figures (Figure 18) yields the distribution of energy delivered by the three charger power levels for private and public stations, as shown in Figure 19.
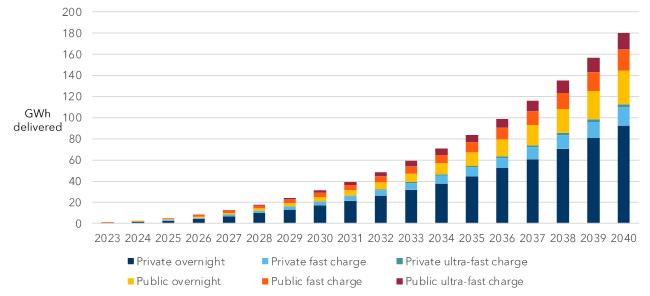
Figure 19. Daily energy delivered by MHDV charger type
Factoring in assumptions on the average charging time for each charger type, and charger throughput, we obtained the split of installed ports per type shown in Table 19.
| Private | Public | |||||
|---|---|---|---|---|---|---|
| Overnight (CCS) | Fast (CCS) | Ultrafast (MCS) | Overnight (CCS) | Fast (CCS) | Ultrafast (MCS) | |
| Charger power (kW) | 50 | 350 | 2,000 | 100 | 350 | 2,000 |
| Charging time (h) | 8 | 0.5 | 0.5 | 6 | 0.5 | 0.5 |
| Charger through-put (vehicles/day) | 1 | 3 | 3 | 1.5 | 6 | 6 |
| Charger split up to 2026 | 88% | 12% | 0% | 44% | 56% | 0% |
| Charger split from 2027 onwards | 89% | 10% | 1% | 54% | 38% | 8% |
3.4.2 Port and Site Counts
We estimated the number of charging sites required based on highway and road lengths, as per Infrastructure Canada’s Inventory of publicly owned road assets.Footnote 64 To ensure nationwide coverage, we assumed a consistent spacing of 80 km between any two sites for highways (including rural highways), and 320 km between any two sites for all other roads.Footnote 65 This provides a baseline number of charging sites for 2023, which is held constant throughout the study period. Table 20 shows the number of highway, rural highway and road charging sites by province.
We assumed only public charging sites on highways and rural highways, as a large share of the traffic on those corridors is from long-haul freight vehicles that do not return to a depot on a daily basis, or regional delivery vehicles that need a fast opportunity charge. The road network would host mostly private charging sites, typically depots and destination locations such as customer’s warehouses, for urban and regional delivery vehicles as well as buses. Below are the assumptions on the split of charge sites:
- 100% Highway sites are public.
- 100% Rural Highway Sites are public.
- 25% Road sites are public.
- 75% Road sites are private.
| 2023 ZEV MHDV Stock | Highway Sites | Rural Sites | Road Sites | Total Sites | |
|---|---|---|---|---|---|
| Alberta | 2,491 | 85 | 464 | 156 | 705 |
| Ontario | 3,532 | 86 | 129 | 198 | 413 |
| Saskatchewan | 680 | 69 | 209 | 116 | 394 |
| BC & Territories | 1,905 | 252 | 2 | 77 | 331 |
| Quebec | 2,005 | 70 | 33 | 125 | 228 |
| Manitoba | 421 | 35 | 73 | 63 | 171 |
| New Brunswick | 235 | 27 | 5 | 23 | 55 |
| Nova Scotia | 257 | 24 | 2 | 24 | 50 |
| Newfoundland & Labrador | 157 | 16 | 6 | 16 | 38 |
| Prince Edward Island | 46 | 0 | 1 | 5 | 6 |
| Canada | 11,730 | 664 | 924 | 803 | 2,391 |
The number of charging ports needed in 2023 is assessed based on the number of sites, and the minimum required number of ports –per –site:
- Highways: minimum of 4 ports per site
- Rural highways: 2 ports per site
- Roads (private and public): 4 ports per site
This ensures base availability of charging infrastructure for MHDVs across all provinces in the early years of market development.
In subsequent years, the increase in port counts is calculated based on total daily energy consumption of the BEV fleet at private and public sites, and the typical energy throughput for different charger types. Our analysis found that that the average daily usage of each vehicle category is less than the implied range.Footnote 66 Usage varies widely by vehicle type, from 27% for “other buses (6-8)” to 90% for “long-haul tractor trucks”. Averaged across all vehicle types, the daily energy required is 78 kWh (compared with an average battery size of 179 kWh), meaning that in most cases the battery is not depleted at the end of the day, and only a partial charge is needed. We find that an average overnight charger power of 50 kW is sufficient to replenish MHDV batteries, assuming a charging window of eight hours.
Appendix C outlines the per-port energy requirement for throughput values at both public and private ports, based on our finding that a given vehicle only needs a partial charge at the end of each day, and our assumption of the average overnight charger power at 50 kW. The throughput assumptions represent vehicles-per-port for a partial charge; but a metric is also shown for an equivalent full charge throughput.Footnote 67
Per-port power requirements and capital cost assumptions are shown in Table 21 below. Capital costs include equipment, installation and labour costs.Footnote 68
| Port Type | Per-port power (kW) | Per-port capital costs | |||
|---|---|---|---|---|---|
| 2025 | 2030 | 2035 | 2040 | ||
| Overnight | 50 | $78,637 | $74,604 | $71,323 | $68,761 |
| Fast Charge | 350 | $234,129 | $225,352 | $218,747 | $214,254 |
| Ultra-Fast Charge | 2,000 | $645,224 | $629,631 | $620,107 | $616,569 |
3.5 Results: MHDV Charging Needs
By 2040, when Canada is targeting 100% of MHDV sales to be zero-emissions (for a subset of vehicle types where feasible), under our Policy Reference scenario we estimate a need for 275,000 public charging ports across Canada to meet the needs of the MHDV sector (Figure 20), and a total of 1.42 million public and private ports. This translates to a ratio of 1.7 BEVs for every port, and 8.6 BEVs per public port. The total number of ports needed ranges from a low of 1.26 million (under the Slow Adoption scenario) to a high of 1.67 million (under the Fast Adoption scenario).
To deploy this level of MHDV charging infrastructure by 2040 will require cumulative capital investments of approximately $152 billion (range: $135-180 bn). Of this total we estimate public charging infrastructure will require investments of $40-56 billion over the next 15 years, while private or depot charging infrastructure will need an additional $94-124 billion. Table 22 summarizes the results for the MHDV base case scenario (see Appendix C for alternative scenario results). Annual capital costs to deploy public charging infrastructure are expected to grow from $340 million in 2025 to $1.7 billion by 2030, and eventually reach $6.4 billion by 2040 (under our policy reference scenario).
| Type of Port | Cumulative Capital Cost ($ bn) | Number of Ports | Ratio of BEV/ports | Installed Capacity / BEV (kW) |
|---|---|---|---|---|
| Public – Total | $47.2 | 274,992 | 8.6 | 40.3 |
| Public – Overnight | $10.6 | 148,495 | 16.0 | 6.3 |
| Public – Fast | $22.9 | 104,498 | 22.7 | 15.4 |
| Public - Ultra-Fast | $13.7 | 21,999 | 107.8 | 18.6 |
| Private – Total | $105.3 | 1,143,423 | 2.1 | 48.0 |
| Private – Overnight | $73.0 | 1,017,646 | 2.3 | 21.5 |
| Private – Fast | $25.1 | 114,344 | 20.7 | 16.9 |
| Private - Ultra-Fast | $7.1 | 11,433 | 207.3 | 9.6 |
| Total – Public and Private | $152.5 | 1,418,415 | 1.7 | 88.3 |
Note: we assume average power values of 50 kW for overnight charging, 350 kW for fast charging, and 2 MW for ultra fast charging.
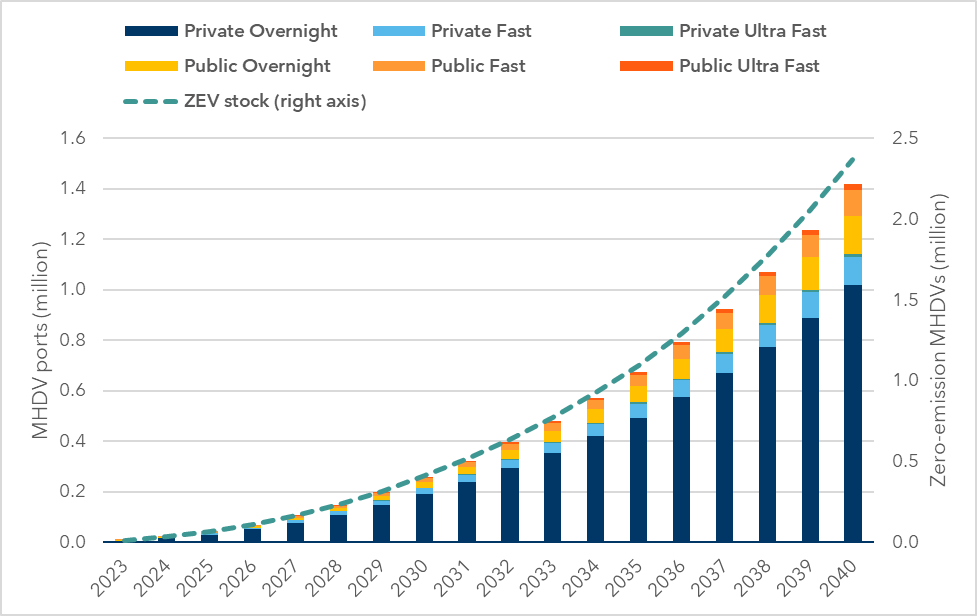
Figure 20. Public and private/depot MHDV charging infrastructure by port type, 2023 to 2040
Several points are worth noting in these results:
- Fast growth in the electric MHDV market is expected post-2030: The ramp up in BEV adoption is gradual, with much of the growth occurring after 2030. For instance, the annual number of public port installations (under the Policy Reference scenario) grows from approximately 2,000 in 2025 to 10,000 in 2030, reaching 38,000 by 2040. Private and depot installations follow a similar trajectory, rising from 17,000 in 2025 to 50,000 in 2030, to 143,000 per year by 2040. More than 80% of MHDV ports are expected to be overnight chargers, which are less costly to install and require less power than fast or ultra-fast ports. Still, infrastructure projects can incur long lead times, especially when grid upgrades are required. Governments, fleet owners, charge point operators and other stakeholders should start planning today for the expected investments and related impacts of this new charging infrastructure.
- Significant uncertainty remains on what will be the dominant charging patterns for different MHDV segments. This uncertainty impacts modelling parameters such as port power, infrastructure utilization, and charging load for electrical grids. As a result, the numbers presented in this type of analysis are helpful to provide orders of magnitude for the investments required in deploying charging infrastructure, and to steer those investments in priority towards certain types of charging. However, for capacity planning purposes, it is important that electric utilities engage with the MHDV fleets operating in their service areas to obtain a more granular and more accurate idea of the loads they can expect from MHDV charging.
- Capital costs for charging infrastructure deployment are spread over nearly two decades: Although the headline charging capital cost figures are significant, these are also expected to grow slowly in the near term and increase more rapidly post-2030, aligning with the growth of the zero-emissions MHDV stock. For public MHDV infrastructure – which accounts for about one third of total capital investments – we estimate that annual investments will need to scale up to about $1.7 billion by 2030 and more than $6 billion by 2040 in order to meet the upper end of the federal government’s MHDV target (100% sales by 2040 where feasible). About 84% of these investments will support the deployment of public chargers along highways (including rural highways), while the remaining 16% will go to public chargers on roads.
- Access to private charging will be essential to enable zero-emission MHDV adoption: Overnight depot charging will be more important than on-road fast or ultra-fast public charging for many commercial truck and bus operators. In particular, bus fleets are expected to rely only on depot charging. Beyond providing funding for public MHDV charging ports, governments must also find ways to unlock the significant amounts of capital ($4.7 billion per year in 2030 and up to $12.7 billion per year in 2040) to enable MHDV operators to install charging capacity at their depots.
3.5.1 Hydrogen Cost Scenarios
Analysis by ICCT suggests that battery electric vehicles are likely to provide the most cost-effective and feasible option for reaching zero-emissions for most MHDV types and scenarios. The technology for hydrogen Fuel Cell Electric Vehicles (FCEVs) is not yet as mature, and the technology is lacking a favourable business case due to its lower energy efficiency, and the currently high costs of renewable hydrogen.Footnote 69 While other forms of hydrogen exist and are much cheaper, such as the hydrogen produced from natural gas, we do not consider those options as viable decarbonization pathways. As a result our analysis focused on BEVs as the main pathway to decarbonize Canada’s MHDV sector.
However, FCEVs may have some practical advantages in the long-haul truck segments beyond any economic consideration, as these vehicles have extended ranges and better performance in colder climates relative to BEVs. As such, we examined the impact that a certain market penetration of hydrogen trucks would have on the BEV stock, and the resulting decrease in electricity demand from lower charging needs. We assessed how a decrease in hydrogen costs could lead to increased market penetration of hydrogen trucks.
For our primary analysis we assumed a levelized cost of renewable hydrogen (including fueling costs) of CA $9/kg, consistent with previous ICCT analysis, and assumed that at this price point there would be zero uptake of FCEV trucks.Footnote 70 We also modelled two alternative price points of $6/kg and $5/kg for renewable hydrogen. We examined how these lower costs would enable a shift from BEV to FCEV in the long-haul truck segment.
Table 23 shows that these two lower price points lead to a 5.5% and 15.9% attrition rate from BEV to FCEV for long-haul trucks, resulting in an expected reduction in electricity requirements of 246-715 GWh by 2040. It should be noted that this analysis does not consider the energy demand impacts of producing hydrogen via electrolysis.
| Hydrogen Price (C$/kg) |
Long-haul truck stock attrition % (BEV to Hydrogen-Powered Vehicle) |
Energy Requirement Decrease (GWh) | ||
|---|---|---|---|---|
| 2032 | 2035 | 2040 | ||
| $6 | -5.5% | 1.43 | 44 | 246 |
| $5 | -15.9% | 4.13 | 128 | 715 |
Chapter four
4. Regional Findings
4.1 Regional Charging Port Results
Our analysis also provides a regional breakdown of key results, providing an additional level of granularity to previous Canada-wide assessments. We explored charging infrastructure requirements, energy demand, and equipment costs for all provinces and territories for LDVs and MHDVs. We also assessed LDV charging requirements for the three most densely populated metropolitan regions (Toronto, Vancouver and Montreal). Table 24 below provides a summary of the public charging infrastructure needs by province and territory from 2025 to 2040. For a more detailed breakdown of results by charger type, see Appendix D.
| Province/ Territory | 2025 | 2030 | 2035 | 2040 | |||||
|---|---|---|---|---|---|---|---|---|---|
| LDV | MHDV | LDV | MHDV | LDV | MHDV | LDV | MHDV | ||
| AB | 4,016 | 1,424 | 13,581 | 6,604 | 40,040 | 19,186 | 72,920 | 43,712 | |
| B.C. & Terr. | 15,663 | 1,090 | 28,706 | 3,618 | 45,438 | 10,303 | 65,720 | 23,248 | |
| MB | 1,433 | 349 | 5,021 | 1,166 | 14,869 | 3,472 | 26,617 | 7,997 | |
| NB | 968 | 143 | 4,048 | 598 | 10,421 | 1,752 | 15,613 | 3,989 | |
| NL | 590 | 92 | 2,413 | 256 | 7,997 | 653 | 15,730 | 1,421 | |
| NS | 1,359 | 127 | 4,409 | 640 | 12,745 | 1,839 | 22,651 | 4,175 | |
| ON | 27,711 | 2,777 | 67,949 | 18,868 | 174,975 | 56,434 | 301,012 | 130,036 | |
| PEI | 302 | 9 | 952 | 40 | 2,642 | 99 | 4,562 | 213 | |
| QC | 47,338 | 1,270 | 103,346 | 8,239 | 125,114 | 24,200 | 129,520 | 55,400 | |
| SK | 1,138 | 810 | 4,016 | 931 | 12,521 | 2,156 | 24,269 | 4,801 | |
| CMAs | |||||||||
| Vancouver | 8,640 | - | 16,590 | - | 27,950 | - | 40,320 | - | |
| Montreal | 28,020 | - | 62,910 | - | 78,870 | - | 86,140 | - | |
| Toronto | 15,180 | - | 38,330 | - | 96,170 | - | 167,510 | - | |
| Canada | 100,518 | 8,091 | 234,441 | 40,960 | 446,762 | 120,094 | 678,614 | 274,992 | |
Note: CMA is Census Metropolitan Area. For a detailed breakdown of regional results see Appendix D.
As Figure 21 shows, public charging infrastructure grows rapidly across all provinces and territories, with moderate growth to 2030 and more rapid growth after 2030 (particularly in provinces like Ontario and Alberta that lack provincial ZEV sales mandates and will thus see slower initial adoption). Public charging infrastructure needs are, unsurprisingly, highest on an absolute basis in the most populated regions: 85% and 92% of public LDV and MHDV ports, respectively, are concentrated in just four provinces in 2040: Ontario, Quebec, BC and Alberta. Within these provinces, we also see a concentration of charging infrastructure in the largest census metropolitan areas, with Toronto, Montreal and Vancouver accounting for about half (45 to 55%) of total charging demand in Ontario, Quebec and BC, respectively.
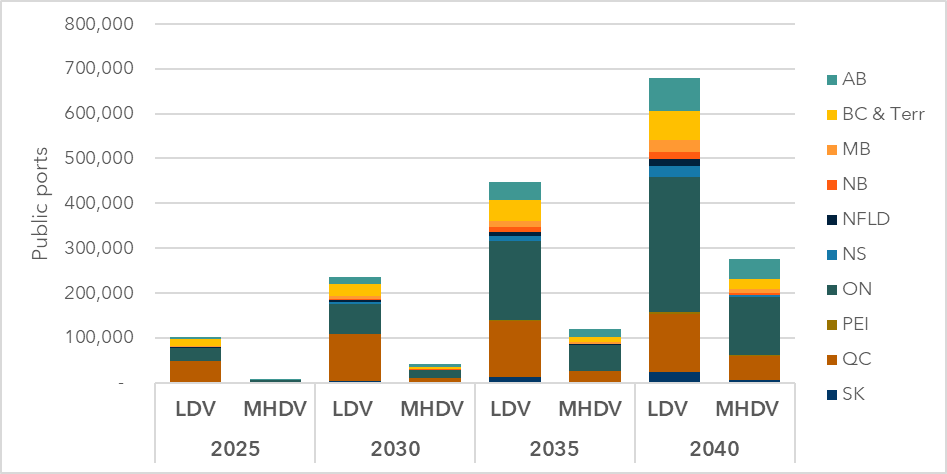
Figure 21. Public charging needs by province and territory from 2025 to 2040 for LDVs and MHDVs.
Below we present a comparison of near-term (2025 and 2030) LDV regional charging forecasts with current public infrastructure, using NRCan’s public database of EV charging stations.Footnote 71 As Table 25. Regional charging needs for LDV in 2025 and 2030 relative to current public networks shows, all regions—with the exception of Prince Edward Island—would need to at least double the current number of public ports to meet expected charging needs in 2025. By 2030, six provinces would see more than 10-fold growth in ports relative to 2023. Even provinces that dominate public charging installations to date—such as B.C., Quebec and Ontario—still have a significant gap in the near term to meet future expected charging needs. We present these as a comparison between today’s baseline and a pathway that aligns with the federal EV sales targets and regulation, rather than specific provincial/territorial targets.
| Province/ Territory | 2023 –Public ports | 2025 | 2030 | ||
|---|---|---|---|---|---|
| Public ports | Growth vs 2023 | Public ports | Growth vs 2023 | ||
| AB | 1,357 | 4,016 | 3x | 13,581 | 10x |
| B.C. | 5,059 | 15,460 | 3.1x | 28,260 | 5.6x |
| MB | 399 | 1,433 | 3.6x | 5,021 | 12.6x |
| NB | 386 | 968 | 2.5x | 4,048 | 10.5x |
| NL | 176 | 590 | 3.4x | 2,413 | 13.7x |
| NS | 410 | 1,359 | 3.3x | 4,409 | 10.8x |
| ON | 8,611 | 27,711 | 3.2x | 67,949 | 7.9x |
| PEI | 281 | 302 | 1.1x | 952 | 3.4x |
| QC | 9,113 | 47,338 | 5.2x | 103,346 | 11.3x |
| SK | 329 | 1,138 | 3.5x | 4,016 | 12.2x |
| Territories | 32 | 203 | 6.3x | 446 | 13.9x |
| Canada | 26,121 | 100,518 | 3.8x | 234,441 | 9x |
4.2 Regional Capital Costs
Following differences in population among regions, there is also a large variation in EV charging capital investments required among regions. An estimated $15.6 billion will need to be invested across Canada by 2030 to meet public LDV and MHDV charging needs. By 2040 this cumulative investment could exceed $66 billion. As Table 26 and
Figure 22 illustrate, the majority of this total is split between four provinces: Ontario (45%); Quebec (20%); Alberta (14%); and BC and the Territories (9%). The remainder is spread between the other provinces.
| Capital costs ($M) | 2025 | 2030 | 2035 | 2040 |
|---|---|---|---|---|
| AB | $384.8 | $1,654.5 | $4,459.9 | $9,240.3 |
| B.C. & Terr. | $672.5 | $1,755.6 | $3,291.3 | $5,888.8 |
| MB | $112.2 | $377.5 | $999.0 | $1,970.8 |
| NB | $53.2 | $221.7 | $565.3 | $1,089.4 |
| NL | $40.4 | $118.9 | $293.6 | $547.0 |
| NS | $62.1 | $244.1 | $631.4 | $1,200.6 |
| ON | $1,283.7 | $5,768.3 | $14,898.5 | $29,876.8 |
| PEI | $8.9 | $30.4 | $71.5 | $121.3 |
| QC | $1,338.4 | $4,212.0 | $7,846.4 | $13,497.3 |
| SK | $625.4 | $1,234.6 | $1,867.0 | $2,723.8 |
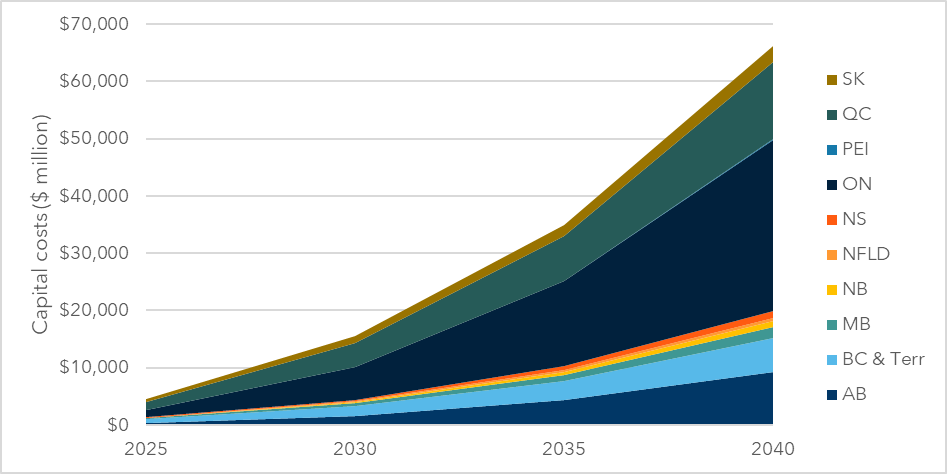
Figure 22. Cumulative regional capital costs for LDV and MHDV charging infrastructure
Chapter five
5. Grid Impacts Assessment
Besides developing an understanding of the number and types of charging infrastructure required to support targeted levels of EV adoption across Canada, this project also estimated the impact of EVs on the electric grid. Transportation electrification represents a significant transfer of energy demand from fossil fuels to the electricity sector, and it will be critical to anticipate the load growth associated with this transition and understand what utilities across Canada will need to do to accommodate this new demand.
Estimating future load growth from EVs and the likely investments required to accommodate this load is challenging, and this analysis at a national scale is necessarily approximate. Ultimately, utilities across Canada are responsible for forecasting demand on their systems and planning their investments accordingly. Individual utilities are in a position to conduct a careful assessment of geographic distribution of EV loads within their service territory and overlay the results on top of their existing infrastructure capacity—an exercise that many Canadian utilities are already undertaking.
In addition to uncertainties around the geographic distribution of EVs, there is also uncertainty around several parallel transformations that the electricity sector is undertaking, including grid decarbonization, building electrification, and deployment of distributed energy resources (DERs). EVs can potentially play a significant role as DERs themselves, delivering valuable flexibility to the grid through EV load management, and even leveraging onboard energy storage for grid support through bi-directional charging. The success of these transformations will depend on technology advancements, associated costs and consumer adoption.
In the face of these uncertainties, this section attempts to identify a range of possible outcomes in terms of EV grid impacts and associated costs. While further study is certainly warranted, especially by individual utilities in their ongoing load forecasting and capacity planning efforts, our analysis should help to inform ongoing discussions at the national level about grid readiness for EVs, and identify key challenges and opportunities as Canada looks towards its ZEV adoption targets.
Key inputs and assumptions to grid impacts assessment
- EV adoption forecasts: we used the same forecasts as those used for the charging needs assessments in previous sections, based primarily on Transport Canada modelling in line with Federal ZEV targets.
- Energy consumption: we used the same energy consumption rates by vehicle segment as those used for the charging needs assessments in previous sections. This includes modest efficiency improvements over time.
- Temperature adjustment: we adjusted energy consumption values to account for increased energy consumption in cold weather, based on the coldest daily average temperature for each region using historic temperature data from 2022. Warmer winters in the future may reduce peak load impacts from EVs, or vice versa if climate change leads to periods of extreme cold.
- Load profiles: we leveraged our in-house database of hourly load profiles for a range of combinations of vehicle types and charging locations. While these are primarily based on actual EV charging data across a range of studies, charging behaviour datasets are still relatively limited, especially for MHDVs which have so far only been deployed in limited numbers. Actual charging patterns and hourly load impacts may differ.
- Grid upgrade costs: we developed a range of estimates of likely grid upgrade costs based on other studies and input collected from utilities.
5.1 Methodology
Our methodology used the same EV adoption forecasts and energy needs used for assessing charging infrastructure needs (see Section 2.3 for a more detailed description). Building on this, we incorporated hourly load profiles for each type of vehicle (light-, medium- and heavy-duty) and by charging type (residential, public, workplace, fleet depot) to assess the total grid impact for each region.
We engaged directly with utilities across Canada to understand how this anticipated load growth compares with existing grid capacity, likely grid constraints and potential upgrades required, and develop reasonable assumptions for generation, transmission and distribution capacity costs (typically expressed in $/kW of capacity).
The following is an overview of the methodology for assessing the grid impact of load growth associated with anticipated EV adoption levels (see Figure 23 for a visual summary):
- We used our estimate of average daily energy needs (kWh) developed for the charging needs assessment out to 2040 (see Section 2.3). This was disaggregated by vehicle type (LDV, MDV, HDV) and charger type/location. We adjusted the temperature for the lowest average daily temperature for each region in 2022 to factor in extreme weather impacts on vehicle efficiencies and energy demand.
- Next, we established hourly winter load profiles (over a 24-hour period) for each vehicle type and charging location. We used winter load profiles to reflect the fact that all Canadian provinces are expected to shift from summer to winter peaking as uptake of efficient electrification technologies (such as EVs and heat pumps) grows. For the case of EVs, cold temperatures drive higher overall energy demand, longer charge times, and slightly increased morning load due to vehicle pre-conditioning before departure—a critical consideration for utilities with morning peaks.
- This provides an output of hourly energy demand (in kW) for each vehicle type and charging location (home, public, workplace and depot). These were summed for each province (based on provincial vehicle adoption forecasts) to produce our estimate of cumulative hourly EV load impact during winter. These results included scenarios for different seasons and levels of participation in smart charging programs. More specifically, we produced load impact estimates for managed and unmanaged charging scenarios to show the potential benefit from managed charging.
- Estimate utility capacity costs: We then estimated the likely cost of utility capacity upgrades based on input from utilities in each province, under the different managed and unmanaged scenarios produced. This included estimates of transmission and distribution avoided capacity costs (typically expressed in $/kW of capacity or $/kW-year) which is a common metric used by utilities to weigh the impact of electrification and demand side management measures. This provided a good representation of the average transmission and distribution cost impacts of additional loads from EVs.
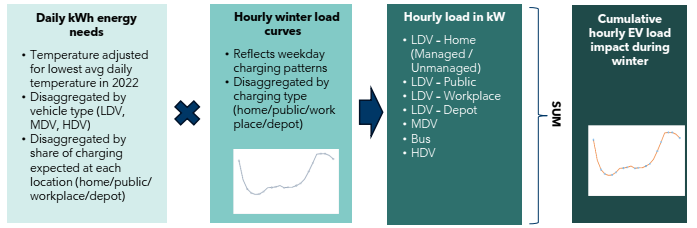
Figure 23. Methodology to Estimate Grid Impacts from ZEV
5.2 Results: Grid Impacts
Our analysis found the following:
- Residential charging is the main driver for overall non-coincident peak EV loads, peaking overnight and in the evenings, outside of the system peak. Workplace and public charging drives much of the demand during the middle of the day; this varies by province depending on the availability of home charging, as well as the mix of BEVs and PHEVs. We also see a small increase in residential charging load in the mornings (7-8 am), which is attributed to EV drivers using pre-heating functionality to warm up their car while connected to their charger. Unlike most EV charging (see below) this is a relatively fixed load that cannot easily be managed, and will need to be factored in by utilities that experience morning peaks.
- We see consistent growth in non-coincident peak hourly EV demand between 2025 and 2040, reaching levels between 8% and 15% of current generating capacity in each province. Based on EV adoption forecasts developed by Transport Canada, BC and Quebec could see a more gradual increase in peak demand, while provinces without ZEV sales regulations experience slower growth to 2030 and then an accelerated growth in order to meet the Federal regulated targets.Footnote 72
- There is a large degree of variation between provinces, depending on population size, vehicle stock, and climate. For example, EV charging could result in additional coincident winter peak loads of more than 10,400 MW in Ontario, 3,100 MW in Quebec, and 3,800 MW in Alberta in 2040. Other provinces will also see significant growth relative to current demand.
- EV charging is a flexible load, and offers significant opportunities to use load management to minimize peak impacts at both grid-level (through low overnight charging rates, demand response programs, etc.) and building-level (through EV Energy Management Systems). Our modeling, including the outputs cited above, assumes a static 50% participation rate of personal EVs in some form of load management program, which could potentially reduce peak residential EV demand by up to 48% during grid-wide peak period (e.g., 6-9 pm).Footnote 73 The actual performance of EV load management programs will depend heavily on a wide range of factors, including marketing efforts, financial incentive levels, and adoption of enabling technologies such as EV telematics and network-connected residential chargers. Well-designed utility programs with effective marketing and attractive financial incentives could drive higher participation levels. On the other hand, some fleets may have daily usage patterns that include long driving distances and that require maximizing the use of the full overnight charging window, leaving little room for participation in EV load management programs.
- At a province-wide level, the average coincident peak load impact per light-duty EV varies between 0.8 kW and 1.8 kW, with an average of 1.2 kW across Canada in 2040. This is significantly lower than the nameplate rating of typical charging equipment, due to the relatively low utilization of chargers and diverse usage patterns. These values vary regionally due to fleet mix and climate. It is important to note that these are system-wide averages; as one gets closer to the grid edge (e.g., feeders or transformers serving 10s to 1000s of homes) these loads can become less predictable with the potential for higher impacts in certain areas (such as neighbourhoods with a large number of EV drivers or areas with high levels of commercial and MHDV charging needs).
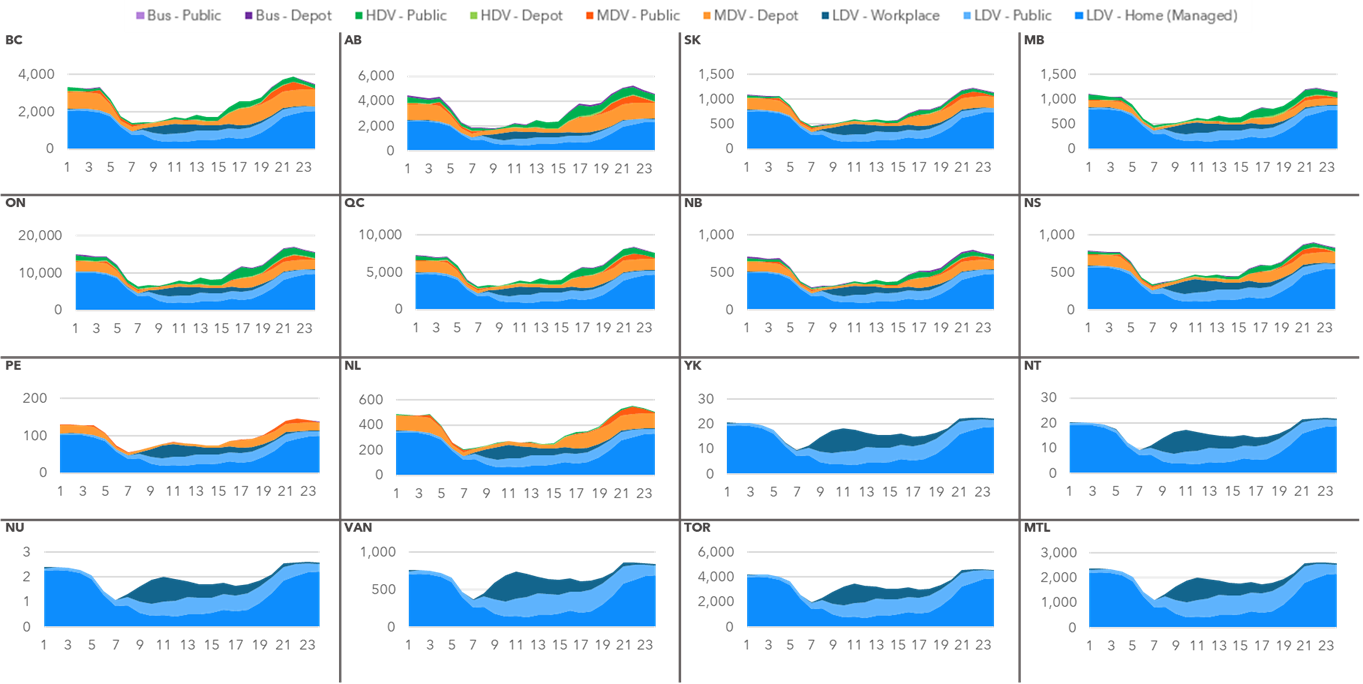
Figure 24. 2040 combined hourly load impacts for MHDV and LDV charging by region, under a managed charging scenario (in MW).
Note: These load curves consider EV charging demand in isolation from other loads (such as building heating), and do not represent a complete picture of the system-wide impacts of additional EV charging demand. Based on recent utility EV load forecasts and other studies, we expect that the share of EV charging that happens during system peaks for a given region will be between 31% and 74%, depending on the timing of other loads and implementation of EV load management programs.
5.3 Grid Upgrade Investments
Investments are needed to ensure Canada’s electricity grid has the capacity to supply future EVs in Canada. There are three primary components of the grid for which we have estimated future upgrade costs: generation, transmission and distribution. An overview of our key assumptions in modelling the cost associated with upgrades across each of these three components is outlined in Table 27. Each of these assumptions are expected to vary significantly on a regional basis. Given this, we have modelled high, medium and low cost scenarios.
| Variable | Description | Scenario Assumption | |||
|---|---|---|---|---|---|
| High | Med | Low | |||
| - | EV Coincidence Factor (%) | The share of EV charging that is expected to happen on peak and which will necessitate system capacity increases. This depends on the hourly profile of EV charging loads relative to a utility’s baseline load shape, as well as the expected level of participation in EV load management programs. Source: Dunsky analysis based on recent utility EV load forecasting projects |
74% | 53% | 31% |
| Dx | Marginal Cost of Distribution ($/kW) | The incremental cost to build out distribution capacity in response to peak load growth. Sources: E3. 2021. Distribution Grid Cost Impacts Driven by Transportation Electrification and Noah Rauschkolb et al. 2021. Estimating Electricity Distribution Costs Using Historical Data |
$320 | $250 | $160 |
| Secondary Distribution Costs (% of total Dx costs) | Accounts for end-of-line distribution infrastructure that supplies electrical service to customer. Represented as a share of total distribution costs.Footnote 74 Source: E3. 2021. Distribution Grid Cost Impacts Driven by Transportation Electrification |
22% | 37% | 51% | |
| Tx | Marginal Cost of Transmission ($/kW) | The incremental cost to build out transmission capacity in response to peak load growth. Source: Dunsky analysis of recent transmission projects |
$1,600 | $950 | $300 |
| Gen. | Marginal Cost of Generation ($/kW) | The incremental cost to build out generation capacity in response to peak load growth. We have the following as proxies for our high, medium and low cost scenarios, respectively: a 50/50 mix of small modular nuclear reactors and wind + 4 hr storage, wind + 4 hr battery storage, and combined cycle natural gas. Costs have been modelled to change over the study period and represent a Canada net-zero scenario. Source: Canada Energy Regulator. 2023. Canada’s Energy Futures 2023 |
$6,200-$7,400 | $2,900-$3,600 | $1,600-$1,700 |
Our approach to calculating grid upgrade costs is summarized in Figure 25.
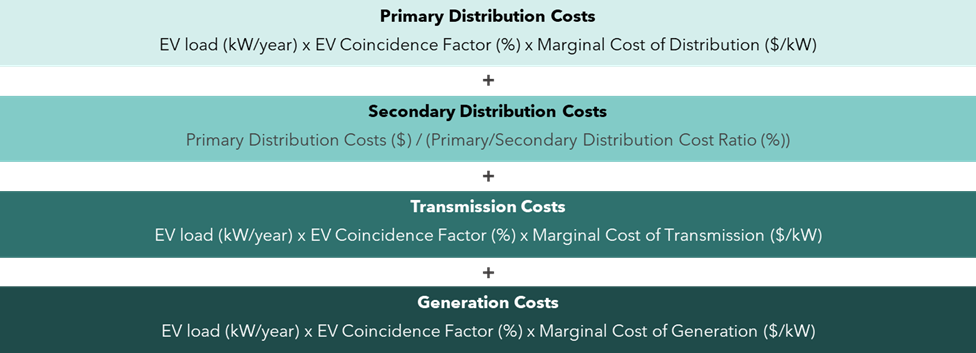
Figure 25. Grid upgrade cost assessment methodology
Text version
Primary Distribution Costs
EV load (kW/year) x EV Coincidence Factor (%) x Marginal Cost of Distribution ($/kW)
+
Secondary Distribution Costs
Primary Distribution Costs ($) / (Primary/Secondary Distribution Cost Ratio (%))
+
Transmission Costs
EV load (kW/year) x EV Coincidence Factor (%) x Marginal Cost of Transmission ($/kW)
+
Generation Costs
EV load (kW/year) x EV Coincidence Factor (%) x Marginal Cost of Generation ($/kW)
Using this methodology, the grid upgrades needed to support a growing number of EVs on Canada’s roads between 2025 and 2040 are estimated to cost $94.3 billion (see Figure 26). This estimate, however, could vary from $26.4 billion dollars under a low cost scenario, up to $294.2 billion under a high cost scenario (note that these costs are presented in real 2023 Canadian dollars and do not reflect any discounting). Canada-wide, we expect that a large share of grid upgrade costs (approximately three-quarters) will stem from upgrades to the generation system. However, the breakdown of these costs will vary from province to province, depending on the constraints that each utility faces in their region. For instance, transmission costs will vary significantly depending on the length of the transmission line as well as other factors such as local terrain and community opposition.
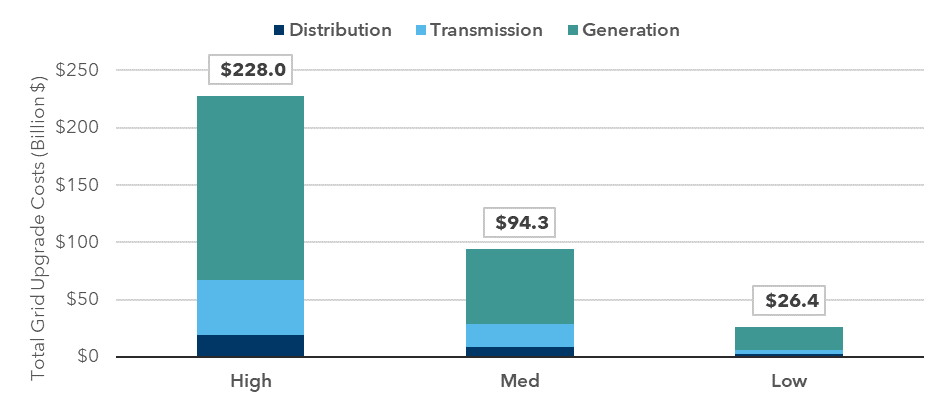
Figure 26. Cumulative grid upgrade cost estimates for 2025-2040 period (in real 2023 $CDN)
While the wide variation of cost estimates across these three scenarios emphasizes the uncertainty in undertaking this type of analysis at a national scale, other studies focused on specific regions can provide a point of comparison. Some recent studies have attempted to quantify distribution system upgrade costs attributable to load growth from EVs:
- A recent study conducted for the Alberta Utilities Commission estimated that the distribution system upgrades required to support a population of about 3.5 million EVs (across all vehicle segments) by 2050 would require between $1.7 billion and $2.4 billion of investment, or between $486 and $686 per vehicleFootnote 75. Compared with our Canada-wide distribution cost estimates and adjusting for a fleet of 23 million EVs in 2040, the AUC study’s results fall between our medium ($8.2 billion, $351 per vehicle) and high ($19.2 billion, $822 per vehicle) scenarios.
- Another recent study conducted for the California Public Utilities Commission estimated a cost of between $11 billion and $77 billion to prepare the distribution grid for electrification by 2035, including 15.5 million EVsFootnote 76. On a per vehicle basis, the lower end of this range ($697 per vehicle) falls between our medium and high scenarios, while the high end ($4,970 per vehicle) is roughly six times higher than our high-cost scenario, emphasizing the uncertainty in this type of analysis even with a more regional focus.
While these two studies both align more with the upper range of our scenarios, we attribute this at least partially to the fact that Alberta and California both currently have very limited electric heating demand. Distribution systems in many parts of Canada have been sized to accommodate residential building heating loads, such that incremental load from EVs does not represent as significant an increase.
It is also important to note that our estimates are not meant to reflect the entirety of grid investment required in the coming decades, but rather to estimate what portion of those investments would be attributable to EV load growth. The California study, for example, also considered building electrification loads, although EVs are the largest contributor to load growth. Utilities conducting detailed load forecasting and grid capacity assessments must consider other electrification loads, as well as the deployment of distributed energy resources such as rooftop solar, battery storage systems and flexible loads.
Given that EV adoption and the build out of charging infrastructure is not expected to happen uniformly over the period between 2025 and 2040, the annual grid investments needed will not be uniform. Figure 27 shows the annual investment in the grid needed to support each kW of incremental EV demand. Note that our analysis has been conducted over five-year increments, and so this figure represents average annual spend over each five-year period. In reality, we do not expect these investments to occur in the year that demand materializes; however, it is important to highlight that investments will need to ramp up over time. Annual Canada-wide grid investments in our medium cost scenario are expected to increase from approximately $0.8 billion in 2025 to $3.2 billion in 2030, to $8.0 billion in 2040. Across the 2025 to 2040 period, this equates to an average of $4.7 billion per year.
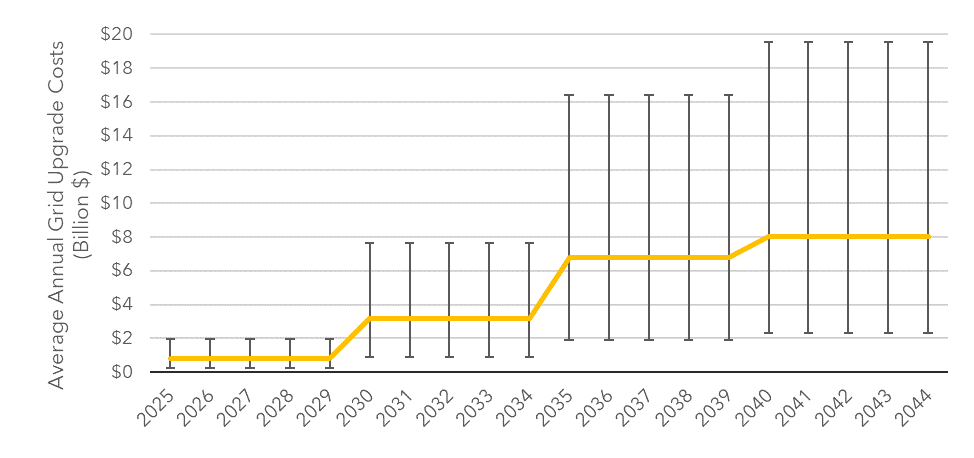
Figure 27. Average annual grid upgrade costs under a medium cost scenario (error bars represent high and low cost scenarios reported in real 2023 $CDN)
To put these costs into context, the cumulative grid upgrade costs from 2025 to 2040 in our medium scenario equates to about 16 months’ worth of gasoline spending by Canadian drivers (approximately $70 billion in 2022).Footnote 77 As drivers switch from ICE vehicles to EVs, this spending will shift to electricity, providing new revenue sources for utilities (and, in the case of Crown utilities, provincial governments), as well as consumer savings.
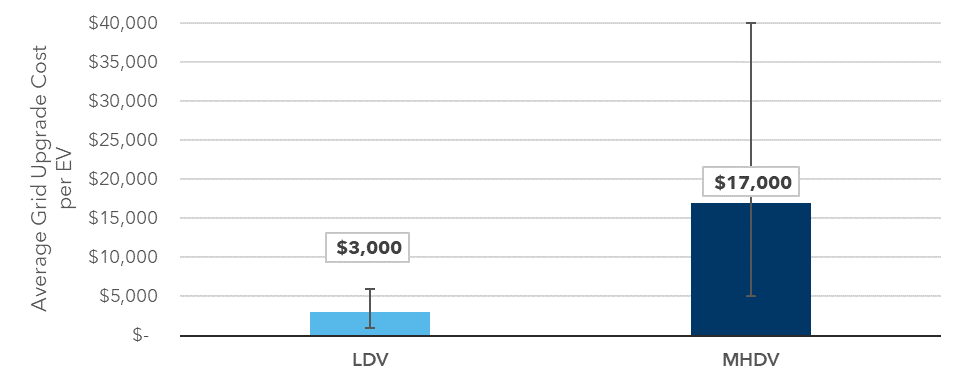
Figure 28. Average grid upgrade cost per EV under a medium cost scenario (error bars represent high and low cost scenarios reported in real 2023 $CDN)
Thinking about how grid upgrade costs average out on a per-EV basis is also a useful exercise in understanding to what extent grid upgrades will impact the total cost of EVs. Under a medium cost scenario, grid upgrades average out to approximately $3,000 per LDV and $17,000 per MHDV (Figure 28), with consideration for the share of future load that is expected to stem from LDVs and MHDVs, respectively. For LDVs, this is equivalent to approximately 5% of the total cost of ownership of an EV.Footnote 78
For the most part, EV owners are not expected to bear this full cost when purchasing an EV. Rather, this cost will likely be more broadly distributed across the utility rate base. However, instances where an increase in demand is clearly attributable to a single customer or group of customers, a portion of distribution upgrade costs may be passed down to those specific customers. This is more likely to be the case for commercial fleets that experience a surge in demand stemming from fleet depot charging. In extreme cases, the cost of distribution upgrades could be prohibitively expensive and may require consideration of alternate charging locations.
5.4 Grid Readiness—Key Takeaways
Assessing the grid readiness for EVs at the national scale is a highly complex topic. While the preceding sections provide a high-level estimate of the potential load growth and associated costs, we also collected valuable input through interviews with 14 electric utilities across Canada. By combining our quantitative analysis with insights from these utility interviews, we identified the following key takeaways regarding Canada’s grid readiness for EVs:
Utilities across Canada are already forecasting EV load growth and assessing grid readiness
Assessing grid readiness for EVs is a complex task that requires a detailed assessment of likely EV adoption in a given region and capacity assessment of individual components of the grid for each utility. While this study has attempted to broadly assess Canada’s grid readiness at the national scale, every one of the fourteen utilities we interviewed is actively developing load forecasts for their own capacity planning purposes, including forecasts of EV load growth. While the level of detail of utility EV load forecasts varied significantly, we heard consistently that the proposed ZEV sales regulation provided a valuable benchmark for utilities across the country on which to base their forecasts.Footnote 79
A number of utilities described using detailed forecasting approaches such as geographically granular EV load modeling, assessment of likely load on distribution system components (including individual substations and distribution feeders), assessment of the existing capacity of those components and their baseline load, and when those components will require upgrades due to forecasted load growth. This type of detailed analysis will paint a much more precise picture of the investments required to ensure grid readiness for EVs across Canada.
Load growth from EVs will require investments in generation, transmission and distribution capacity
While the impact of EV load growth will vary from utility to utility, in the long term, all utilities are likely to see a need for increased capacity across all levels of the grid:
- Generation capacity is expected to require significant investment in some Canadian provinces, especially those that are tackling the parallel challenge of decarbonizing electricity generation. However, utilities we interviewed highlighted a few renewable projects underway that will help to meet future demand. The cost of generation, however, will vary significantly by province depending on which resources will work in their specific context, and how costs and technology progress.
- Transmission challenges and costs will vary significantly across the country. While typically not seen as a near-term challenge, transmission constraints will become apparent as EV adoption grows, and the long timelines for transmission project development will require advanced planning. Some utilities pointed to the complexity of transmission capacity expansion in densely populated areas due to limited access to land. Other utilities pointed to terrain and long distances as major cost drivers, with mountainous terrain being more complex for transmission development than flatter parts of the country. The role of transmission is likely to evolve significantly in the coming decades. The ongoing development of DERs may lead to more electricity being generated closer to the point of consumption, minimizing the need for long transmission corridors. On the other hand, as grids across the country look to shift increasingly towards variable renewable sources of electricity, transmission interconnections across regions can accommodate fluctuations of variable resources in any one region. In all cases, regulatory challenges and long timelines for transmission projects will require careful planning.
- Distribution challenges will be centered around equipment upgrades (i.e., service connections, wire-sizing, secondary wires, substations, etc.) to prepare for future load growth. There is a higher risk of capacity constraints at individual transformers/feeders where there are multiple EVs in the area. The severity of constraints on the distribution system varies significantly across the country, especially as a function of electric space heating prevalence:
- Regions that rely primarily on electricity for building heating (e.g., Quebec, Newfoundland and Labrador) have the most robust distribution systems, with EVs representing a less significant incremental load. While this means that the distribution system will be especially taxed during cold winter days when EV loads are at their highest, these regions also have an opportunity to free up capacity on the distribution system through improvements in building energy efficiency.
- Regions that currently rely on fossil fuels for building heating (e.g., Ontario, the Prairies, the Territories) typically have less capacity on the distribution system, including feeders, transformers, and the secondary wires that connect to individual homes. In cases where those secondary wires are buried under ground (e.g., in many parts of Alberta), capacity upgrades can be a significant challenge, putting increased importance on leveraging load management approaches to optimize EV charging.
While contributing a relatively small portion of overall load growth, public charging can present significant challenges at the distribution level for specific sites, especially multi-port fast charging hubs. These challenges could potentially be exacerbated in a scenario with low access to home charging and increased reliance on public charging as a substitute, especially given the limited flexibility of public charging compared to overnight residential charging in terms of load management. Ultimately, the cost of delivering power to any given location can vary significantly, to the point that some charging locations are likely to be optimized as a function of available distribution capacity. Fast charging hubs may be especially challenging to support in northern and remote parts of the country (e.g. we interviewed one territory that has limited highway corridor charging sites to single 50 kW DCFC ports due to grid constraints). That said, the relatively low utilization expected in these types of locations may open up opportunities to leverage stationary battery storage systems such that higher power chargers can be supplied by a relatively limited grid connection.
Utilities across Canada confirmed that the constraints on the distribution system are the most likely near-term challenge, given the risk of clusters of early adopters and a less diverse load profile at the grid edge. At the same time, given the timelines required for large scale projects, it will be critical for utilities to anticipate needs for increased transmission and generation capacity well in advance.
Transportation electrification is only one of a number of factors that impact demand on the grid
Given the wide range of factors that will impact electricity demand in the coming decades, it can be challenging to determine how much future investment is attributable specifically to growth in demand from EVs. Even without considering changes in the ways Canadians use electricity, utilities are already continually planning for capacity upgrades across their networks in anticipation of population growth and increased economic activity. Growing communities and businesses require utilities to anticipate future demand and ensure adequate electrical capacity across the grid, which they have been doing successfully since the early 20th century.
In some regions, including the Prairies, building heating is predominantly provided by fossil fuels. Efforts to shift these buildings towards electric heating will lead to significant additional demand on the grid. In all regions, utilities and governments are encouraging technologies and practices that improve efficiency and minimize building heating demand, including improved building envelopes and air- or ground-source heat pumps.
Utilities are also anticipating growth in adoption of customer-sited solar generation and energy storage systems. These increasingly affordable technologies give utility customers the ability to offset their own demand, potentially even offsetting increased demand for EVs, especially if charging loads are synchronized with on-site generation.
Getting a complete picture of future electricity demand requires careful consideration of all these technologies. A number of utilities that we spoke with are actively planning for future capacity needs based on forecasts of EVs, building electrification, solar and storage adoption, and a range of demand-side management measures including both efficiency and demand response measures.
EV charging loads are potentially very flexible, and utilities across Canada are exploring load management approaches that can significantly reduce peak load impacts and associated grid upgrade costs
While the potential scale of EV charging loads is significant, many EV users have flexibility in terms of when they charge. Personal light-duty EVs in particular can shift the bulk of their charging needs to periods when the grid has excess capacity, thanks primarily to the fact that, while these vehicles typically have a range of 400 km or more, they are usually only driven about 40 km to 60 km per day. A typical residential or workplace Level 2 charger would be able to replenish one day’s worth of driving in less than 2 hours, while vehicles often remain parked for 8 hours a day at work and 12 hours or more at home overnight. Commercial fleets may also have an opportunity to shift their charging loads, although this flexibility will depend on their daily driving and charging needs.
In all cases, the realized benefits of EV charging load management will depend on the needs of each utility and the tools they employ, including time-varying electricity rates, or direct control of charging via onboard EV telematics or network-connected charging equipment. Many utilities are launching EV smart charging pilot programs; a few are also offering financial incentives for network-connected chargers that can enable smart charging. We also heard from several utilities across the country that are exploring and/or launching telematics-based smart charging pilot programs. Programs like these will enable utilities to assess when EV users charge their vehicles and the degree to which EV drivers are responsive to different forms of financial incentives to shift these charging behaviours. The potential for managed EV charging to cost-effectively reduce peak demand (and capacity investments) and provide flexibility and reliability benefits to the grid is significant, as studies in Canada and the U.S. have shown.Footnote 80
Optimal vehicle-grid integration can not only minimize the impact of EVs on the grid, but can potentially even deliver net benefits to utilities and ratepayers
While our analysis has primarily focused on the impact of additional load from EVs and opportunities to mitigate peak load impacts through EV load management, the inherent flexibility of EVs means that they can potentially be leveraged as distributed energy resources that can provide valuable services to the grid. A typical light-duty EV has a battery capacity that is 5 to 10 times greater than a typical residential battery storage system such as a Tesla Powerwall. Given that personal vehicles (and some fleet vehicles) spend a significant portion of the day parked, this presents a potential opportunity to leverage bi-directional charging technologies or Vehicle-to-Grid (V2G) to deliver power back to the grid when needed. Depending on the cost of the enabling technologies, V2G may prove to be a cost-effective measure for addressing a variety of grid services, including peak load management or voltage support services. While V2G capabilities are still mostly at a pilot stage, a number of studies have found that even uni-directional charging with load management is sufficient to turn EVs into a net benefit for the grid, with any incremental capacity costs more than offset by the additional revenue attributable to EV load growth.Footnote 81
Canada’s ZEV adoption targets are feasible and will help utilities to make necessary investments
While our cost estimates suggest that the scale of investment required to accommodate EV load growth over the coming decades is significant, the consensus we heard from utilities across the country is that Canada’s ZEV regulated sales targets are feasible. In fact, mandatory ZEV adoption targets (such as those already in place in B.C. and Quebec, and recently published by the Federal Government) give utilities a clear picture of the likely pace of transportation electrification, helping them prepare for the challenges of future EV load growth.
Already, we see that utilities are using the ZEV sales targets as part of their load forecasts, and the confidence in these forecasts is improved when utility staff can point to federal regulation requiring specific levels of EV market share over time. That said, some utilities told us they still see challenges in terms of their regulatory environment, with provincial utility regulators sometimes limiting their ability to make investments to prepare for future EV adoption, either through investments in capacity upgrades or in development of load management pilots and programs. The provincial governments in B.C. and Quebec have given clear direction to their utility regulators to enable utility investment in EV programs in support of provincial ZEV adoption targets. Similar direction in other jurisdictions could ensure that utilities are well positioned to anticipate EV demand well in advance and plan for capacity requirements accordingly.
Chapter six
6. Conclusion
Our study updates Dunsky’s 2021 EV charging infrastructure needs assessment with an expanded scope (to include medium- and heavy-duty vehicles, an exploration of regional trends and targets, and electricity grid impacts) and an updated methodology, based on emerging EV forecasting best practices. We explored the growth in ZEVs in all segments to 2040 and the charging infrastructure and electricity grid upgrades that will be needed to support this deployment, as well as related capital costs.
Our key findings are summarized below and in Table 28:
- Canada will see large growth in zero-emissions vehicles to meet national sales targets for LDVs (100% sales by 2035) and MHDVs (100% sales by 2040, where feasible). Zero-emissions LDVs (both battery and plug-in hybrid EVs) are forecast to grow from approximately 480,000 today to 5 million in 2030, reaching 21 million in 2040. For MHDVs, battery EVs are expected to dominate the market, with numbers reaching 414,000 in 2030 and 2.4 million by 2040.
- To support the deployment of millions of ZEVs, by 2030 Canada will need to install 235,000 L2 and DCFC public charging ports for LDVs, and an additional 41,000 public MHDV charging ports (overnight, fast and ultra-fast). By 2040 the number of public ports grows to 679,000 (LDV) and 275,000 (MHDV). About 4.3 million additional LDV ports are expected to be installed in homes and workplaces by 2030 as consumer uptake of EVs grows, alongside 1.1 million private MHDV ports in fleet depots and other locations. This equates to a ratio of 21 light-duty EVs per public port in 2030 and 31 EV/ ports in 2040. For MHDV, we expect a lower ratio of 8.6 EV per public port in 2040; in other words, public MHDV ports are expected to serve far fewer vehicles than LDV ports, due to differences in charging behaviours and power requirements.
- LDV and MHDV charging needs are primarily concentrated in four provinces: Ontario, Quebec, Alberta and B.C., which together account for 85% of total public chargers installed in 2040. Given that these provinces currently account for 92% of public chargers (almost entirely LDV), this implies that efforts will need to be diffused across the rest of Canada to ensure an equitable distribution of public charging, in particular for remote, rural and Northern regions. However, every region has significant work to grow public charging networks to meet the anticipated near- and long-term demand, and planning and deployment decisions should not be delayed.
- Significant capital investment is needed to meet the charging requirements for ZEVs over the coming decades. By 2030 an estimated $14.7 billion in cumulative capital investments will be required to meet LDV and MHDV public charging needs. Private charging infrastructure, in particular for commercial MHDV fleets, is likely to add billions of dollars to this total. In 2040, by which point 100% of vehicle sales are expected to be zero emission, the cumulative capital costs of public charging infrastructure will be nearly $65 billion. However, the timing of investments varies by vehicle type, with near-term investments more focused on LDV infrastructure, and post-2030 investments in MHDV charging becoming more dominant. While the federal government is not alone in its efforts to support infrastructure deployment, this will require considerable coordination among all stakeholders, including other levels of government, public agencies (e.g., the Canada Infrastructure Bank), electric utilities, and private sector actors including OEMs and charging providers.
- Public charging needs—and associated costs—will be influenced by a number of uncertainties. We modelled several different sensitivities to see how these impact LDV charging needs. The most significant impact is from a reduction in daily travel for private vehicles, which could reduce the need for public EV infrastructure by 25%. This finding suggests that a focus on complementary strategies to encourage drivers to avoid travel (e.g., remote working) and shift to other low-emitting modes (e.g., public transit, active transportation) could substantially reduce the need for public EV charging investments, while still supporting emissions reduction goals. An alternative scenario in which access to home charging is limited for residents of multifamily buildings leads to a 4% growth in public ports in 2030, and 17% growth in 2040 relative to the baseline scenario. Updated codes and standards, alongside incentives for EV-ready retrofits, will be essential to avoid this more costly outcome.
- Meeting the charging needs of zero-emissions LDV and MHDV will require upgrades to Canada’s electricity systems for which utilities and system operators must plan. By 2040, we expect the majority of LDV and MHDV on-road vehicles to be either plug-in hybrid or battery electric. This will add energy needs and peak load impacts to electricity systems that are also expected to largely decarbonize over the coming 10-15 years. For example, in 2030, charging all LDV and MHDV is expected to add up to 4,300 MW of coincident demand, growing to 22,500 MW by 2040. To meet this demand utilities will need to invest in additional generation, transmission and distribution capacity. Managing the timing of EV charging will be critical to mitigating the grid impacts and capacity costs; for example shifting home charging to off-peak periods can reduce peak loads by up to 48%, reducing the need for additional and costly peak generation resources. EV batteries will also represent significant storage capacity with potential to support higher integration of variable renewable energy sources.
- While our cost estimates suggest that the scale of investment required to accommodate EV load growth over the coming decades is significant, the consensus we heard from utilities across the country is that Canada’s ZEV regulated sales targets are feasible. In fact, mandatory ZEV adoption targets (such as those already in place in B.C. and Quebec, and recently published by the Federal Government) give utilities a clear picture of the likely pace of transportation electrification, helping them prepare for the challenges of future EV load growth.
| ZEV Category | Baseline | 2025 | 2030 | 2035 | 2040 | |
|---|---|---|---|---|---|---|
| Number of ZEVs | LDV | ~480,000 | 1.1M | 5.0M | 13.3M | 21.0M |
| MHDV | ~1,000 | 66,000 | 414,000 | 1.1M | 2.4M | |
| Total | 481,000 | 1.2M | 5.4M | 14.4M | 23.4M | |
| Public charging ports | LDV | ~26,000 | 100,520 | 234,440 | 446,760 | 678,610 |
| MHDV | ~300 | 8,091 | 40,960 | 120,094 | 274,992 | |
| Total | ~26,300Footnote 82 | 108,611 | 275,400 | 566,854 | 953,602 | |
| Public charging capital costs ($ Billion) | LDV | N/A | $2.8 | $7.4 | $12.8 | $17.7 |
| MHDV | N/A | $1.4 | $7.3 | $21.0 | $47.2 | |
| Total | N/A | $4.2 | $14.7 | $33.8 | $64.9 | |
| Peak grid impacts (MW) | LDV | N/A | 588 | 2,736 | 7,897 | 13,212 |
| MHDV | N/A | 255 | 1,577 | 4,306 | 9,334 | |
| Total | N/A | 843 | 4,313 | 12,204 | 22,546 |
APPENDICES
Appendix A. Literature Reviewed
| Title | Organization/Author | Year | Topic/Focus Area |
|---|---|---|---|
| Electric Vehicle Charging Infrastructure Assessment - AB 2127 | California Energy Commission | 2018 | Charging needs assessment |
| Too much or not enough? Planning electric vehicle charging infrastructure: A review of modeling options | Metais et al., Renewable and Sustainable Energy Reviews | 2022 | Charging needs assessment |
| An in-depth analysis of electric vehicle charging station infrastructure, policy implications, and future trends | Mastoi et al., Energy Reports | 2022 | Charging needs assessment |
| Assessing Charging Infrastructure Needs in Québec | ICCT | 2022 | Charging needs assessment - QC |
| Charging up America: Assessing the growing need for U.S. charging infrastructure through 2030 | ICCT | 2021 | Charging needs assessment - US |
| U.S. Passenger Vehicle Electrification Infrastructure Assessment - Results for Light-duty Vehicle Charging | Atlas Public Policy | 2021 | Charging needs assessment - US |
| Charging ahead: Electric-vehicle infrastructure demand | McKinsey Center for Future Mobility | 2018 | Charging needs assessment - US |
| National Plug-In Electric Vehicle Infrastructure Analysis | National Renewable Energy Laboratory (NREL) | 2023 | Charging needs assessment - US |
| Getting to 20 Million EVs by 2030 Opportunities for the Electricity Industry in Preparing for an EV Future | The Brattle Group | Charging needs assessment - US | |
| Optimizing Public Charging: An Integrated Approach Based on GIS and Multi-Criteria Decision Analysis |
World Electric Vehicle Journal | 2022 | Community Charging network planning - Germany municpality |
| A corridor-centric approach to planning electric vehicle charging infrastructure | Nie & Ghamami, Transportation Research Part B: Methodological | 2013 | Corridor charging |
| Regional Electric Vehicle Fast Charging Network Design Using Common Public Data |
World Electric Vehicle Journal | 2022 | Corridor charging - NS |
| An evidence-based approach for investment in rapid-charging infrastructure | Academic | 2017 | Cost considerations |
| European Green Deal: ambitious new law agreed to deploy sufficient alternative fuels infrastructure | European Commission | 2023 | Deployment targets for electric recharging and hydrogen refuelling infrastructure for the road sector |
| Enabling fast charging – Infrastructure and economic considerations | Burnham et al., Journal of Power Sources | 2017 | Economic considerations of extreme Fast charging stations |
| Fast-charging station for electric vehicles, challenges and issues: A comprehensive review | Shafiei, Ghasemi-Marzbali, Journal of Energy Storage | 2022 | Fast charging station considerations |
| Electric Highways: Accelerating and Optimizing Fast-Charging Deployment for Carbon-Free Transportation |
National Grid | 2022 | Fast-Charging Deployment |
| Optimizing Public Charging: An Integrated Approach Based on GIS and Multi-Criteria Decision Analysis | World Electric Vehicle Journal | 2022 | Grid impacts |
| DER Potential Study | IESO | 2022 | Grid impacts |
| A comprehensive review on electric vehicles smart charging: Solutions, strategies, technologies, and challenges | Sadeghian et al., Journal of Energy | 2022 | Managed charging considerations |
| U.S. Medium- and Heavy-Duty Truck Electrification Infrastructure Assessment | Atlas Public Policy | 2021 | MHDV charging needs assessment method and results |
| Near-Term Infrastructure Deployment to Support Zero-Emission Medium- and Heavy-Duty Vehicles in The United States | ICCT | 2023 | MHDV charging needs assessment method and results |
| West Coast Clean Transit Corridor Initiative Interstate 5 Corridor California, Oregon, Washington |
WWCTI | 2020 | MHDV Corridor charging |
| Preventing Electric Truck Gridlock | Rocky Mountain Institute | 2023 | MHDV electric |
| Battery Pack Prospects for Long-Haul Transport Trucks Considering Electrified Highways and Megawatt Charging | EVS35—International Electric Vehicle Symposium and Exhibition | 2023 | MHDV ultra-fast charging considerations |
| Transportation Energy Demand Forecast, 2018-2030 - Staff Report, update in 2022 | California Energy Commission | 2017 (2022) | Transportation Energy Demand |
| Sample of US NEVI plans | Various | Various | Other |
| Layout Evaluation of New Energy Vehicle Charging Stations: A Perspective Using the Complex Network Robustness Theory | Zhang et al., World Electric Vehicle Journal | 2022 | Other |
| Optimizing Public Charging: An Integrated Approach Based on GIS and Multi-Criteria Decision Analysis | Khalife, Fay & Gohlich, World Electric Vehicle Journal | 2022 | Other |
| Observational Evaluation of the Maximum Practical Utilization of Electric Vehicle DCFC Infrastructure | Pearre & Swan, World Electric Vehicle Journal | 2022 | Other |
| Regional Electric Vehicle Fast Charging Network Design Using Common Public Data | Pearre et al., World Electric Vehicle Journal | 2022 | Other |
Appendix B. Supplemental Information on LDV Charging Needs
Technical Assumptions
| Type of charging | 2025 | 2030 | 2035 | 2040 | 2045 | 2050 |
|---|---|---|---|---|---|---|
| Public - DCFC | 188 | 233 | 300 | 343 | 400 | 400 |
| Public - DCFC - commercial | 263 | 300 | 420 | 457 | 457 | 457 |
| Workplace | 7.2 | 10 | 12 | 12 | 12 | 12 |
| Public - L2 | 7.2 | 10 | 12 | 12 | 12 | 12 |
| Home - L1 | 1.5 | 1.5 | 1.5 | 1.5 | 1.5 | 1.5 |
| Home - L2 | 7.2 | 10 | 12 | 12 | 12 | 12 |
| Type of charging | 2025 | 2030 | 2035 | 2040 | 2045 | 2050 |
|---|---|---|---|---|---|---|
| Public - DCFC | 6.5% | 8.0% | 10.0% | 11.0% | 12.0% | 12.0% |
| Public - L2 | 15.0% | 20.0% | 20.0% | 20.0% | 20.0% | 20.0% |
| Workplace | 15.0% | 20.0% | 20.0% | 20.0% | 20.0% | 20.0% |
| Public - DCFC - commercial | 15.0% | 20.0% | 20.0% | 20.0% | 20.0% | 20.0% |
| Reliability factor | 2025 | 2030 | 2035 | 2040 | 2045 | 2050 |
|---|---|---|---|---|---|---|
| Factor | 97% | 98% | 98% | 98% | 98% | 98% |
Residential Charging
Table 33 shows our assumptions for residential charging access, based on the share of each type of housing with access to parking. CMAs have lower levels of parking access due to their higher average levels of density compared to the rest of the country.
| Private Dwelling Type | Category | Building Code | % of Cdn dwellings | Assumed % with parking (provinces) | Assumed % with parking (CMAs) |
|---|---|---|---|---|---|
| Single-detached house | Single | Part 9 | 53% | 95% | 85% |
| Semi-detached house | Single | Part 9 | 5% | 95% | 85% |
| Row house | Multi | Part 9 | 7% | 85% | 80% |
| Apartment or flat in a duplex | Single | Part 9 | 6% | 75% | 50% |
| Apartment in a building that has fewer than five storeys | Multi | Part 9 (<3 stories) & Part 3 (3+ stories) | 18% | 95% | 85% |
| Apartment in a building that has five or more storeys | Multi | Part 3 | 11% | 95% | 85% |
| Other single-attached house | Single | n/a | 0% | 95% | 85% |
Corridor Analysis
Table 34. All secondary highways and their segment lengths considered in the corridor analysis.
Regions
| Road Name | Length of Considered Segment (km) |
|---|---|
| 1 | 1.4 |
| 2 | 179 |
| 3 | 0.1 |
| 5 | 5.1 |
| 6 | 33 |
| 9 | 0.9 |
| 10 | 4.7 |
| 11 | 29 |
| 12 | 95 |
| 13 | 163 |
| 14 | 90 |
| 17 | 85 |
| 20 | 27 |
| 21 | 70 |
| 22 | 132 |
| 23 | 2.9 |
| 24 | 39 |
| 26 | 22 |
| 27 | 4.6 |
| 29 | 1.7 |
| 32 | 52 |
| 33 | 60 |
| 36 | 244 |
| 39 | 11 |
| 40 | 278 |
| 41 | 304 |
| 42 | 24 |
| 44 | 71 |
| 45 | 74 |
| 47 | 41 |
| 48 | 2.0 |
| 49 | 118 |
| 50 | 10 |
| 51 | 3.5 |
| 53 | 64 |
| 54 | 1.0 |
| 55 | 74 |
| 56 | 70 |
| 59 | 39 |
| 61 | 97 |
| 62 | 7.7 |
| 63 | 69 |
| 66 | 27 |
| 88 | 350 |
| 93 | 91 |
| 100 | 0.9 |
| 532 | 26 |
| 541 | 10 |
| 570 | 12 |
| 615 | 14 |
| 879 | 0.6 |
| 885 | 0.1 |
| 13A | 2.2 |
| 2a | 14 |
| 44a | 0.4 |
| 93a | 13 |
| Condon | 0.4 |
| David Thompson | 138 |
| Icefields | 101 |
| Main | 0.7 |
| Mount View | 0.5 |
| Railway | 1.1 |
| Range Road 114A | 2.7 |
| Range Road 134 | 17 |
| Range Road 134A | 1.9 |
| Range Road 135 | 9.2 |
| Range Road 135A | 3.0 |
| Range Road 140 | 28 |
| Range Road 142 | 3.4 |
| Range Road 14A | 3.4 |
| Range Road 15A | 2.1 |
| Range Road 212A | 0.1 |
| Range Road 213A | 0.6 |
| Range Road 213B | 0.7 |
| Range Road 215 | 4.1 |
| Range Road 215A | 2.6 |
| Range Road 21A | 0.6 |
| Range Road 220A | 2.6 |
| Range Road 221A | 2.5 |
| Range Road 222A | 3.7 |
| Range Road 22A | 9.3 |
| Range Road 23 | 0.0 |
| Range Road 234A | 0.2 |
| Range Road 242A | 2.7 |
| Range Road 244A | 5.5 |
| Range Road 244B | 0.8 |
| Range Road 245 | 0.5 |
| Range Road 245A | 9.1 |
| Range Road 245B | 1.1 |
| Range Road 253A | 0.3 |
| Range Road 254A | 0.7 |
| Range Road 285A | 1.2 |
| Range Road 292A | 3.2 |
| Range Road 293A | 2.6 |
| Range Road 294A | 2.0 |
| Range Road 295 | 0.7 |
| Range Road 295A | 3.6 |
| Range Road 300B | 1.2 |
| Range Road 301A | 2.2 |
| Range Road 31A | 1.5 |
| Range Road 31B | 1.1 |
| Range Road 34A | 4.9 |
| Range Road 35A | 14 |
| Range Road 40A | 20 |
| Range Road 41A | 5.7 |
| Range Road 42A | 5.7 |
| Range Road 43 | 29 |
| Range Road 43A | 3.0 |
| Range Road 44A | 0.2 |
| Range Road 44B | 1.4 |
| Range Road 51A | 1.0 |
| Range Road 52A | 0.7 |
| Range Road 60A | 0.3 |
| Range Road 61A | 3.3 |
| Range Road 62 | 6.7 |
| Range Road 62A | 4.3 |
| Range Road 62B | 1.8 |
| Range Road 63 | 3.7 |
| Range Road 63A | 2.8 |
| Range Road 64A | 2.8 |
| Range Road 65 | 16 |
| Range Road 65A | 6.0 |
| Range Road 70 | 13 |
| Range Road 70A | 0.9 |
| Range Road 74A | 0.8 |
| Range Road 75A | 2.9 |
| River | 0.1 |
| Township Road 100a | 0.4 |
| Township Road 101A | 2.8 |
| Township Road 115A | 0.8 |
| Township Road 13A | 0.7 |
| Township Road 14A | 3.5 |
| Township Road 165A | 3.1 |
| Township Road 170A | 1.4 |
| Township Road 182A | 7.3 |
| Township Road 21A | 2.5 |
| Township Road 21B | 2.7 |
| Township Road 23A | 3.2 |
| Township Road 334 | 6.1 |
| Township Road 334A | 0.6 |
| Township Road 341A | 3.6 |
| Township Road 343A | 6.3 |
| Township Road 344A | 1.7 |
| Township Road 345A | 0.9 |
| Township Road 350A | 5.0 |
| Township Road 350B | 1.6 |
| Township Road 351A | 9.0 |
| Township Road 352 | 28 |
| Township Road 352A | 13 |
| Township Road 353A | 4.3 |
| Township Road 354A | 2.0 |
| Township Road 370A | 2.6 |
| Township Road 371A | 3.1 |
| Township Road 400B | 0.1 |
| Township Road 460A | 2.9 |
| Township Road 470 | 13 |
| Township Road 472A | 2.9 |
| Township Road 473A | 12 |
| Township Road 474A | 4.1 |
| Township Road 475A | 3.6 |
| Township Road 484A | 2.8 |
| Township Road 485A | 0.4 |
| Township Road 493A | 0.2 |
| Township Road 62 | 9.7 |
| Township Road 70 | 6.8 |
| Township Road 775A | 0.0 |
| Township Road 780 | 37 |
| Township Road 780A | 8.9 |
| Township Road 780B | 1.2 |
| Township Road 781A | 2.3 |
| Township Road 844A | 17 |
| Township Road 845A | 9.5 |
| Township Road 850A | 6.1 |
| Township Road 851A | 9.6 |
| Township Road 852 | 41 |
| Township Road 371A | 0.1 |
| Township Road 400B | 1.4 |
| Township Road 460A | 179 |
| Township Road 470 | 0.1 |
| Township Road 472A | 5.1 |
| Township Road 473A | 33 |
| Township Road 474A | 0.9 |
| Township Road 475A | 4.7 |
| Township Road 484A | 29 |
| Township Road 485A | 95 |
| Township Road 493A | 163 |
| Township Road 62 | 90 |
| Township Road 70 | 85 |
| Township Road 775A | 27 |
| Township Road 780 | 70 |
| Township Road 780A | 132 |
| Township Road 780B | 2.9 |
| Township Road 781A | 39 |
| Township Road 844A | 22 |
| Township Road 845A | 4.6 |
| Township Road 850A | 1.7 |
| Township Road 851A | 52 |
| Township Road 852 | 60 |
| Unknown Name | 244 |
| Alberta Total: | 4101 |
| Road Name | Length of Considered Segment (km) |
|---|---|
| 4 | 0.02 |
| 6 | 118 |
| 8 | 15 |
| 10 | 0.1 |
| 20 | 401 |
| 23 | 40 |
| 24 | 53 |
| 29 | 75 |
| 52 | 116 |
| 77 | 0.7 |
| 93 | 51 |
| 95 | 50 |
| 97 | 22 |
| 3A | 56 |
| 5a | 41 |
| 93 Mile-Little Fort Highway No. 24 | 1.9 |
| 93+95 | 33 |
| Atlin | 51 |
| Beattie | 6.5 |
| Bentinck | 0.6 |
| Bridge Lake Business | 2.0 |
| Canal Flats | 0.1 |
| Canal Flats Frontage | 0.1 |
| Canyon | 0.8 |
| Hudson Hope | 13 |
| Kamloops Vernon | 18 |
| Kamloops-Merritt No. 5A | 13 |
| Kootenay | 0.1 |
| Labouchere | 0.3 |
| Lake | 0.9 |
| Liard | 119 |
| Little Fort Hwy 24 | 1.0 |
| MacKenzie | 33 |
| Merritt-Kamloops | 1.2 |
| Merritt-Spences Bridge 8 | 0.2 |
| Merritt-Spences Bridge Highway No. 8 | 0.1 |
| Pacific Rim | 13 |
| Rosebery Loop | 0.4 |
| Union | 1.2 |
| British Columbia Total: | 1,349 |
| Road Name | Length of Considered Segment (km) |
|---|---|
| 2 | 139 |
| 3 | 96 |
| 5 | 159 |
| 10 | 182 |
| 18 | 8.5 |
| 20 | 108 |
| 21 | 64 |
| 23 | 66 |
| 24 | 64 |
| 25 | 9.3 |
| 34 | 73 |
| 41 | 30 |
| 45 | 52 |
| 50 | 93 |
| 68 | 68 |
| 77 | 41 |
| 83 | 116 |
| 325 | 40 |
| 391 | 124 |
| 10a | 1.7 |
| 1st | 1.9 |
| 2+242 | 3.4 |
| 2+340 | 3.3 |
| 25+250 | 1.7 |
| 3+21 | 0.4 |
| 3+242 | 0.6 |
| 3+34 | 19 |
| 3+83 | 12 |
| 34+245 | 4.8 |
| 3A | 11 |
| 5+265 | 1.8 |
| Chenier | 0.1 |
| Elizabeth | 1.1 |
| First | 3.0 |
| Kinosota | 14 |
| Kirkwood Road 17 | 8.3 |
| Main | 5.5 |
| Miniota | 0.6 |
| Mooswa | 0.9 |
| Pine | 2.3 |
| Provincial Trunk 11 | 34 |
| Provincial Trunk 12 | 89 |
| Provincial Trunk 12+59 | 13 |
| Provincial Trunk 13 | 0.2 |
| Provincial Trunk 15 | 2.1 |
| Provincial Trunk 17 | 19 |
| Provincial Trunk 2 | 2.7 |
| Provincial Trunk 3 | 12 |
| Provincial Trunk 44 | 24 |
| Provincial Trunk 59 | 21 |
| Provincial Trunk 68 | 56 |
| Provincial Trunk 8 | 26 |
| Provincial Trunk 89 | 10.0 |
| Railway | 0.8 |
| Road 15 | 0.4 |
| Road 44 | 9.9 |
| Winnora | 0.3 |
| Unknown Name | 8.9 |
| Manitoba Total: | 1,959 |
| Road Name | Length of Considered Segment (km) |
|---|---|
| Bridge | 2.3 |
| Harvey | 3.6 |
| Main | 3.3 |
| Pleasant | 7.9 |
| Route 10 | 49 |
| Route 3 | 57 |
| Route 4 | 21 |
| Saunders | 1.4 |
| Vanceboro | 1.9 |
| New Brunswick Total: | 148 |
| Road Name | Length of Considered Segment (km) |
|---|---|
| 210 | 90 |
| 230 | 29 |
| 320 | 32 |
| 330 | 119 |
| 340 | 33 |
| 360 | 175 |
| 410 | 63 |
| 430 | 48 |
| 480 | 53 |
| Burgeo | 29 |
| Canada | 4.4 |
| Centennial | 4.8 |
| Discovery | 13 |
| Dorset | 7.3 |
| J.W. Pickersgill | 3.0 |
| Lewis | 0.8 |
| Lighthouse | 1.5 |
| Main | 31 |
| Reach | 12 |
| Road To The Isles | 19 |
| South Side | 1.4 |
| To The Isles | 9.1 |
| Toulinquet | 2.0 |
| Newfoundland and Labrador Total: | 782 |
| Road Name | Length of Considered Segment (km) |
|---|---|
| 5 | 163 |
| 6 | 134 |
| Liard | 236 |
| Northwest Territories Total: | 533 |
| Road Name | Length of Considered Segment (km) |
|---|---|
| 2 | 76 |
| 4 | 2.9 |
| 6 | 99 |
| 7 | 178 |
| 8 | 71 |
| 10 | 52 |
| 12 | 8.7 |
| 14 | 35 |
| 16 | 61 |
| 19 | 11 |
| Cabot Trail | 174 |
| Church | 0.2 |
| Durham | 1.9 |
| Eastern | 1.6 |
| Hadley | 0.2 |
| Highway 12 | 20 |
| Highway 14 | 5.4 |
| Hogg | 0.1 |
| Lakeview | 0.1 |
| Loop Highway 2 | 0.6 |
| Main | 6.3 |
| New | 0.1 |
| Old Loop of Highway 2 | 0.3 |
| Pool | 0.2 |
| Prince | 0.4 |
| Sprott | 0.1 |
| Unknown Name | 0.2 |
| Nova Scotia Total: | 807 |
| Road Name | Length of Considered Segment (km) |
|---|---|
| 6 | 42 |
| 11 | 33 |
| 15 | 24 |
| 28 | 119 |
| 35 | 23 |
| 38 | 27 |
| 41 | 64 |
| 60 | 97 |
| 62 | 74 |
| 63 | 3.9 |
| 64 | 44 |
| 65 | 61 |
| 66 | 23 |
| 72 | 15 |
| 101 | 243 |
| 105 | 115 |
| 117 | 27 |
| 118 | 29 |
| 124 | 37 |
| 127 | 35 |
| 129 | 155 |
| 141 | 14 |
| 502 | 111 |
| 511 | 25 |
| 522 | 73 |
| 527 | 210 |
| 532 | 10 |
| 540 | 15 |
| 551 | 0.0 |
| 556 | 7.3 |
| 584 | 48 |
| 596 | 17 |
| 599 | 273 |
| 620 | 0.0 |
| 622 | 71 |
| 631 | 132 |
| 637 | 41 |
| 655 | 38 |
| 658 | 13 |
| Aspdin | 13 |
| Atwood | 2.8 |
| Becker | 0.5 |
| Bridge | 1.1 |
| Brunel | 0.8 |
| Burleigh | 1.7 |
| Calabogie | 3.9 |
| Cane 5 | 2.5 |
| Cardwell | 0.2 |
| Center | 0.4 |
| Church | 1.0 |
| Concession | 0.6 |
| County 40 | 2.8 |
| County 41 | 14 |
| County 46 | 23 |
| County 504 | 24 |
| County 6 | 17 |
| County 620 | 20 |
| County Road 42 | 8.7 |
| Dog Lake | 1.2 |
| Drummond | 1.1 |
| Fire Route 90 | 6.2 |
| First | 0.9 |
| Front | 0.6 |
| Grey 4 | 2.0 |
| Hastings | 4.7 |
| Highway 527 | 7.9 |
| Joseph | 1.8 |
| King | 0.9 |
| Lanark | 13 |
| Leslie | 0.3 |
| Limberlost | 15 |
| Loop | 9.9 |
| Main | 0.6 |
| Maple | 0.1 |
| Medora | 2.0 |
| Mill | 2.1 |
| Monck | 7.1 |
| Muskoka 118 | 7.8 |
| Muskoka 169 | 7.1 |
| Nord | 1.1 |
| Notre Dame | 1.0 |
| Orde | 4.4 |
| Perth | 5.0 |
| Rideau | 0.3 |
| Sherbourne | 0.4 |
| Snake Bay | 44 |
| South Portage | 5.0 |
| St. David | 1.6 |
| Talbot | 11 |
| Water | 0.4 |
| Windermere | 0.2 |
| Wolf Grove | 0.9 |
| Unknown Name | 2.8 |
| Ontario Total: | 2,699 |
| Road Name | Length of Considered Segment (km) |
|---|---|
| Commercial - RTE 4 | 0.6 |
| Prince Edward Island Total: | 0.6 |
| Road Name | Length of Considered Segment (km) |
|---|---|
| 101 | 43 |
| 105 | 39 |
| 111 | 18 |
| 113 | 149 |
| 132 | 47 |
| 138 | 103 |
| 139 | 9.8 |
| 167 | 138 |
| 169 | 39 |
| 170 | 50 |
| 172 | 56 |
| 198 | 93 |
| 199 | 1.7 |
| 204 | 39 |
| 212 | 22 |
| 214 | 12 |
| 232 | 27 |
| 234 | 13 |
| 237 | 8.2 |
| 269 | 8.9 |
| 283 | 0.7 |
| 289 | 25 |
| 293 | 8.3 |
| 295 | 1.1 |
| 299 | 32 |
| 301 | 25 |
| 307 | 16 |
| 309 | 74 |
| 315 | 9.3 |
| 317 | 0.5 |
| 321 | 3.9 |
| 323 | 22 |
| 327 | 17 |
| 381 | 76 |
| 388 | 8.2 |
| 1re | 13 |
| 2e | 6.5 |
| 4e rang de Fleuriau | 0.8 |
| Academy | 0.2 |
| Albert-Ferland | 2.2 |
| Amherst | 0.7 |
| Beaulieu | 2.0 |
| Bellevue | 10 |
| Boileau | 0.5 |
| Bolton Pass | 6.0 |
| Boucher | 0.7 |
| Bunker | 0.1 |
| Côté | 0.8 |
| Claude-Dagenais | 1.1 |
| Conrad-Schmidt | 0.5 |
| Craig | 14 |
| de Dunham | 3.0 |
| de la Frontière | 5.4 |
| de la Vallée | 5.7 |
| de l'Église | 0.9 |
| de Mansonville | 18 |
| de Tadoussac | 20 |
| d'en Haut | 1.3 |
| des Érables | 0.8 |
| des Pins | 1.3 |
| des Pionniers | 3.8 |
| des Voyageurs | 9.5 |
| d'Hébertville | 8.3 |
| Double | 5.8 |
| du Calvaire | 1.5 |
| du Lac | 1.3 |
| du Lac-Grosleau | 6.4 |
| du Lac-Rond | 8.9 |
| du Moulin | 24 |
| du Parc de la Gaspésie | 29 |
| du Parc-des-Grands-Jardins | 0.1 |
| du Pont | 0.4 |
| du Pré | 0.8 |
| du Roi | 2.3 |
| du Sud-du-Lac | 5.8 |
| du Tour-du-Lac | 2.8 |
| du Village | 1.6 |
| Dumas | 2.7 |
| Elgin | 6.6 |
| Grande Ligne | 14 |
| Jacques-Cartier | 181 |
| Missisquoi | 1.0 |
| Morrison | 3.3 |
| Notre-Dame | 2.2 |
| Perron | 7.9 |
| Pleasant | 0.8 |
| Principal | 15 |
| Principale | 213 |
| Prudent-Cloutier | 7.8 |
| Rideau | 23 |
| Saguenay | 11 |
| Saint-François-Xavier | 13 |
| Saint-Jean | 1.9 |
| Saint-Joseph | 14 |
| Taché | 16 |
| Tanguay | 0.7 |
| Tassé | 0.5 |
| Thériault | 0.6 |
| Tremblay | 1.3 |
| Valley | 3.1 |
| William | 6.3 |
| Quebec Total: | 2,010 |
| Road Name | Length of Considered Segment (km) |
|---|---|
| 1 | 3.9 |
| 2 | 241 |
| 3 | 249 |
| 4 | 379 |
| 5 | 104 |
| 6 | 262 |
| 8 | 139 |
| 9 | 199 |
| 10 | 21 |
| 12 | 53 |
| 13 | 346 |
| 14 | 31 |
| 15 | 177 |
| 17 | 6.8 |
| 18 | 482 |
| 19 | 188 |
| 20 | 69 |
| 21 | 485 |
| 22 | 102 |
| 23 | 89 |
| 24 | 54 |
| 26 | 148 |
| 27 | 38 |
| 28 | 58 |
| 30 | 41 |
| 31 | 118 |
| 32 | 124 |
| 33 | 113 |
| 34 | 62 |
| 35 | 246 |
| 36 | 108 |
| 37 | 81 |
| 38 | 51 |
| 39 | 18 |
| 40 | 147 |
| 41 | 85 |
| 42 | 154 |
| 43 | 107 |
| 44 | 195 |
| 45 | 27 |
| 47 | 146 |
| 48 | 178 |
| 49 | 86 |
| 51 | 113 |
| 52 | 47 |
| 55 | 399 |
| 58 | 107 |
| 80 | 9.4 |
| 120 | 17 |
| 358 | 1.6 |
| 363 | 4.9 |
| 600 | 0.6 |
| 606 | 0.0 |
| 15+20 | 9.7 |
| 19+42 | 6.5 |
| 1st | 5.4 |
| 21+31 | 15 |
| 21+40 | 10 |
| 2nd | 3.6 |
| 3+21 | 10 |
| 3+26 | 24 |
| 3rd | 1.5 |
| 4+44 | 3.2 |
| 44+21 | 17 |
| 48+617 | 2.9 |
| 9+48 | 9.6 |
| Allowance | 0.8 |
| Anderson | 1.0 |
| Arpad | 3.6 |
| B | 1.4 |
| Bloor | 0.9 |
| Cypress | 0.6 |
| Dominion | 0.2 |
| East Road Allowance | 0.8 |
| Essex | 1.0 |
| First | 2.7 |
| Government | 2.4 |
| Hanson Lake | 2.7 |
| Highway | 2.8 |
| Jubilee | 1.6 |
| Kaufman | 1.6 |
| King | 0.5 |
| Magnan | 0.8 |
| Main | 4.5 |
| McIntosh | 0.5 |
| Nash | 1.2 |
| Pacific | 3.5 |
| Peck Lake | 0.0 |
| Pine | 1.6 |
| Poplar | 1.4 |
| Prairie | 1.0 |
| Provincial Road 3243 | 5.9 |
| Queen | 0.7 |
| Railway | 41 |
| Red Coat | 0.6 |
| River | 0.6 |
| Township Road 554 | 1.6 |
| Victoria | 1.4 |
| Weckman | 1.4 |
| Unknown Name | 17 |
| Saskatchewan Total: | 6,935 |
| Road Name | Length of Considered Segment (km) |
|---|---|
| Atlin | 25 |
| Haines | 84 |
| Robert Campbell | 150 |
| Silver | 34 |
| Tagish | 9.1 |
| Top of the World | 62 |
| Yukon Total: | 364 |
Taxi and Ridehailing Fleet Size
| Region | Active daily taxis | Active daily ride hailing vehicles |
|---|---|---|
| Alberta | 1,789 | 4,036 |
| British Columbia | 3,906 | 8,815 |
| Manitoba | 822 | 1,855 |
| New Brunswick | 55 | - |
| Newfoundland and Labrador | 258 | - |
| Northwest Territories | - | - |
| Nova Scotia | 362 | 817 |
| Nunavut | - | - |
| Ontario | 8,118 | 18,321 |
| Prince Edward Island | 35 | 78 |
| Quebec | 7,234 | 9,795 |
| Saskatchewan | 383 | 865 |
| Yukon | - | - |
| Total | 22,962 | 44,583 |
| Vancouver CMA | 1,344 | 5,532 |
| Toronto CMA | 4,195 | 10,500 |
| Montreal CMA | 5,051 | 6,840 |
Comparison of assumptions between this study and previous Dunsky charging needs assessment
| Assumption | This study (2024) | 2021 Dunsky study |
|---|---|---|
| Home charging access scenarios | High-access scenario:
Low-access scenario:
Assumed lower home charging access for MFUs in 2025. |
High-access scenario:
Low-access scenario:
|
| EV adoption forecasts – LDV | Higher, based on Transport Canada forecast and provincial adjustments for BC and QC: 13.3 million EVs on the road in 2035 | Lower, based on TC forecast: 12.4 million in 2035 (15% by 2025, 60% by 2030, 100% by 2035) |
| BEV/PHEV share | Higher BEV share (83% BEV in 2035) | Lower BEV share (77% BEV in 2035) |
| Port charging power | Lower average effective charging power for 2025-2035 (125-250 kW). The studies use the same assumption for new installed charging levels, but this study incorporates the existing infrastructure more accurately to get the average effective power in the near term. | Higher average effective charging power for 2025-2035 (150-300 kW) |
| Charger utilization rate | Varies between 10-20% in 2035, depending on type / location of charging | Using a methodology based on EV-to-charger ratios that factored in utilization. |
| DCFC charging and coverage | 2-port minimum for all DCFC sites | 2-port minimum for all DCFC sites; assumed 22 sites per 1,000 km2 in population clusters >100,000 residents |
| Highway corridor coverage and spacing | Used National Highway System and provincially significant highways to expand coverage; 65km site spacing assumed on all highway types | Used National Highway System covering 38,000km; and a 65km spacing between sites |
| Rural and remote communities | Additional DCFC sites for population clusters >1,000 residents further than 32.5km from NHS | Not included separately |
| EV infrastructure costs | 2025 ($2022):
2030-2040 ($2022):
|
$150,000/ DCFC port ($2021) $8,000/ L2 port ($2021) |
Appendix C. Supplemental Information on MHDV Charging Needs
BEV/Port ratios
| Scenario | BEV/port ratio | 2025 | 2030 | 2035 | 2040 |
|---|---|---|---|---|---|
| Policy Reference (primary) | Public | 8.1 | 10.1 | 9.1 | 8.6 |
| Private | 2.1 | 2.1 | 2.2 | 2.3 | |
| Total | 1.5 | 1.6 | 1.6 | 1.7 | |
| Fast Adoption | Public | 8.3 | 9.3 | 8.8 | 8.6 |
| Private | 2.1 | 2.2 | 2.3 | 2.4 | |
| Total | 1.5 | 1.6 | 1.6 | 1.7 | |
| Slow Adoption | Public | 7.2 | 9.6 | 9.5 | 9.0 |
| Private | 2.1 | 2.2 | 2.2 | 2.3 | |
| Total | 1.5 | 1.6 | 1.7 | 1.7 |
Port counts under each scenario
| Scenario | Port Location | Port Type | 2025 | 2030 | 2035 | 2040 |
|---|---|---|---|---|---|---|
| Policy Reference (primary scenario) | Public | Overnight | 3,561 | 22,120 | 64,850 | 148,495 |
| FC | 4,530 | 15,665 | 45,636 | 104,498 | ||
| UFC | - | 3,175 | 9,608 | 21,999 | ||
| Total | 8,091 | 40,960 | 120,094 | 274,992 | ||
| Private | Overnight | 30,993 | 192,854 | 493,204 | 1,017,646 | |
| FC | 4,226 | 21,669 | 55,415 | 114,344 | ||
| UFC | - | 2,166 | 5,542 | 11,433 | ||
| Total | 35,219 | 216,689 | 554,161 | 1,143,423 | ||
| Total Ports | 43,318 | 257,649 | 674,255 | 1,418,415 | ||
| Fast Adoption | Public | Overnight | 4,603 | 32,176 | 88,459 | 177,035 |
| FC | 5,859 | 22,662 | 62,251 | 124,580 | ||
| UFC | - | 4,750 | 13,103 | 26,229 | ||
| Total | 10,462 | 59,588 | 163,813 | 327,844 | ||
| Private | Overnight | 41,208 | 256,876 | 636,819 | 1,193,041 | |
| FC | 5,617 | 28,863 | 71,553 | 134,049 | ||
| UFC | - | 2,885 | 7,154 | 13,407 | ||
| Total | 46,825 | 288,624 | 715,526 | 1,340,497 | ||
| Total Ports | 57,296 | 348,212 | 879,339 | 1,668,341 | ||
| Slow Adoption | Public | Overnight | 3,517 | 19,335 | 53,933 | 127,944 |
| FC | 4,475 | 13,733 | 37,954 | 90,035 | ||
| UFC | - | 2,737 | 7,991 | 18,954 | ||
| Total | 7,992 | 35,805 | 99,878 | 236,933 | ||
| Private | Overnight | 27,019 | 157,801 | 423,458 | 912,989 | |
| FC | 3,685 | 17,731 | 47,580 | 102,584 | ||
| UFC | - | 1,774 | 4,758 | 10,257 | ||
| Total | 3,517 | 19,335 | 53,933 | 127,944 | ||
| Total Ports | 38,706 | 213,111 | 575,674 | 1,262,763 | ||
Vehicle Categories
| Vehicle Categories in this Study | US EPA Vehicle Categories (“MOVES”) | ECCC Heavy-duty vehicle weight class definition |
|---|---|---|
| All Class 2b-3s | Single Unit Short-haul Truck | Class 2b: 3,856 kg - 4,536kg Class 3: 4,536kg to 6,350 kg |
| Rigid truck, 4-5 | Single Unit Short-haul Truck | Class 4: 6,350kg - 7,257kg Class 5: 7,257 kg to 8,845kg |
| Rigid truck, 6-7 | Single Unit Short-haul Truck | Class 6: 8,845kg - 11,793kg Class 7: 11,793 kg to 14,969kg |
| Rigid truck, 8 | Single Unit Long-haul Truck | Class 8: greater than 14,969 kg |
| Refuse truck | Refuse Truck | |
| Tractor truck, short-haul | Combination Short-haul Truck | Class 8: greater than 14,969 kg |
| Tractor truck, long-haul | Combination Long-haul Truck | Class 8: greater than 14,969 kg |
| Shuttle bus, 4-5 | Transit Bus | Class 4: 6,350kg - 7,257kg Class 5: 7,257 kg to 8,845kg |
| Transit bus, 6-8 | Transit Bus | Class 6: 8,845kg - 11,793kg Class 7: 11,793 kg to 14,969kg Class 8: greater than 14,969 kg |
| School bus, 6-8 | School Bus | Class 6: 8,845kg - 11,793kg Class 7: 11,793 kg to 14,969kg Class 8: greater than 14,969 kg |
| Other bus, 6-8 | Other Buses | Class 6: 8,845kg - 11,793kg Class 7: 11,793 kg to 14,969kg Class 8: greater than 14,969 kg |
Daily Vehicle Usage Assumptions
| Region | Medium Trucks | Heavy Trucks | School Buses | Urban Transit | Inter City Buses |
|---|---|---|---|---|---|
| NFLD | 25,738 | 150,864 | 40,661 | 91,177 | 84,849 |
| PEI | 18,401 | 29,917 | 25,764 | 56,611 | 54,800 |
| NS | 21,362 | 86,729 | 37,173 | 61,919 | 55,734 |
| NB | 17,174 | 36,367 | 22,120 | 47,794 | 47,686 |
| QC | 21,958 | 94,694 | 23,528 | 54,868 | 39,422 |
| ON | 21,007 | 99,076 | 24,199 | 55,119 | 48,493 |
| MB | 13,853 | 61,436 | 13,024 | 24,961 | 31,364 |
| SK | 25,362 | 68,145 | 26,652 | 55,762 | 57,162 |
| AB | 29,729 | 95,644 | 32,724 | 62,487 | 52,331 |
| BC & Territories | 27,292 | 63,145 | 32,744 | 74,552 | 59,418 |
| All Class 2b-3s | Rigid truck, 4-5 | Rigid truck, 6-7 | Rigid truck, 8 | Refuse truck | Tractor truck, short-haul | Tractor truck, long-haul | Shuttle bus, 4-5 | Transit bus, 6-8 | School bus, 6-8 | Other bus, 6-8 | |
|---|---|---|---|---|---|---|---|---|---|---|---|
| NFLD | 25,738 | 25,738 | 25,738 | 150,864 | 25,738 | 150,864 | 150,864 | 91,177 | 91,177 | 40,661 | 84,849 |
| PEI | 18,401 | 18,401 | 18,401 | 29,917 | 18,401 | 29,917 | 29,917 | 56,611 | 56,611 | 25,764 | 54,800 |
| NS | 21,362 | 21,362 | 21,362 | 86,729 | 21,362 | 86,729 | 86,729 | 61,919 | 61,919 | 37,173 | 55,734 |
| NB | 17,174 | 17,174 | 17,174 | 36,367 | 17,174 | 36,367 | 36,367 | 47,794 | 47,794 | 22,120 | 47,686 |
| QC | 21,958 | 21,958 | 21,958 | 94,694 | 21,958 | 94,694 | 94,694 | 54,868 | 54,868 | 23,528 | 39,422 |
| ON | 21,007 | 21,007 | 21,007 | 99,076 | 21,007 | 99,076 | 99,076 | 55,119 | 55,119 | 24,199 | 48,493 |
| MB | 13,853 | 13,853 | 13,853 | 61,436 | 13,853 | 61,436 | 61,436 | 24,961 | 24,961 | 13,024 | 31,364 |
| SK | 25,362 | 25,362 | 25,362 | 68,145 | 25,362 | 68,145 | 68,145 | 55,762 | 55,762 | 26,652 | 57,162 |
| AB | 29,729 | 29,729 | 29,729 | 95,644 | 29,729 | 95,644 | 95,644 | 62,487 | 62,487 | 32,724 | 52,331 |
| BC & Territories | 27,292 | 27,292 | 27,292 | 63,145 | 27,292 | 63,145 | 63,145 | 74,552 | 74,552 | 32,744 | 59,418 |
| Operating Days (All Provinces) | 300 | 300 | 300 | 300 | 260 | 300 | 300 | 260 | 300 | 260 | 300 |
| All Class 2b-3s | Rigid truck, 4-5 | Rigid truck, 6-7 | Rigid truck, 8 | Refuse truck | Tractor truck, short-haul | Tractor truck, long-haul | Shuttle bus, 4-5 | Transit bus, 6-8 | School bus, 6-8 | Other bus, 6-8 | |
|---|---|---|---|---|---|---|---|---|---|---|---|
| NFLD | 86 | 86 | 86 | 503 | 99 | 503 | 503 | 351 | 304 | 156 | 283 |
| PEI | 61 | 61 | 61 | 100 | 71 | 100 | 100 | 218 | 189 | 99 | 183 |
| NS | 71 | 71 | 71 | 289 | 82 | 289 | 289 | 238 | 206 | 143 | 186 |
| NB | 57 | 57 | 57 | 121 | 66 | 121 | 121 | 184 | 159 | 85 | 159 |
| QC | 73 | 73 | 73 | 316 | 84 | 316 | 316 | 211 | 183 | 90 | 131 |
| ON | 70 | 70 | 70 | 330 | 81 | 330 | 330 | 212 | 184 | 93 | 162 |
| MB | 46 | 46 | 46 | 205 | 53 | 205 | 205 | 96 | 83 | 50 | 105 |
| SK | 85 | 85 | 85 | 227 | 98 | 227 | 227 | 214 | 186 | 103 | 191 |
| AB | 99 | 99 | 99 | 319 | 114 | 319 | 319 | 240 | 208 | 126 | 174 |
| BC & Territories | 91 | 91 | 91 | 210 | 105 | 210 | 210 | 287 | 249 | 126 | 198 |
Appendix D. Supplemental Information on Regional Infrastructure Needs
| Province/ Territory | DCFC | L2 – Public | L2 - Workplace | Public Ports Total | ||||||||||||
|---|---|---|---|---|---|---|---|---|---|---|---|---|---|---|---|---|
| 2025 | 2030 | 2035 | 2040 | 2025 | 2030 | 2035 | 2040 | 2025 | 2030 | 2035 | 2040 | 2025 | 2030 | 2035 | 2040 | |
| AB | 576 | 1,441 | 3,030 | 4,370 | 2,190 | 7,630 | 23,190 | 42,700 | 1,250 | 4,510 | 13,820 | 25,850 | 4,016 | 13,581 | 40,040 | 72,920 |
| BC. | 1,770 | 3,569 | 4,534 | 5,482 | 8,480 | 14,880 | 23,790 | 33,980 | 5,210 | 9,810 | 15,870 | 23,910 | 15,460 | 28,260 | 44,190 | 63,370 |
| MB | 223 | 511 | 1,049 | 1,437 | 780 | 2,880 | 8,820 | 15,990 | 430 | 1,630 | 5,000 | 9,190 | 1,433 | 5,021 | 14,869 | 26,617 |
| NB | 98 | 318 | 671 | 1,083 | 560 | 2,370 | 6,130 | 8,920 | 310 | 1,360 | 3,620 | 5,610 | 968 | 4,048 | 10,421 | 15,613 |
| NL | 110 | 213 | 427 | 630 | 310 | 1,430 | 4,910 | 9,770 | 170 | 770 | 2,660 | 5,330 | 590 | 2,413 | 7,997 | 15,730 |
| NS | 139 | 369 | 785 | 1,121 | 780 | 2,560 | 7,540 | 13,470 | 440 | 1,480 | 4,420 | 8,060 | 1,359 | 4,409 | 12,745 | 22,651 |
| ON | 2,791 | 7,429 | 14,245 | 19,822 | 15,930 | 37,830 | 100,550 | 173,270 | 8,990 | 22,690 | 60,180 | 107,920 | 27,711 | 67,949 | 174,975 | 301,012 |
| PEI | 22 | 62 | 122 | 172 | 180 | 570 | 1,610 | 2,790 | 100 | 320 | 910 | 1,600 | 302 | 952 | 2,642 | 4,562 |
| QC | 2,868 | 7,396 | 10,264 | 11,720 | 28,380 | 60,260 | 70,320 | 68,380 | 16,090 | 35,690 | 44,530 | 49,420 | 47,338 | 103,346 | 125,114 | 129,520 |
| SK | 278 | 476 | 981 | 1,369 | 560 | 2,280 | 7,420 | 14,670 | 300 | 1,260 | 4,120 | 8,230 | 1,138 | 4,016 | 12,521 | 24,269 |
| Terr. | 123 | 147 | 174 | 207 | 50 | 190 | 680 | 1,360 | 30 | 110 | 390 | 780 | 203 | 446 | 1,248 | 2,350 |
| Province/ Territory | Overnight – 50 kW | Fast Charger – 350 kW | Ultra-Fast Charger – 2 MW | Public Ports Total | ||||||||||||
|---|---|---|---|---|---|---|---|---|---|---|---|---|---|---|---|---|
| 2025 | 2030 | 2035 | 2040 | 2025 | 2030 | 2035 | 2040 | 2025 | 2030 | 2035 | 2040 | 2025 | 2030 | 2035 | 2040 | |
| AB | 627 | 3566 | 10360 | 23604 | 797 | 2510 | 7291 | 16611 | 0 | 528 | 1535 | 3497 | 1424 | 6604 | 19186 | 43712 |
| BC & Terr. | 480 | 1954 | 5564 | 12554 | 610 | 1375 | 3915 | 8834 | 0 | 289 | 824 | 1860 | 1090 | 3618 | 10303 | 23248 |
| MB | 154 | 630 | 1875 | 4318 | 195 | 443 | 1319 | 3039 | 0 | 93 | 278 | 640 | 349 | 1166 | 3472 | 7997 |
| NB | 63 | 323 | 946 | 2154 | 80 | 227 | 666 | 1516 | 0 | 48 | 140 | 319 | 143 | 598 | 1752 | 3989 |
| NL | 40 | 138 | 353 | 767 | 52 | 97 | 248 | 540 | 0 | 21 | 52 | 114 | 92 | 256 | 653 | 1421 |
| NS | 56 | 346 | 993 | 2255 | 71 | 243 | 699 | 1587 | 0 | 51 | 147 | 333 | 127 | 640 | 1839 | 4175 |
| ON | 1222 | 10189 | 30474 | 70219 | 1555 | 7170 | 21445 | 49414 | 0 | 1509 | 4515 | 10403 | 2777 | 18868 | 56434 | 130036 |
| PEI | 4 | 22 | 53 | 115 | 5 | 15 | 38 | 81 | 0 | 3 | 8 | 17 | 9 | 40 | 99 | 213 |
| QC | 559 | 4449 | 13068 | 29916 | 711 | 3131 | 9196 | 21052 | 0 | 659 | 1936 | 4432 | 1270 | 8239 | 24200 | 55400 |
| SK | 356 | 503 | 1164 | 2593 | 454 | 454 | 819 | 1824 | 0 | -26 | 173 | 384 | 810 | 931 | 2156 | 4801 |
Appendix E. Supplemental Information on Grid Impacts
| Vehicle Type/Province | 2025 | 2030 | 2035 | 2040 |
|---|---|---|---|---|
| LDV | 588.5 | 2,736.5 | 7,897.3 | 13,212.1 |
| Alberta | 28.0 | 193.4 | 756.5 | 1,436.9 |
| British Columbia | 113.4 | 410.0 | 869.9 | 1,324.7 |
| Manitoba | 9.6 | 71.3 | 279.8 | 521.2 |
| New Brunswick | 3.4 | 32.5 | 120.6 | 225.1 |
| Newfoundland and Labrador | 2.6 | 22.6 | 99.2 | 204.3 |
| Northwest Territories | 0.2 | 2.0 | 10.0 | 22.0 |
| Nova Scotia | 8.0 | 52.2 | 197.1 | 363.3 |
| Nunavut | 0.0 | 0.2 | 1.1 | 2.6 |
| Ontario | 219.5 | 1,066.4 | 3,590.4 | 6,368.3 |
| Prince Edward Island | 1.1 | 7.0 | 25.7 | 47.5 |
| Quebec | 195.2 | 821.1 | 1,703.8 | 2,199.4 |
| Saskatchewan | 6.9 | 55.0 | 231.3 | 474.4 |
| Yukon | 0.5 | 2.9 | 11.7 | 22.5 |
| MHDV | 254.7 | 1,576.8 | 4,306.4 | 9,334.2 |
| Alberta | 69.6 | 404.5 | 1,095.1 | 2,367.0 |
| British Columbia | 37.9 | 221.1 | 579.7 | 1,238.6 |
| Manitoba | 6.5 | 40.1 | 113.2 | 248.4 |
| New Brunswick | 2.0 | 13.1 | 35.1 | 74.5 |
| Newfoundland and Labrador | 1.0 | 5.8 | 14.6 | 31.1 |
| Northwest Territories | 0.0 | 0.0 | 0.0 | 0.0 |
| Nova Scotia | 2.4 | 14.5 | 40.2 | 87.7 |
| Nunavut | 0.0 | 0.0 | 0.0 | 0.0 |
| Ontario | 98.8 | 659.7 | 1,851.0 | 4,049.8 |
| Prince Edward Island | 0.3 | 1.6 | 4.1 | 8.7 |
| Quebec | 24.6 | 157.9 | 423.7 | 911.6 |
| Saskatchewan | 11.6 | 58.4 | 149.6 | 316.7 |
| Yukon | 0.0 | 0.0 | 0.0 | 0.0 |
| Grand Total | 843.1 | 4,313.3 | 12,203.7 | 22,546.2 |
“No Disclaimers” Policy
This report was prepared by Dunsky Energy + Climate Advisors, an independent firm focused on the clean energy transition and committed to quality, integrity and unbiased analysis and counsel. Our findings and recommendations are based on the best information available at the time the work was conducted as well as our experts' professional judgment.
Dunsky is proud to stand by our work.