

Technical Reference
Overview
The ENERGY STAR score for indoor ice rinks in Canada applies to public or private buildings that include one or more ice sheets used for recreational or professional skating, hockey or ringette. The objective of the ENERGY STAR score is to provide a fair assessment of the energy performance of a property, relative to its peers, taking into account the climate, weather, and business activities at the property. A statistical analysis of the peer building population is performed to identify the aspects of building activity that are significant drivers of energy use and then to normalize for those factors. The result of this analysis is an equation that predicts the energy use of a property, based on its experienced business activities. The energy use prediction for a building is compared to its actual energy use to yield a 1 to 100 percentile ranking of performance, relative to the national population.
- Property types. The ENERGY STAR score for indoor ice rinks applies to public or private buildings that include one or more ice sheets used for recreational or professional skating, hockey or ringette. The ENERGY STAR score applies to entire indoor ice rinks, whether they are single buildings or campuses of buildings.
- Reference data. The analysis for indoor ice rinks in Canada is based on data from the Survey of Energy Consumption of Arenas (SECA), which was commissioned by Natural Resources Canada (NRCan) and carried out by Statistics Canada, and represents the energy consumption year 2014.
- Adjustments for weather and business activity. The analysis includes adjustments for:
- Number of full time equivalent workers
- Number of months that the main indoor ice rink is in use
- Total indoor ice rink size (m2)
- Average number of indoor ice resurfacings per rink per week
- Number of ice rink spectator seats in the facility
- Number of curling sheets in the facility
- Weather and climate (using heating and cooling degree days, retrieved based on postal code)
- Release date. This is the first release of the ENERGY STAR score for indoor ice rinks in Canada.
This document presents details on the development of the 1 – 100 ENERGY STAR score for indoor ice rinks. More information on the overall approach to develop ENERGY STAR scores is covered in our Technical Reference for the ENERGY STAR Score (PDF, 709 KB). The subsequent sections of this document offer specific details on the development of the ENERGY STAR score for indoor ice rinks.
- Overview
- Reference data & filters
- Variables analyzed
- Regression equation results
- Energy star score lookup table
- Example calculation
Reference data & filters
The ENERGY STAR score for ice rinks in Canada applies to public or private buildings that include one or more ice sheets used for recreational or professional skating, hockey or ringette. Buildings that are exclusively used for curling are not currently eligible to earn an ENERGY STAR score but can be benchmarked using this property type. The score does not apply to larger facilities primarily serving professional or collegiate functions and with significant spectator seating (≥5,000 seats). These facilities should most likely be benchmarked using the Entertainment/Public Assembly – Stadium – Indoor Arena property type, at Glossary Indoor Arena. The reference data used to establish the peer building population is based on data from the Survey on Energy Consumption of Arenas (SECA), which was commissioned by Natural Resources Canada and carried out by Statistics Canada in late 2015 and early 2016. The energy data for the survey was from the calendar year 2014. The raw collected data file for this survey is not publically available. Summary results for the entire sector, produced by Statistics Canada, are available online.
To analyze the building energy and operating characteristics in this survey data, four types of filters were applied to define the peer group for comparison and to overcome any technical limitations in the data: Building Type Filters, Program Filters, Data Limitation Filters, and Analytical Filters. A complete description of each of these categories is provided in our Technical Reference for the ENERGY STAR Score (PDF, 709 KB). Figure 1 presents a summary of each filter applied in the development of the ENERGY STAR score for indoor ice rinks and the rationale behind the filter. After all filters were applied, the remaining data set has 1,195 observations. Due to the confidentiality of the survey data, NRCan is not able to identify the number of cases after each filter.
| Condition for Including an Observation in the Analysis | Rationale |
|---|---|
| Must have at least one indoor ice rink | Building Type Filter – In order to be considered part of the indoor ice rink peer group, as defined in the survey, the facility must have at least one indoor ice rink, used for hockey and/or skating. |
| Must not have more than 25% of the area defined as Fitness Centre, Gymnasium and/or Indoor Swimming Pool | Building Type Filter – In order to be considered part of the indoor ice rink peer group, the facility must not have more than 25% of its gross floor area used as a fitness centre, gymnasium (including racquet sport courts) and/or indoor swimming pool. In Portfolio Manager, these areas would fall under the property use type: Fitness Center / Health Club / Gym. |
| Must have electric energy data | Program Filter – Basic requirement to be considered an indoor ice rink is that it requires electrical energy. Electricity can be grid-purchased or produced on site. |
| Must have at least 1 full-time or part-time worker | Program Filter – Basic requirement for a full-time indoor ice rink. There must be at least one worker. |
| The main Ice Rink must operate at least 5 months per year | Program Filter – Basic requirement to be considered a full-time indoor ice rink |
| Must not use any “other” fuels for which the energy value is reported | Data Limitation Filter – The survey asked whether fuels other than purchased electricity, on-site generated electricity from renewable sources, natural gas, heating fuel oil, diesel or propane were consumed in the facility. While the unit of energy was defined, the type of energy was not; therefore the energy content of these fuels could not be directly compared. In these occurrences, these observations were removed from the analysis. |
| Must be built in 2013 or earlier | Data Limitation Filter – The survey reported the energy for calendar year 2014. Therefore, if the facility was built in 2014, a full year of energy data would not be available. |
| Must not have reported energy to other buildings | Data Limitation Filter – The survey asked whether the energy reported at the facility included energy supplied to outdoor pools, sports fields, exterior bubble domes, tennis courts, or annex buildings. The energy consumption for these usages could not be quantified. In the cases that reported energy was supplied to one of the described uses, the cases were removed from the analysis. |
| Must have reported all energy used in the facility | Data Limitation Filter – The survey asked if all the energy used at the facility was reported. In the case that part or all of the energy consumed at the facility was not reported or missing, these cases were removed from the analysis. |
| Must have a worker density less than or equal to 0.75 full-time equivalent workers per 100 square metres | Analytical Filter – Values determined to be outliers based on analysis of the data. Outliers are typically clearly outside normal operating parameters for a facility of this type. |
| Must have a rink area–to–building area ratio smaller than or equal to 90% | Analytical Filter – In order to be considered part of the indoor ice rink peer group, the ice surface cannot constitute more than 90% of the building area. |
| Must have a spectator seating density less than or equal to 200 spectator seats per 100 m2 | Analytical Filter – Values determined to be outliers based on analysis of the data. Outliers are typically clearly outside normal operating parameters for a facility of this type. |
| Must have an average weekly number of resurfacings per rink less than or equal to 110 | Analytical Filter – Values determined to be outliers based on analysis of the data. Outliers are typically clearly outside normal operating parameters for a facility of this type. |
| Must have a spectator seating capacity less than or equal to 5,000 seats | Analytical Filter – Values determined to be outliers based on analysis of the data. Outliers are typically clearly outside normal operating parameters for a facility of this type. |
Of the filters applied to the reference data, some result in constraints on calculating a score in Portfolio Manager, and others do not. Building Type and Program Filters are used to limit the reference data to include only properties that are intended to receive a score in Portfolio Manager, and are therefore related to eligibility requirements. In contrast, Data Limitation Filters account for limitations in the data available during the analysis, but do not apply in Portfolio Manager. Analytical Filters are used to eliminate outlier data points or different subsets of data, and may or may not affect eligibility. In some cases, a subset of the data has a different behaviour from the rest of the properties, in which case an Analytical Filter is used to determine eligibility in Portfolio Manager. In other cases, Analytical Filters exclude a small number of outliers with extreme values that skew the analysis, but do not affect eligibility requirements. A full description of the criteria you must meet to obtain a score in Portfolio Manager is available at Benchmarking - Frequently Asked Questions.
Related to the filters and eligibility criteria described above, another consideration is how Portfolio Manager treats properties that are situated on a campus. The main unit for benchmarking in Portfolio Manager is the property, which may be used to describe either a part of a building, a single building or a campus of buildings. The applicability of the ENERGY STAR score depends on the type of property. The ENERGY STAR score applies to an entire indoor ice rink facility, whether it is a single building or a campus of buildings. Indoor ice rink facilities may have multiple buildings that are all integral to the primary activity. One building may contain an ice rink, another, a second ice rink and a third, a locker room. In this case, the campus can get an ENERGY STAR score as long as the energy for all the buildings is metered and reported. For cases where all the activities are contained within one building, that indoor ice rink can get a building ENERGY STAR Score.
Variables analyzed
To normalize for differences in business activity, we perform a statistical analysis to understand what aspects of building activity are significant with respect to energy use. The filtered reference data set, described in the previous section, is analyzed using a weighted ordinary least squares regression, which evaluates energy use relative to business activity (e.g. number of workers, operating months per year, and climate). This linear regression yields an equation that is used to compute energy use intensity (also called the dependent variable) based on a series of characteristics that describe the business activities (also called independent variables). This section details the variables used in the statistical analysis for indoor ice rinks in Canada.
Dependent Variable
The dependent variable is what we try to predict with the regression equation. For the indoor ice rink analysis, the dependent variable is energy consumption expressed in source energy use intensity (source EUI). This is equal to the total source energy use of the property divided by the gross floor area. The regression analyzes the key drivers of source EUI – those factors that explain the variation in source energy use per square metre in indoor ice rinks. The unit for source EUI in the Canadian model is the gigajoule per square metre (GJ/m2) per year.
Independent Variables
The SECA data contains numerous building property attributes that NRCan identified as potentially important for indoor ice rinks. Based on a review of the available variables in the SECA data, in accordance with the criteria for inclusion,Footnote 1 NRCan initially analyzed the following variables in the regression analysis:
- Gross building area (m2)
- Heating degree days (HDD)
- Cooling degree days (CDD)
- Average outdoor temperature (°C)
- Number of full-time and part-time workers
- Weekly hours of operation
- Months of operation per year
- Number of computers, computer servers and cash registers
- Presence of a gymnasium
- Main use of the rink(s)
- Area of ice rink(s)
- Presence of indoor and outdoor rink(s)
- Presence of ice refrigeration equipment
- Number of spectator seats
- Number of ice resurfacings per week
- Number of curling sheets
- Presence of a gymnasium and/or fitness centre
- Floor area of a gymnasium and/or fitness centre
- Presence of concession stands, restaurants and bars
- Number of concession stands, restaurants and bars
- Presence of a pool
- Area of a pool
- Number of interior parking spaces
- Number of heated interior parking spaces
- Number of exterior parking spaces
NRCan and EPA perform extensive review on all of these operational characteristics. In addition to reviewing each characteristic individually, characteristics are reviewed in combination with each other (e.g. number of spectator seats per number of rinks). As part of the analysis, some variables are reformatted to reflect the physical relationships of building components. For example, the number of workers can be evaluated in a density format. The number of workers per square metre (as opposed to the gross number of workers) could be expected to be related to the energy use per square metre. Also, based on analytical results and residual plots, variables are examined using different transformations (such as the natural logarithm, abbreviated as Ln). The analysis consists of multiple regression formulations. These analyses are structured to find the combination of statistically significant operating characteristics that explain the greatest amount of variance in the dependent variable: source EUI.
The final regression equation includes the following variables:
- Average number of weekly ice resurfacings per rink
- Number of spectator seats per 100 square metres
- Natural logarithm of the number of months that the main rink is in use
- Number of full-time equivalent workers per 100 square metres
- Percentage of total building area that is covered by ice rinks
- Number of curling sheets
- Number of heating degree days (HDD)
- Number of cooling degree days (CDD)
These variables are used together to compute the predicted source EUI for indoor ice rinks. The predicted source EUI is the mean EUI for a hypothetical population of buildings that share the same values for each of these characteristics. That is, the mean energy for buildings that operate like your building.
Worker Analysis
NRCan and EPA analyzed the part-time workers, the full-time workers, the full-time equivalent (FTE) workers and their densities (per 100 m2). An increase in any worker variable resulted in an increase in EUI. The number of FTE workers per 100 m2 is defined as the number of full-time workers plus one quarter of the number of part-time workers, (i.e. part-time workers were assumed to be working a quarter of a full-time worker’s shift), per 100 m2. The number of FTE workers per 100 m2 was chosen as a variable since FTE density was consistently the most statistically significant worker variable.
Further analysis indicated that facilities with high FTE worker density did not behave like other facilities and reduced the stability of the statistical models. It was necessary to filter out observations with high FTE worker density (> 0.75 FTE workers per 100 m2). For the purposes of ENERGY STAR score calculation, a worker density value of 0.75 workers per 100 m2 will be assigned to facilities with FTE worker densities above this threshold.
Property Floor Area and Indoor Ice Area Analysis
Several variables related to the size of the building were evaluated, including the gross floor area and the indoor ice rink area. The variable that was consistently statistically significant was the percentage of indoor ice rink area, or the ratio between the indoor ice rink area and the building area. Analysis indicated that facilities with large indoor ice rink percentages did not behave the same way as the majority of the observations. As a result, buildings with indoor ice rink percentages greater than 90% were excluded from the regression analysis and cannot receive an ENERGY STAR score. It is important to note that the total building size is still used to calculate density variables such as the number of FTE workers per 100 m2 and EUI.
Spectator Seating Capacity and High-Capacity Venue Analysis
The spectator seating capacity density (number of seats per 100 m2) was consistently statistically significant during the development of the indoor ice rinks model. However, spectator seating density had to be at least 20 seats per 100 m2 before it affected EUI. Therefore, a minimum spectator seating density was applied, and a spectator seating density value of 20 seats per 100 m2 will be assigned to facilities with spectator seating densities below this threshold.
High-capacity venues, defined as facilities with spectator seating capacity greater than 5,000, have different operational characteristics than recreational rinks. While a spectator seating capacity variable could potentially normalize high seating capacity ice rinks, there was concern that this variable on its own would not adequately capture other important operational variables for these building types. Additional analysis specific to this building type is required, as these other potential variables were not captured in the SECA survey. Therefore, any indoor ice rink with a spectator seating capacity greater than 5,000 seats will not receive an ENERGY STAR score.
Swimming Pools, Gymnasiums and Fitness Centres Analysis
Several variables related to the use of gymnasium, fitness centres and swimming pools were evaluated during the analysis, including the months of use of these spaces and their respective areas. During the analysis, it was found that facilities that have swimming pools tend to consume more energy compared to facilities without swimming pools, due to certain operational difference such as hours of operation (e.g. most swimming pools are open 12 months, while most ice rinks are open only 8 months). Due to the number of operational differences, swimming pools, gymnasiums and fitness centres were not considered supporting spaces for indoor ice rinks. To properly benchmark facilities, users should benchmark their gymnasium, fitness centre and swimming pool areas, including associated spaces, under the Fitness Center/Health Club/Gym building type.
To be eligible for the ENERGY STAR score for indoor ice rink, less than 25% of facility space must be dedicated to swimming pools, gymnasiums or fitness centres.
Testing
Finally, NRCan further analyzed the regression equation using actual data that has been entered in Portfolio Manager and the results of the Canadian Recreation Facilities Council National Arena Census May 2005 – December 2005. This provided another set of buildings to examine, in addition to the SECA data, to see the ENERGY STAR scores and distributions, and to assess the impacts and adjustments. This analysis on a separate dataset provided a second level of verification to ensure that there was a good distribution of scores.
It is important to reiterate that the final regression equation is based on nationally representative reference data from SECA 2014, not on data previously entered into Portfolio Manager or collected as part of the 2005 census.
Regression equation results
The final regression is a weighted ordinary least squares regression across the filtered data set of 1,195 observations. The dependent variable is source EUI. Each independent variable is centered relative to the weighted mean value, presented in Figure 2. The final equation is presented in Figure 3. All variables in the regression equation are significant at the 95% confidence level or better, as shown by their respective significance levels.
The regression equation has a coefficient of determination (R2) value of 0.403, indicating that this equation explains 40.3% of the variance in source EUI for indoor ice rink facilities. Because the final equation is structured with energy per unit area as the dependent variable, the explanatory power of the area is not included in the R2 value, and thus this value appears artificially low. Re-computing the R2 value in units of source energyFootnote 2 demonstrates that the equation actually explains 76.1% of the variation in total source energy of indoor ice rinks.
Detailed information on the ordinary least squares regression approach is available in our Technical Reference for the ENERGY STAR Score (PDF, 709 KB).
| Variable | Minimum | Median | Maximum | Mean |
|---|---|---|---|---|
| Source energy per square metre (GJ/m2) | 0.100 | 1.628 | 7.675 | 1.825 |
| Natural Logarithm of the number of months the main rink is open | 1.609 | 1.946 | 2.485 | 2.017 |
| Weekly ice resurfacings per rink | 4.000 | 54.00 | 110.00 | 53.19 |
| Number of spectator seats per 100 m2 | 20.00 | 20.00 | 99.03 | 23.20 |
| Number of FTE workers per 100 m2 | 0.0050 | 0.1130 | 0.7000 | 0.1400 |
| Percent of the facility that is covered by ice rinks | 3.933 | 45.95 | 89.95 | 44.98 |
| Heating degree days | 2,543 | 4,935 | 11,441 | 5,107 |
| Cooling degree days | 0 | 115.0 | 419.1 | 131.1 |
| Number of curling sheets | 0 | 0 | 10.00 | 0.561 |
Figure 3 - Final Regression Results
| Dependent variable | Source energy intensity (GJ/m2) |
|---|---|
| Number of observations in analysis | 1,195 |
| R2 value | 0.403 |
| Adjusted R2 value | 0.399 |
| F statistic | 100.09 |
| Significance (p-level) | < 0.0001 |
| Dependent variable | Unstandardized Coefficients | Standard Error | T Value | Significance (p-level) |
|---|---|---|---|---|
| Constant | 1.824 | 0.0225 | 81.09 | <0.0001 |
| C_Natural Logarithm of the number of months the main rink is open | 1.541 | 0.1117 | 13.79 | <0.0001 |
| C_Weekly ice resurfacings per rink | 9.55E-03 | 1.31E-03 | 7.3 | <0.0001 |
| C_Number of spectator seats per 100 m2 | 1.17E-02 | 2.8E-03 | 4.19 | <0.0001 |
| C_Number of FTE workers per 100 m2 | 2.574 | 0.2660 | 9.68 | <0.0001 |
| C_Percent of the facility that is covered in ice | 0.0103 | 1.639E-03 | 6.27 | <0.0001 |
| C_Heating degree days | 1.070E-04 | 2.6220E-05 | 4.08 | <0.0001 |
| C_Cooling degree days | 9.976E-04 | 3.250E-04 | 3.07 | 0.0022 |
| C_Number of curling sheets | 3.890E-02 | 1.650E-02 | 2.35 | 0.0187 |
Notes:
|
||||
Energy star score lookup table
The final regression equation (presented in Figure 3) yields a prediction of source EUI based on a building’s operating characteristics. Some buildings in the SECA data sample use more energy than predicted by the regression equation, while others use less. The actual source EUI of each reference data observation is divided by its predicted source EUI to calculate an energy efficiency ratio:
An efficiency ratio lower than one (1) indicates that a building uses less energy than predicted, and consequently is more efficient. A higher efficiency ratio indicates the opposite.
The efficiency ratios are sorted from smallest to largest, and the cumulative percent of the population at each ratio is computed using the individual observation weights from the reference data set. Figure 4 presents a plot of this cumulative distribution. A smooth curve (shown in orange) is fitted to the data using a two-parameter gamma distribution. The fit is performed in order to minimize the sum of squared differences between each building’s actual percent rank in the population and each building’s percent rank with the gamma solution. The final fit for the gamma curve yielded a shape parameter (alpha) of 7.084 and a scale parameter (beta) of 0.1401. For this fit, the sum of the squared error is 0.0902.
Figure 4 – Distribution for Indoor Ice Rinks
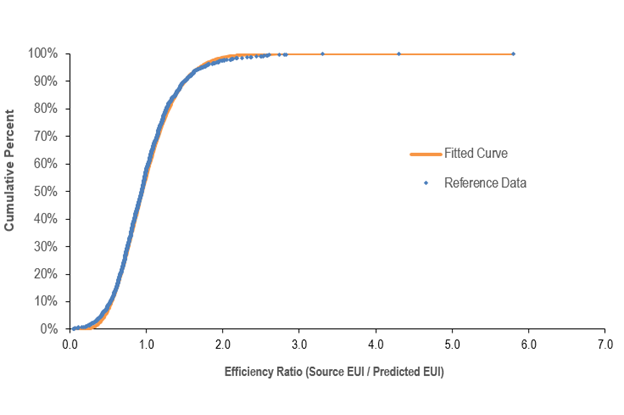
The final gamma shape and scale parameters are used to calculate the efficiency ratio at each percentile (1 to 100) along the curve. For example, the ratio on the gamma curve at 1% corresponds to a score of 99; only 1% of the population has a ratio this small or smaller. The ratio on the gamma curve at the value of 25% corresponds to the ratio for a score of 75; only 25% of the population has a ratio this small or smaller. The complete score lookup table is presented in Figure 5.
Figure 5 – ENERGY STAR Score Lookup Table for Indoor Ice Rinks
| ENERGY STAR Score | Cumulative Percent | Energy Efficiency Ratio | |
|---|---|---|---|
| > = | < | ||
| 100 | 0% | 0.0000 | 0.3332 |
| 99 | 1% | 0.3332 | 0.3833 |
| 98 | 2% | 0.3833 | 0.4179 |
| 97 | 3% | 0.4179 | 0.4453 |
| 96 | 4% | 0.4453 | 0.4685 |
| 95 | 5% | 0.4685 | 0.4889 |
| 94 | 6% | 0.4889 | 0.5073 |
| 93 | 7% | 0.5073 | 0.5242 |
| 92 | 8% | 0.5242 | 0.5399 |
| 91 | 9% | 0.5399 | 0.5547 |
| 90 | 10% | 0.5547 | 0.5686 |
| 89 | 11% | 0.5686 | 0.5819 |
| 88 | 12% | 0.5819 | 0.5947 |
| 87 | 13% | 0.5947 | 0.6069 |
| 86 | 14% | 0.6069 | 0.6188 |
| 85 | 15% | 0.6188 | 0.6302 |
| 84 | 16% | 0.6302 | 0.6414 |
| 83 | 17% | 0.6414 | 0.6522 |
| 82 | 18% | 0.6522 | 0.6629 |
| 81 | 19% | 0.6629 | 0.6732 |
| 80 | 20% | 0.6732 | 0.6834 |
| 79 | 21% | 0.6834 | 0.6934 |
| 78 | 22% | 0.6934 | 0.7033 |
| 77 | 23% | 0.7033 | 0.7130 |
| 76 | 24% | 0.7130 | 0.7225 |
| 75 | 25% | 0.7225 | 0.7320 |
| 74 | 26% | 0.7320 | 0.7413 |
| 73 | 27% | 0.7413 | 0.7506 |
| 72 | 28% | 0.7506 | 0.7597 |
| 71 | 29% | 0.7597 | 0.7688 |
| 70 | 30% | 0.7688 | 0.7779 |
| 69 | 31% | 0.7779 | 0.7868 |
| 68 | 32% | 0.7868 | 0.7958 |
| 67 | 33% | 0.7958 | 0.8047 |
| 66 | 34% | 0.8047 | 0.8135 |
| 65 | 35% | 0.8135 | 0.8224 |
| 64 | 36% | 0.8224 | 0.8312 |
| 63 | 37% | 0.8312 | 0.8400 |
| 62 | 38% | 0.8400 | 0.8487 |
| 61 | 39% | 0.8487 | 0.8575 |
| 60 | 40% | 0.8575 | 0.8663 |
| 59 | 41% | 0.8663 | 0.8751 |
| 58 | 42% | 0.8751 | 0.8839 |
| 57 | 43% | 0.8839 | 0.8928 |
| 56 | 44% | 0.8928 | 0.9016 |
| 55 | 45% | 0.9016 | 0.9105 |
| 54 | 46% | 0.9105 | 0.9194 |
| 53 | 47% | 0.9194 | 0.9284 |
| 52 | 48% | 0.9284 | 0.9374 |
| 51 | 49% | 0.9374 | 0.9465 |
| ENERGY STAR Score | Cumulative Percent | Energy Efficiency Ratio | |
|---|---|---|---|
| >= | < | ||
| 50 | 50% | 0.9465 | 0.9556 |
| 49 | 51% | 0.9556 | 0.9648 |
| 48 | 52% | 0.9648 | 0.9740 |
| 47 | 53% | 0.9740 | 0.9833 |
| 46 | 54% | 0.9833 | 0.9928 |
| 45 | 55% | 0.9928 | 1.0023 |
| 44 | 56% | 1.0023 | 1.0119 |
| 43 | 57% | 1.0119 | 1.0216 |
| 42 | 58% | 1.0216 | 1.0314 |
| 41 | 59% | 1.0314 | 1.0413 |
| 40 | 60% | 1.0413 | 1.0514 |
| 39 | 61% | 1.0514 | 1.0616 |
| 38 | 62% | 1.0616 | 1.0720 |
| 37 | 63% | 1.0720 | 1.0825 |
| 36 | 64% | 1.0825 | 1.0932 |
| 35 | 65% | 1.0932 | 1.1041 |
| 34 | 66% | 1.1041 | 1.1151 |
| 33 | 67% | 1.1151 | 1.1264 |
| 32 | 68% | 1.1264 | 1.1379 |
| 31 | 69% | 1.1379 | 1.1496 |
| 30 | 70% | 1.1496 | 1.1616 |
| 29 | 71% | 1.1616 | 1.1739 |
| 28 | 72% | 1.1739 | 1.1865 |
| 27 | 73% | 1.1865 | 1.1994 |
| 26 | 74% | 1.1994 | 1.2127 |
| 25 | 75% | 1.2127 | 1.2263 |
| 24 | 76% | 1.2263 | 1.2404 |
| 23 | 77% | 1.2404 | 1.2549 |
| 22 | 78% | 1.2549 | 1.2699 |
| 21 | 79% | 1.2699 | 1.2855 |
| 20 | 80% | 1.2855 | 1.3017 |
| 19 | 81% | 1.3017 | 1.3185 |
| 18 | 82% | 1.3185 | 1.3361 |
| 17 | 83% | 1.3361 | 1.3545 |
| 16 | 84% | 1.3545 | 1.3739 |
| 15 | 85% | 1.3739 | 1.3944 |
| 14 | 86% | 1.3944 | 1.4160 |
| 13 | 87% | 1.4160 | 1.4391 |
| 12 | 88% | 1.4391 | 1.4639 |
| 11 | 89% | 1.4639 | 1.4906 |
| 10 | 90% | 1.4906 | 1.5198 |
| 9 | 91% | 1.5198 | 1.5518 |
| 8 | 92% | 1.5518 | 1.5875 |
| 7 | 93% | 1.5875 | 1.6281 |
| 6 | 94% | 1.6281 | 1.6751 |
| 5 | 95% | 1.6751 | 1.7314 |
| 4 | 96% | 1.7314 | 1.8023 |
| 3 | 97% | 1.8023 | 1.8994 |
| 2 | 98% | 1.8994 | 2.0589 |
| 1 | 99% | 2.0589 | > 2.0589 |
Example calculation
As detailed in our Technical Reference for the ENERGY STAR Score (PDF, 709 KB), there are five steps to compute a score. The following is a specific example for the score for indoor ice rinks.
1 User enters building data into Portfolio Manager
- 12 months of energy use information for all energy types (annual values, entered in monthly meter entries)
- Physical building information (size, location, etc.) and use details describing building activity (hours, etc.)
| Energy Data | Value |
|---|---|
| Electricity | 120,000 kWh |
| Natural gas | 31,225 m3 |
| Property Use Details | Value |
|---|---|
| Gross floor area (m2) | 3,017 |
| HDD (provided by Portfolio Manager, based on postal code) | 6,097 |
| CDD (provided by Portfolio Manager, based on postal code) | 89 |
| Area of the indoor ice rinks (m2) | 1,320 |
| Number of indoor ice rinks | 1 |
| Number of ice resurfacings per week (total) | 20 |
| Number of months that the main indoor ice rink is open | 5 |
| Number of full-time equivalent workers | 1 |
| Number of curling sheets | 4 |
| Spectator seating capacity | 300 |
2 Portfolio Manager computes the actual source EUI
- Total energy consumption for each fuel is converted from billing units into site energy and source energy.
- Source energy values are added across all fuel types.
- Source energy is divided by gross floor area to determine actual source EUI.
| Fuel | Billing Units | Site GJ Multiplier | Site GJ | Source Multiplier | Source GJ |
|---|---|---|---|---|---|
| Electricity | 120,000 kWh | 0.0036 | 432 | 1.83 | 790.6 |
| Natural gas | 31,225 m3 | 0.03843 | 1,200 | 1.06 | 1,272 |
| Total Source Energy (GJ) | 2,062.5 | ||||
| Source EUI (GJ/m2) | 0.684 | ||||
3 Portfolio Manager computes the predicted source EUI
- Using the property use details from Step 1, Portfolio Manager computes each building variable value in the regression equation (determining the density as necessary).
- The centering values are subtracted to compute the centered variable for each operating parameter.
- The centered variables are multiplied by the coefficients from the regression equation to obtain a predicted source EUI.
| Variable | Actual Building Value | Reference Centering Value | Building Centered Variable | Coefficient | Coefficient x Centered Variable |
|---|---|---|---|---|---|
| Constant | - | - | - | 1.824 | 1.824 |
| Natural Logarithm of the number of months the main rink is open | 1.609 | 2.017 | -0.408 | 1.541 | -0.6297 |
| Weekly ice resurfacings per rink | 20.00 | 53.19 | -33.19 | 9.55E-03 | -0.317 |
| Number of spectator seats per 100 m2 | 20.00 | 23.20 | -3.200 | 0.0117 | -0.0376 |
| Number of FTE workers per 100 m2 | 0.0300 | 0.1350 | -0.105 | 2.574 | -0.270 |
| Percent of the facility that is covered in ice | 43.75 | 44.98 | -1.230 | 1.028E-02 | -0.0126 |
| Heating degree days | 6,097 | 5,107 | 990.0 | 1.07E-04 | 0.1058 |
| Cooling degree days | 89.00 | 131.12 | -42.12 | 9.97E-04 | -0.042 |
| Number of curling sheets | 4.000 | 0.561 | 3.440 | 3.890E-02 | 0.1339 |
| Predicted Source EUI (GJ/m2) | 0.755 | ||||
4 Portfolio Manager computes the energy efficiency ratio
- The ratio equals the actual source EUI (Step 2) divided by predicted source EUI (Step 3).
- Ratio = 0.684 / 0.755= 0.906
5 Portfolio Manager uses the efficiency ratio to assign a score via a lookup table
- The ratio from Step 4 is used to identify the score from the lookup table.
- A ratio of 0.906 is less than 0.9105 but greater than 0.9016.
- The ENERGY STAR score is 55.