
Helping communities prepare before water rises
April 2026
By Laura Thomas for Natural Resources Canada and Simply Science
By noting potential flood risks before the water rises, flood hazard maps provide practical tools to help people make informed decisions about where and how they live. Behind every one of these maps is a story of people, data and science working together to answer a simple but urgent question: Where will the water go next?
Understanding flood risk is no longer something that’s simply “nice to know.” It’s one of the most important ways scientists and communities can work together to protect homes, infrastructure and each other — long before the water arrives.
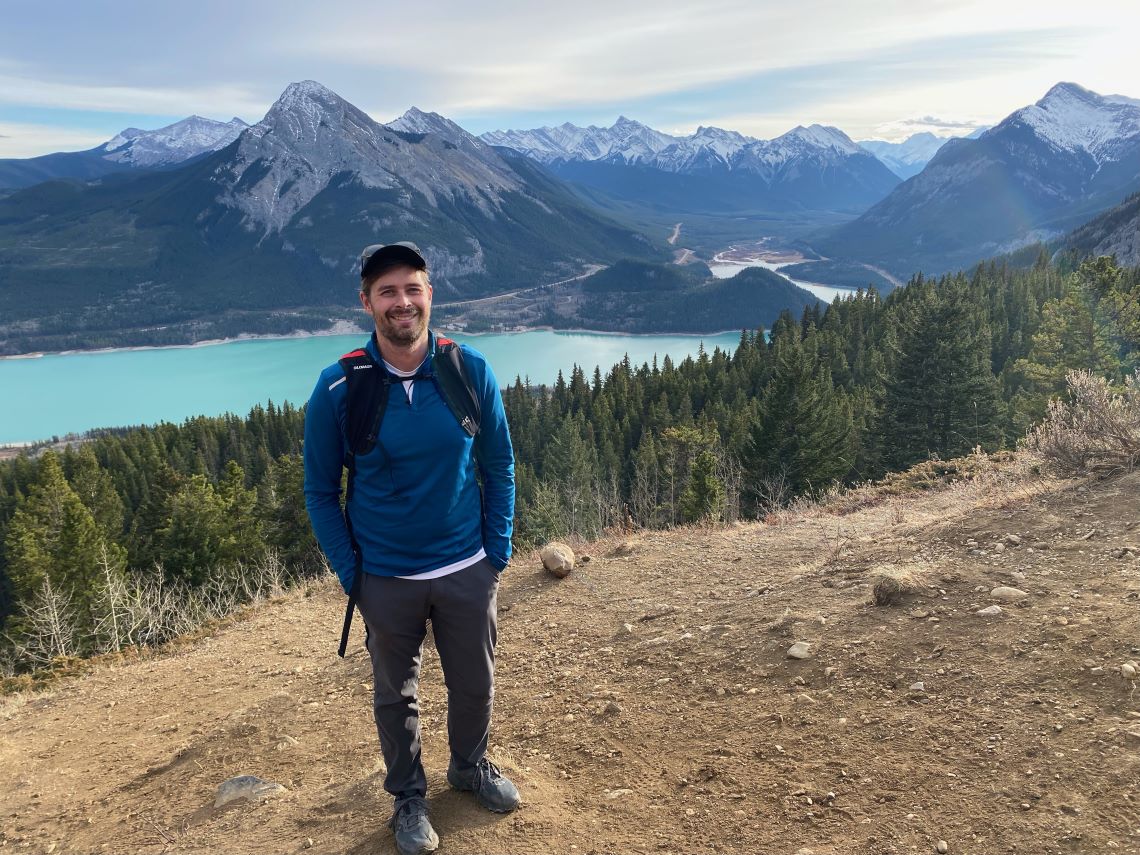
NRCan scientist Brian Perry on a field excursion in Alberta.
Seeing flood risk before it happens
Flooding is Canada’s most common and costly natural hazard. Yet many people don’t know their community could be at risk.
“Places will flood, whether we have a map or not,” explains Natural Resources Canada (NRCan) scientist Brian Perry. “A flood hazard map doesn’t create a flood plain on the landscape. The purpose of these maps is to inform Canadians where the risks are and how to prepare for floods.”
Floods are shaped by far more factors than rising water levels. Land, soil, vegetation, weather patterns, infrastructure and even what lies under the water’s surface influence how water moves. While flood mapping has existed for decades, the science behind it has advanced significantly. Improved data collection, faster computing and better climate models now allow scientists like Brian to understand flood behaviour in ways that were impossible only a generation ago.

NRCan scientist Maxim Fortin conducts a field survey using high-precision GPS equipment to collect elevation data.
Across the country, scientists, engineers and communities combine detailed datasets, advanced models and local observations into clear flood hazard maps that translate complex science into practical, ready-to-use information. At NRCan, Brian works alongside Charles Papasodoro and Maxim Fortin — whose expertise spans elevation data, modelling and quality control — to gather and process the data so land-use planners and governments have the information they need to create accurate maps for their communities.
Collecting the data
Every flood hazard map starts with a simple question: What does the land really look like?
To answer it, high-resolution landscape data is collected using lidar. This light detection and ranging technology sends laser pulses from an aircraft toward the ground and measures how long it takes for them to return, resulting in the creation of a precise 3D picture of the land surface, accurate to within five to 10 centimetres.

A plane using Lidar to map elevation data.
Charles leads a team that ensures this elevation data is consistent and reliable. Lidar can detect ground elevation even beneath thick vegetation, producing a clear picture of the terrain. These surveys generate billions of data points, forming a 3D point cloud of the landscape. Using advanced algorithms, these points are analyzed and classified — for example, as representing ground, vegetation, buildings or water — and then used to generate a digital terrain model, which provides the key input for modern flood modelling.
“Our goal is simple,” explains Charles. “We want consistent, accurate and up-to-date elevation coverage across the country. Even small elevation differences can determine whether water flows toward a house or away from it.”
Today, high-resolution elevation data for the most populated areas of Canada is publicly available through the High-Resolution Digital Elevation Model (HRDEM) and the HRDEM Mosaic.
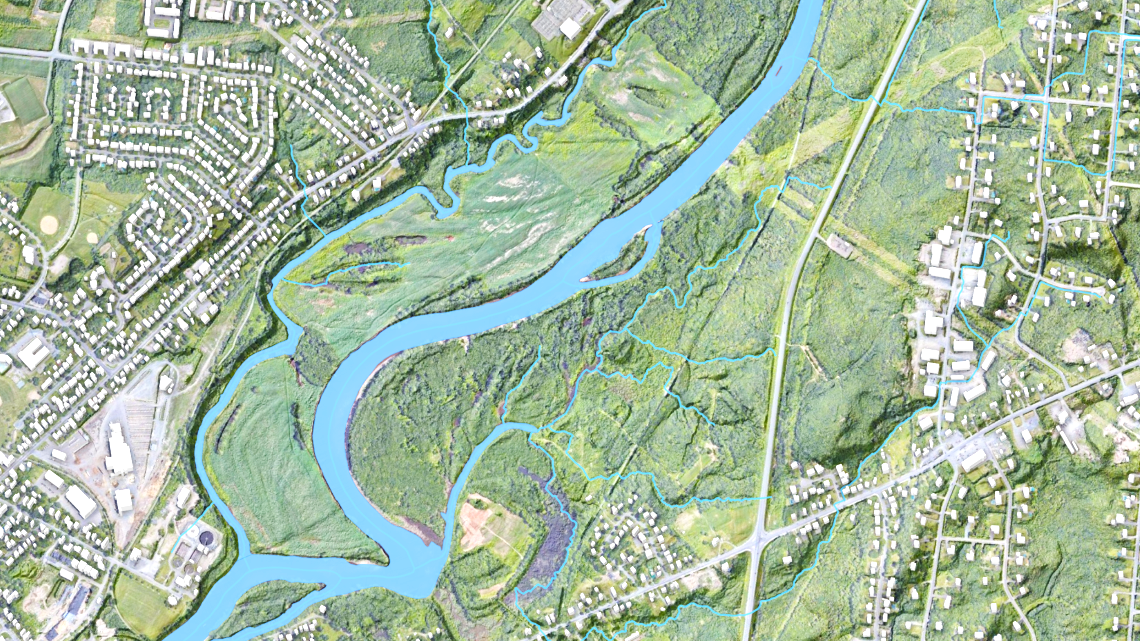
A high-resolution elevation data map of a river in New Brunswick.
Following the water
Once Charles’s team says the elevation data is ready, the next question is for Brian and Maxim: “What if?”
The next step is the modelling work, building flood simulations that recreate how water would move across the landscape under different conditions. Elevation is only one part of the picture. Models also include land cover and land use, infrastructure such as roads and bridges, and bathymetry — the depths and contours of lake, river and ocean bottoms. In many places, survey teams measure river depths directly to ensure accuracy.

NRCan scientist Charles Papasodoro.
With today’s computing power, scientists can simulate complex interactions between water, land and infrastructure in remarkable detail, revealing how floods are likely to behave before they happen.
How much water is there?
Using historical rainfall records, snowmelt patterns, stream gauge data and simulated storm events, scientists estimate how much water could enter a system during scenarios ranging from common storms to rare, extreme events.
Where does the water go?
Advanced computer models simulate how water moves through rivers, floodplains, streets and neighbourhoods. Different models are used to assess the effects of coastal storm surges, river and lake flooding, and ice-jam flooding during spring melt.
Turning flood science into maps people can use
All this science comes together in a flood hazard map. These digital maps show where flooding could occur under different scenarios, translating the raw data of elevations and other inputs into clear, practical information for communities and decision-makers. Provinces and territories identify priority areas based on flood history and risk and lead the local flood mapping work in close collaboration with federal partners.
Flood hazard maps help governments, planners and communities understand which areas may flood. With these maps, decision-makers can better decide where to build infrastructure and where new development should — or should not — take place. These maps also support emergency planning, helping communities identify flood-prone areas, plan evacuations or other responses and prepare for future floods before they happen.
Community engagement is critical. Local knowledge — including memories of past floods, first-hand acquaintance with problem areas and lived experience — helps validate and improve the maps.
Once complete, flood hazard maps are shared online through public portals. The Canada Flood Map Inventory helps people find out where maps have been developed and how to access them.
Building flood awareness to keep communities safe
Floods have always been a part of Canada’s landscape. What’s changing is our ability to see their potential risks more clearly before the water rises.
Behind every flood hazard map is a network of scientists, engineers, technicians, local governments and community members working toward the same goal: helping people understand the risk and stay safe. When science and local knowledge come together, invisible risk becomes visible — and communities are better prepared to face the future with confidence.
Discover more:
How flood maps help protect communities (video)
Mapping a Flood: Every minute counts