
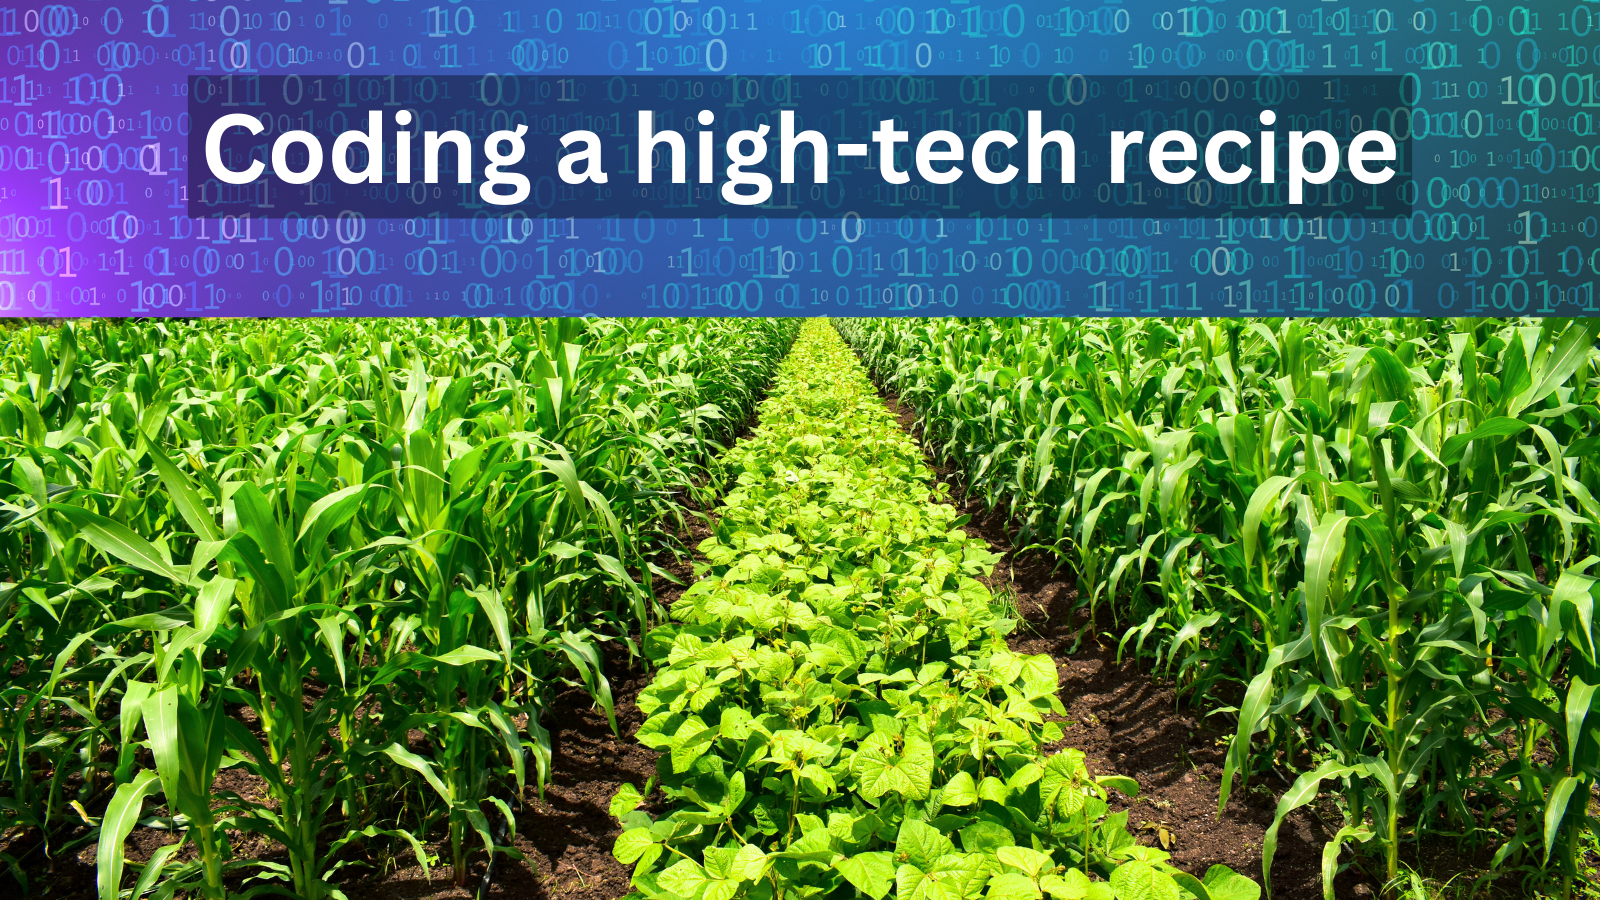
Keeping track of growing conditions affecting Canada’s agricultural crops is essential for planning purposes. Scientists rely on satellites to tackle this crucial task with precision. The advanced computer programs that make all this happen are created with intricate coding, the latest technology and plain hard work.
November 2023
You’ve probably seen stories about how extreme weather, droughts and floods can impact agricultural crops, resulting in unpredictable harvests, crop damage and even insufficient water for livestock. But here’s the untold story: teams of experts are working behind the scenes, harnessing the power of satellite data to image Earth’s surface. They can monitor changing conditions in near real time, allowing people to make smart decisions quickly.
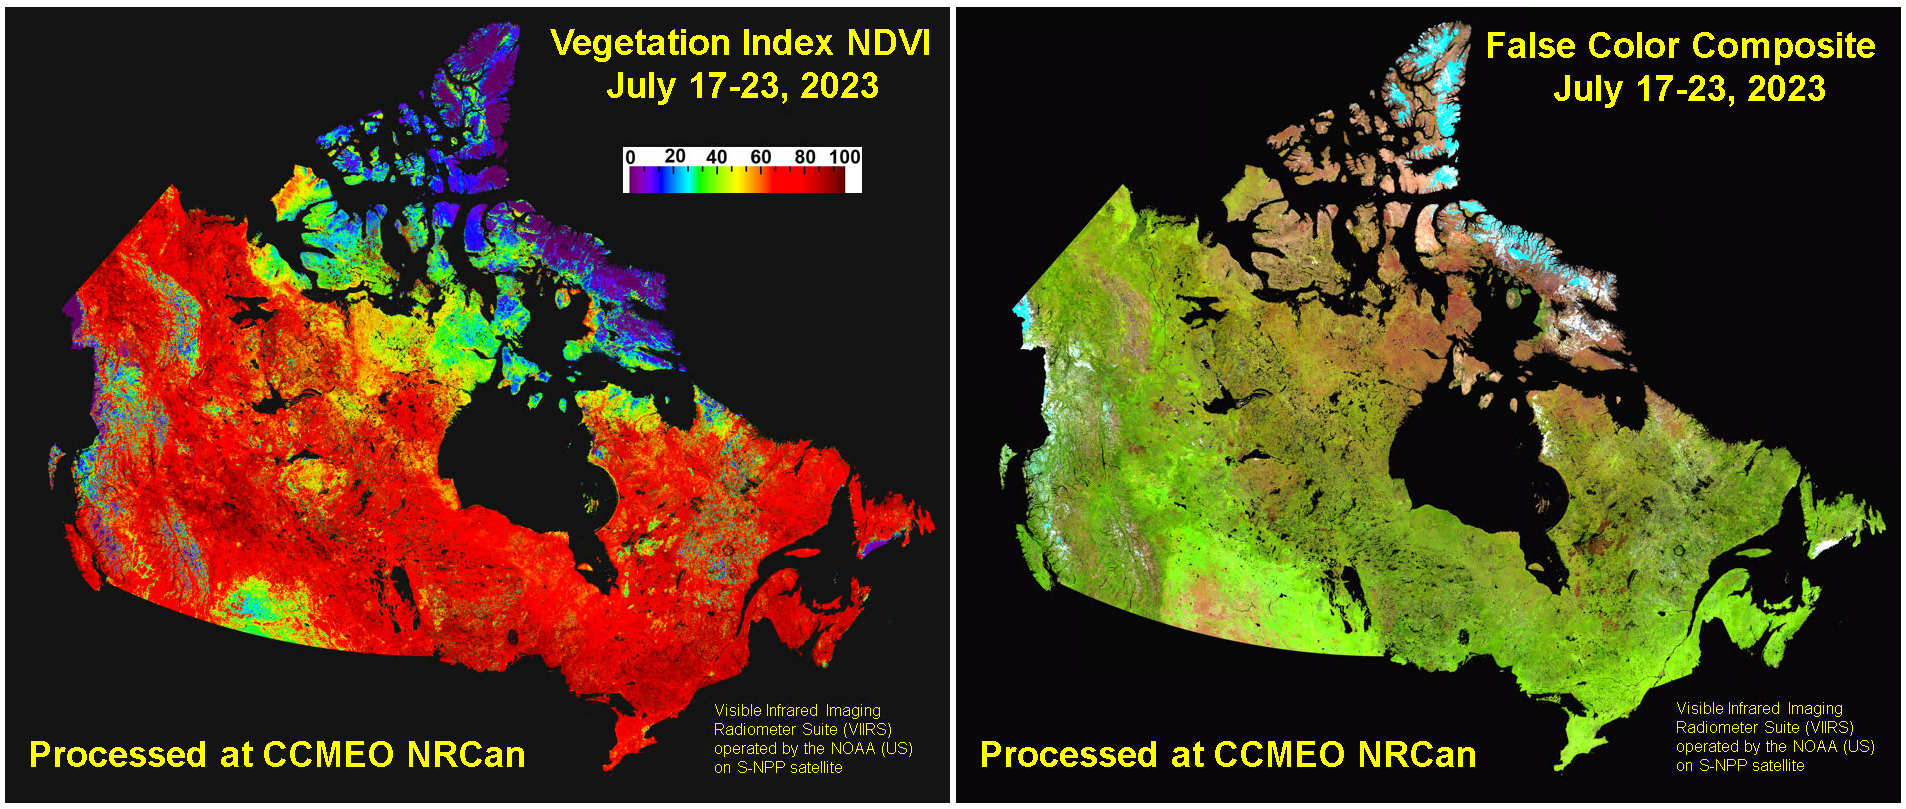
Vegetation Index map of Canada and a false colour composite image produced for this project July 2023.
Providing crucial service
During the growing season in Canada, Agriculture and Agrifood Canada (AAFC) and Statistics Canada (StatCan) rely on Vegetation Index maps that use satellite images to estimate how green, dense and healthy vegetation is. These maps, released every week, are used by industry experts and farmers to monitor and forecast crop yields. For example, imagine a crop in one area is experiencing extreme drought or massive rainfall. With the help of the Vegetation Index, experts can be ready to redirect water resources if needed. These accurate forecasts are also used by the insurance industry to assess risk, international and national food agencies to secure supplies and economists to forecast grain resources for markets at home and abroad.
When AAFC learned that the satellite system they use to create these crucial images would be retired soon, it teamed up with a group of experts at Natural Resources Canada (NRCan).
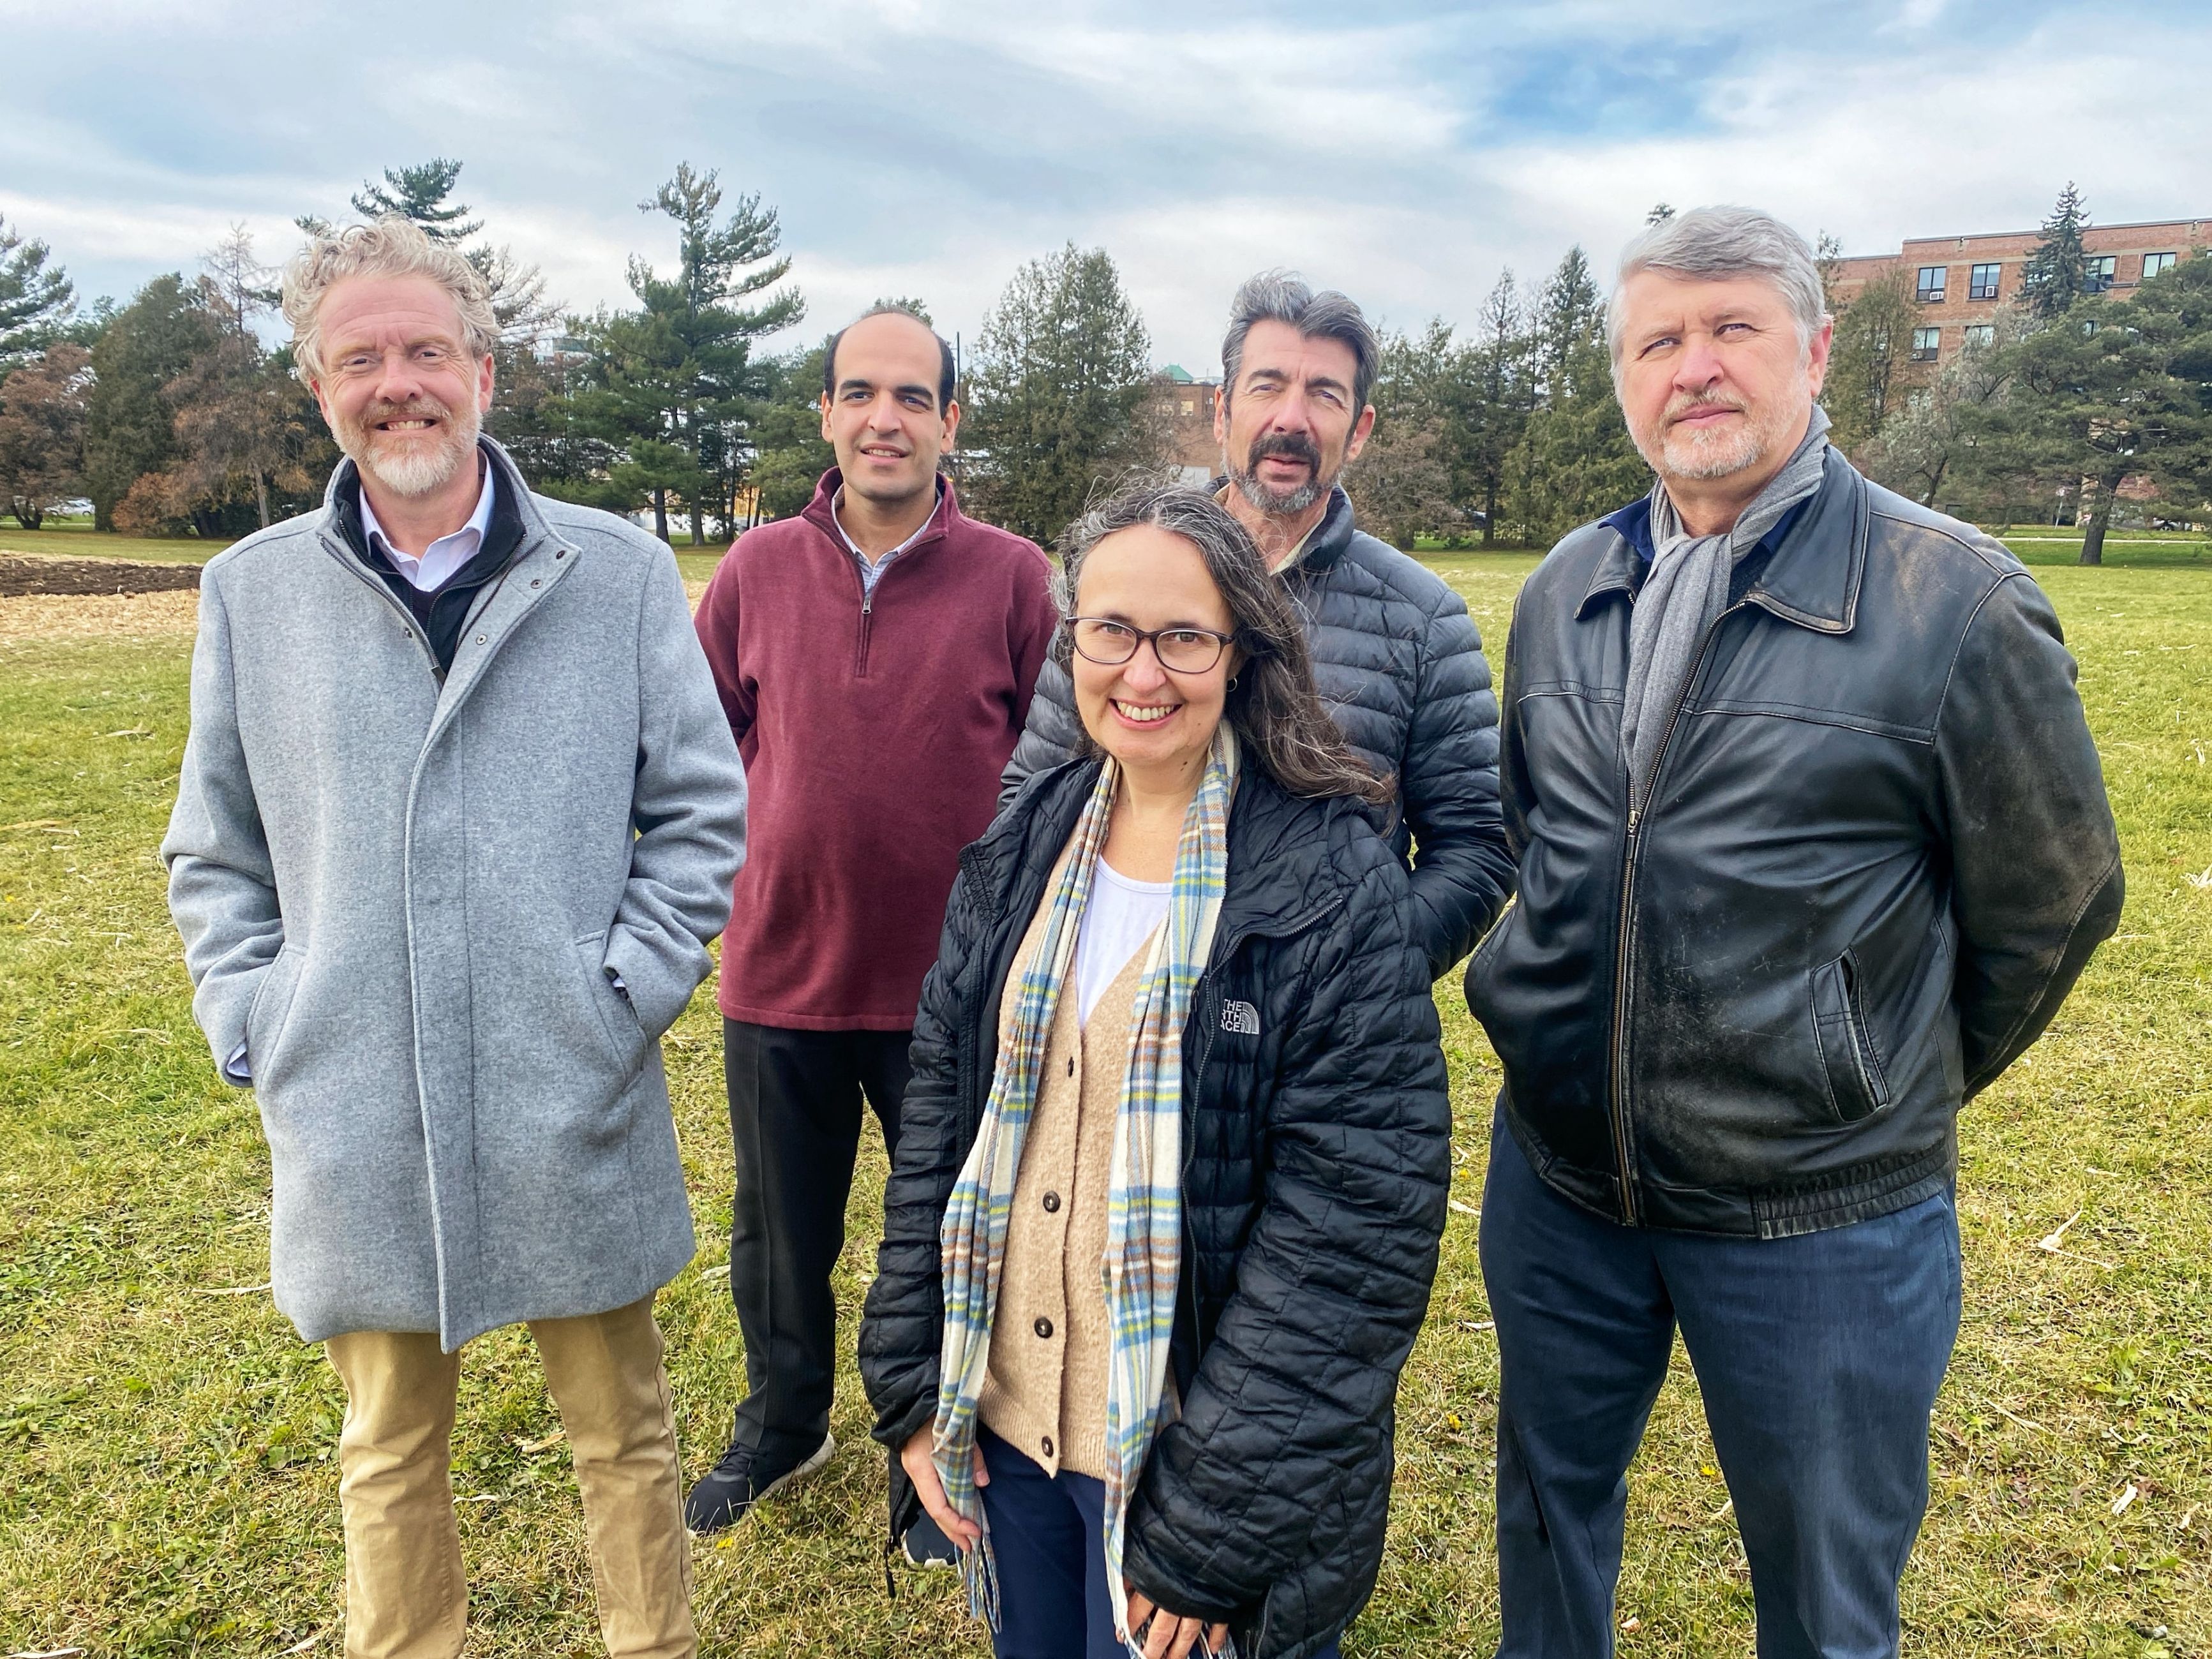
The core team, from left to right: Andrew Davidson, Associate Director, AAFC Centre for AgroClimate Geomatics and Earth Observation; Shaheen Ghayourmanesh, Remote Sensing Scientist, NRCan; Catherine Champagne, Agri-Environmental Scientist, AAFC; Calin Ungureanu, Environmental Scientist, NRCan; and Alexander Trichtchenko, Research Scientist, NRCan. (Absent: Yinsuo Zhang, Biophysical Modeller, AAFC).
A very short shortlist
“The scientists at NRCan’s Canada Centre for Mapping and Earth Observation (CCMEO) have a long history of excellence in turning satellite signal data into actionable information,” says Catherine Champagne, an agri-environmental scientist at AAFC who has experience in remote sensing. “We approached them because they are the top experts in the world in this field.”
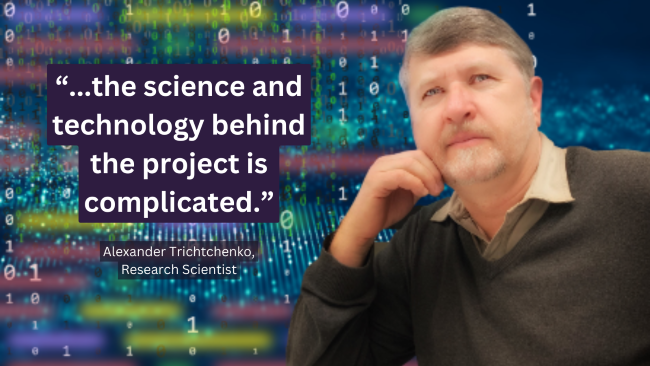
Alexander Trichtchenko
CCMEO experts develop highly specialized products for tracking floods, monitoring climate change and keeping tabs on forest coverage, among other things. But this assignment was different. The team had to build a completely new system to work across many different applications and transition from one satellite platform to another.
CCMEO research scientist and project lead Alexander Trichtchenko is known for transforming satellite data into maps showing snow and ice maps, among other projects. He welcomed this new challenge. At first glance, the Vegetation Index maps appear straightforward. People might simply look at the images and see how green an area is or how intense the vegetation looks and think that’s all there is to it.
“But the science and technology behind the project is complicated,” says Alexander. Vegetation Index maps need to be delivered at a precise time every week, like clockwork. Yet to produce one single image, many thousands of input files need to be processed accurately and consistently, every day, all day.
Making sure the transition from one satellite service to another goes seamlessly is a complex job. “It’s a different satellite, orbiting Earth on a different schedule and sending the imagery in a new, complicated format,” explains Alexander. “Our role was to provide the expertise to access useable data and build a new computer system capable of processing and analyzing a myriad of pixels of information automatically and not miss a beat.”
Starting from scratch
“This is a big win for us because we can leverage the expertise at NRCan on satellite data processing and focus our efforts on the yield and drought monitoring,” says Catherine.
Transforming satellite data into real useable information is an intricate process. The small NRCan team rolled up their sleeves to decode and rethink the techniques and experience they had gathered over decades. Reams of new algorithms had to be developed, and data flows had to be reprogrammed. And since all data formats and sensor properties were going to be different, they had to develop new technology to sync with the new satellite sensor. At the same time, the final products needed to be consistent with the earlier system.
Alexander took on the task of coding, while his colleague Calin Ungureanu handled the automation and Shaheen Ghayourmanesh, a relative newcomer to the team, took care of the operational part of data processing. The new system was tested during the 2023 growing season and will be upgraded to continue operations when the growing season begins March 2024.
The data crunching code for the new automation system consists of more than 50 different routines with a total length of more than 10,000 lines of code.
It all begins with coding. Think of it like creating an incredibly complex recipe. The ingredients in this case can be numbers, text or other data. Routines are like different recipes, while lines of code are specific steps in a recipe.
The data crunching code at the heart of the new automation system developed by the CCMEO team has more than 50 different routines, with a total length of more than 10,000 lines of code. Using the recipe analogy, it’s like having 50 different recipes with more than 10,000 lines of instruction. And that’s just to automatically crunch the image data from tangled scanlines of raw data into usable maps!
Another key step is programming the system so it can run automatically. Automating the system involves nearly 400 routines and 8,500 lines of developed code. One tiny glitch — like a typo in the code or an oversight in the programming — could put the processing on hold. “While the entire system is designed to be the fully automated,” says Alexander, “it will always require close monitoring because there are many things beyond our control.”
Once the system is up and running, about 4,500 input files, or granules, will be processed every day, with a total data volume of around 250 gigabytes. This is roughly one-quarter of a terabyte and, quite simply, a massive amount of data.
“Our primary challenge is meeting our delivery schedule,” says Alexander. “This requires transferring output files to users every Wednesday morning, even in the face of network outages, IT system upgrades, data archive maintenance, satellite or sensor anomalies.” This year during testing, they had to switch the input data stream from the main satellite to a backup satellite on a few occasions, with no breakdown in service.
“The system we've developed is designed to be flexible and capable of handling these challenges, ensuring uninterrupted data delivery,” Alexander points out.
Test, test, test and then test again
There has been a lot of back-and-forth testing between NRCan, evaluating the new processes, and AAFC, checking to see how these changes affect their models. It’s important to be certain that the data from the new satellite is consistent with the data from the older satellites, and that any changes in predicting in crop yields are real and not the result of differences between the satellite sensors.
“It was worth the effort though,” says Catherine. Already this year during the testing, AAFC was able to make use of the data directly and provide critical estimates of crop health, an important milestone in a year with very dry conditions in many areas of Western Canada.
Invisible and seamless
Even though the system will be more advanced, most people won’t notice the change — and that’s a good thing, because it shows that AAFC and NRCan are continuing to provide high-quality information. This collaboration shows how teams with different but complementary scientific skills can work together and create content that impacts so many Canadians. As for Alexander, he’s already working ahead on other projects, but this one is special because he sees the real-life impact of his science in near real time, which isn’t always possible in the world of science.
Side bar: Technical specifications:
The Moderate Resolution Imaging Spectroradiometer (MODIS) is a satellite-based sensor that operated onboard TERRA and AQUA spacecraft for more than 20 years. It’s being replaced by a new sensor called the Visible Infrared Imaging Radiometer Suite (VIIRS). It’s operated by the US National Oceanic and Atmospheric Administration (NOAAS) with support from the US National Aeronautics and Space Administration (NASA).
Since all data formats and sensor properties have been updated on VIIRS, programmers also needed to start from scratch to ensure the new products produced by VIIRS would be compatible with what had been produced by MODIS.
VIIRS works on three spacecraft: the Suomi National Polar-orbiting Partnership (Suomi NPP); the Joint Polar Satellite System (JPSS-1) or NOAA-20; and JPSS-2/NOAA-21.
Discover more:
Remote sensing sensors and methods
Satellite imagery and products
Agriculture in the satellite age
Canadian Crop Metrics