
Innovative 3D models and virtual reality (VR) tools are helping define how future geoscientists and geological engineers will visualize — and interact with — the geology and groundwater resources of one of the country’s most populous regions.
Stretched between Quebec and Michigan along the shores of three Great Lakes, southern Ontario occupies a relatively small part of its namesake province. Yet it’s the most densely populated region of Canada, contributes one quarter of the country’s gross domestic product and has a resource-rich geology reflecting more than a billion years of Earth history.
For those reasons and others, ensuring southern Ontario’s long-term water resource sustainability matters. That’s why Hazen Russell — a scientist with the Geological Survey of Canada’s Groundwater Geoscience Program — spent a good part of 2015 trying to figure out how to help decision makers better manage the region’s sedimentary basin resources, particularly groundwater.
“I had no idea it would lead to digital models and virtual reality,” says Hazen. “It’s been an exciting journey getting to where we are today.”
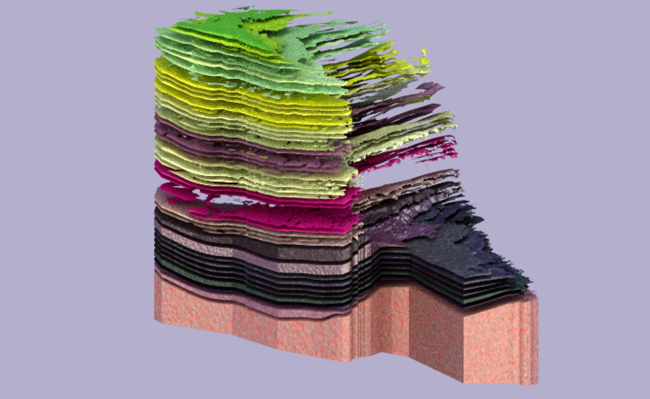
Southern Ontario’s multilayered geology represented in virtual reality — from the Precambrian Shield (pink) upward through petroleum-, salt- and water-bearing layers (purple, yellow, green). The Niagara Escarpment is visible along the right-hand edge. Lake Erie and Lake Ontario would be in the foreground if shown.
The need for something new
Hazen wondered how to represent, in a usable way, the vast amount of available data on southern Ontario’s geological and groundwater resources. He knew that any tool or framework would have to be multipurpose.
“Millions of people rely on southern Ontario’s groundwater resources,” Hazen says. “The region is also a major salt and aggregate producer. Its geology is used for gas storage, and people are now thinking about hydrogen storage, nuclear waste and carbon sequestration. There are a lot of interests and decisions to support.”
Russell invited Terry Carter, chief petroleum geologist at Ontario’s Ministry of Natural Resources, to help develop a modern, 3D geological and hydrogeological model of the region.
“I was literally two weeks away from retirement,” Terry recalls. “But this was exciting and important. I couldn’t say no.”
Hazen and Terry brought in two additional collaborators: the Oil, Gas and Salt Resources Library, a not-for-profit resource centre that holds thousands of geological samples and documents, and the Ontario Geological Survey.
Building the first model
Traditional geological models were built as dioramas: expensive, handmade physical representations that travelled badly, if at all. Hazen and Terry wanted to combine the 3D visuals of a diorama with the portability and analytical capabilities of digital technology.
“There were other digital 3D models of southern Ontario, but they focused on single formations or highly localized areas,” says Jordan Clark, manager of the Oil, Gas and Salt Resources Library. “Hazen and Terry wanted to go beyond that and model all the formations in the region.”
An approach on that scale added a significant degree of complexity. Terry and his team constructed a comprehensive digital model with 55 distinct layers using data from more than 20,000 boreholes. The first build took three years.
The fully digital model marked a leap forward in visualization, enabling researchers to interact with subsurface geological units. Yet it proved hard to use, especially as a teaching tool — something professors John Johnston of the University of Waterloo and Heidi Daxberger of the University of Toronto (Scarborough) learned when they piloted it in their classrooms.
“We tested it with undergraduate university students, and they couldn’t work with it,” says Professor Johnston. “They didn’t have the geological knowledge or spatial reasoning to make sense of what they were seeing.”
Since the project team wanted the model to be usable by non-specialists, they went back to the drawing board.
From digital to dowels and back again
Professor Johnston built a simple analog version of the model using a 2D map and wooden dowels to help get students’ heads around the concept.
“It’s hard to jump into the virtual world if you haven’t developed your ability to understand dimensional relationships,” he says. “Many people need the tactile experience of a physical 3D model first.”
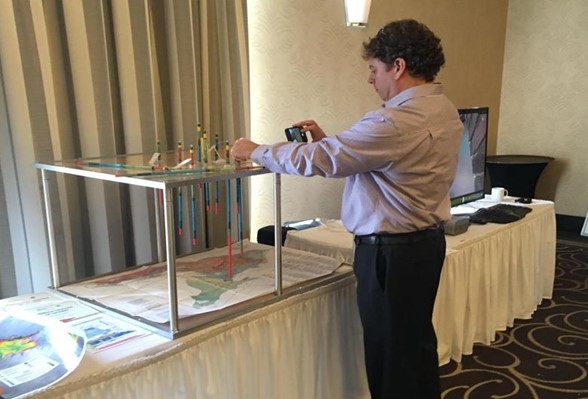
Wooden dowels set onto a 2D map approximate the digital model in a tactile way.
Professor Daxberger gave her students drill hole data and got them to draw 2D views. “I had them do a top view and a side view, and then they could start to see the shape and relate that to what the 3D model was showing.”
Meanwhile, Jordan’s team worked on simplifying the digital 3D model. Over the course of three years, they generated two new versions, the latest with just 15 layers and deep groundwater sources included. They also explored other visualization technologies: virtual reality (VR), augmented reality (AR) — which superimposes digital imagery over real-world environments using smartphone cameras and other technologies — and 3D printing.
“Each format has its advantages,” says Jordan. “VR lets you experience the landscape. The 3D printed model is powerful because people are inherently tactile learners, and you can hold the landscape in your hands. That one has the biggest impact and prompts the most extensive conversations.”
Professor Johnston found that to be the case when he presented the printed model to a cycling club in Niagara Falls. “Seeing the entire 3D model in printed layers lets learners form a complete mental picture and brings more context to their observations,” he says. “When I showed it to the cyclists, they were hooked. They started asking all kinds of questions about the landscapes they ride over on their bikes.”
The new digital models also bring unprecedented efficiency to researchers’ activities.
“Anyone can instantly see what’s next to a borehole and assess the potential impacts of drilling or extraction,” Terry explains. “You get a large-scale view of how water moves under the region, where there’s sulphur water that could corrode metal structures, where to find brines with potential resource value — all kinds of details.”
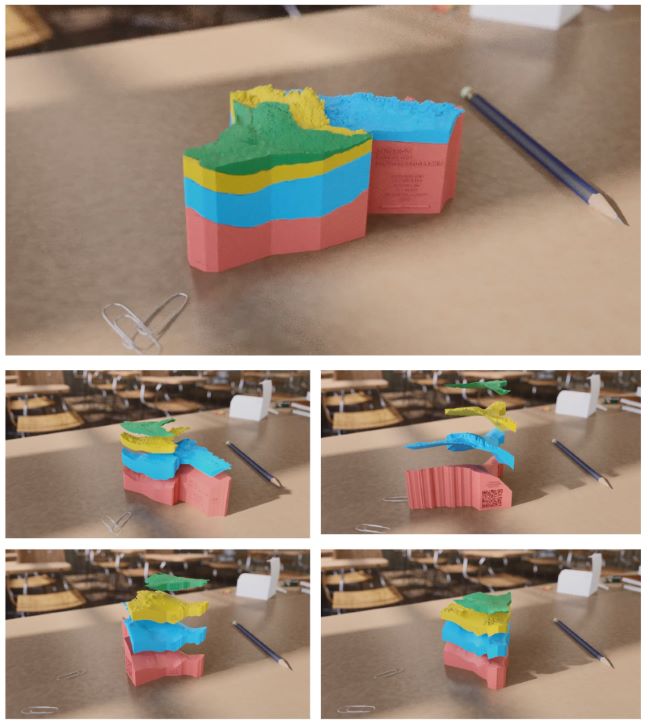
The 3D print model has four separable layers, with pink representing the Canadian Shield and the blue, yellow and green layers showing Cambrian–Ordovician, Silurian and Devonian rocks, respectively. The blue has carbon storage potential. The city of Guelph’s water supply is held in the yellow layer, where salt mining also occurs.
Proven to work
Professors Johnston and Daxberger have integrated the updated model versions into their classrooms. Two of Professor Johnston’s students have written theses on the subject, one confirming the models’ educational value and the other proposing a learning framework for using them.
Going forward, the collaborators aim to further advance their use of 3D and VR — and to add AR to the mix.
“AR is more accessible than VR,” Jordan says. “With VR there’s a learning curve, and some people get vertigo wearing the headset. All AR requires is a smartphone or a tablet.”
Clark says another advantage of AR is that it can be used in combination with physical 3D printed models to enhance people’s interactions and learning opportunities — even embedding QR codes in the printed piece that link to other information.
The University of Toronto is now setting up its own VR lab and, as a spin-off of the modelling project, Professors Daxberger and Johnston developed a web resource on the geology of southern Ontario. The resource was funded by the Geological Survey of Canada and built using ArcStory Map, an application that lets users share maps with text and multimedia content. That resource will also be part of a collaboration with the Association of Professional Geoscientist Education Foundation of Ontario, which is dedicated to advancing science communication, education and outreach on the geology of southern Ontario.
“It’s exciting to see all the directions this has led to — on top of creating tools that literally put geological knowledge in anyone’s hands, anywhere,” says Professor Daxberger.