
A sky-high milestone achieved: over a million square kilometres of elevation data now available!
Our elevation datasets are growing! This very detailed 3D information provides essential foundational geospatial data for many government projects and priorities, like flood mapping, forest inventories, climate change monitoring, and urban management.
Check out the changes in our four main elevation products below.
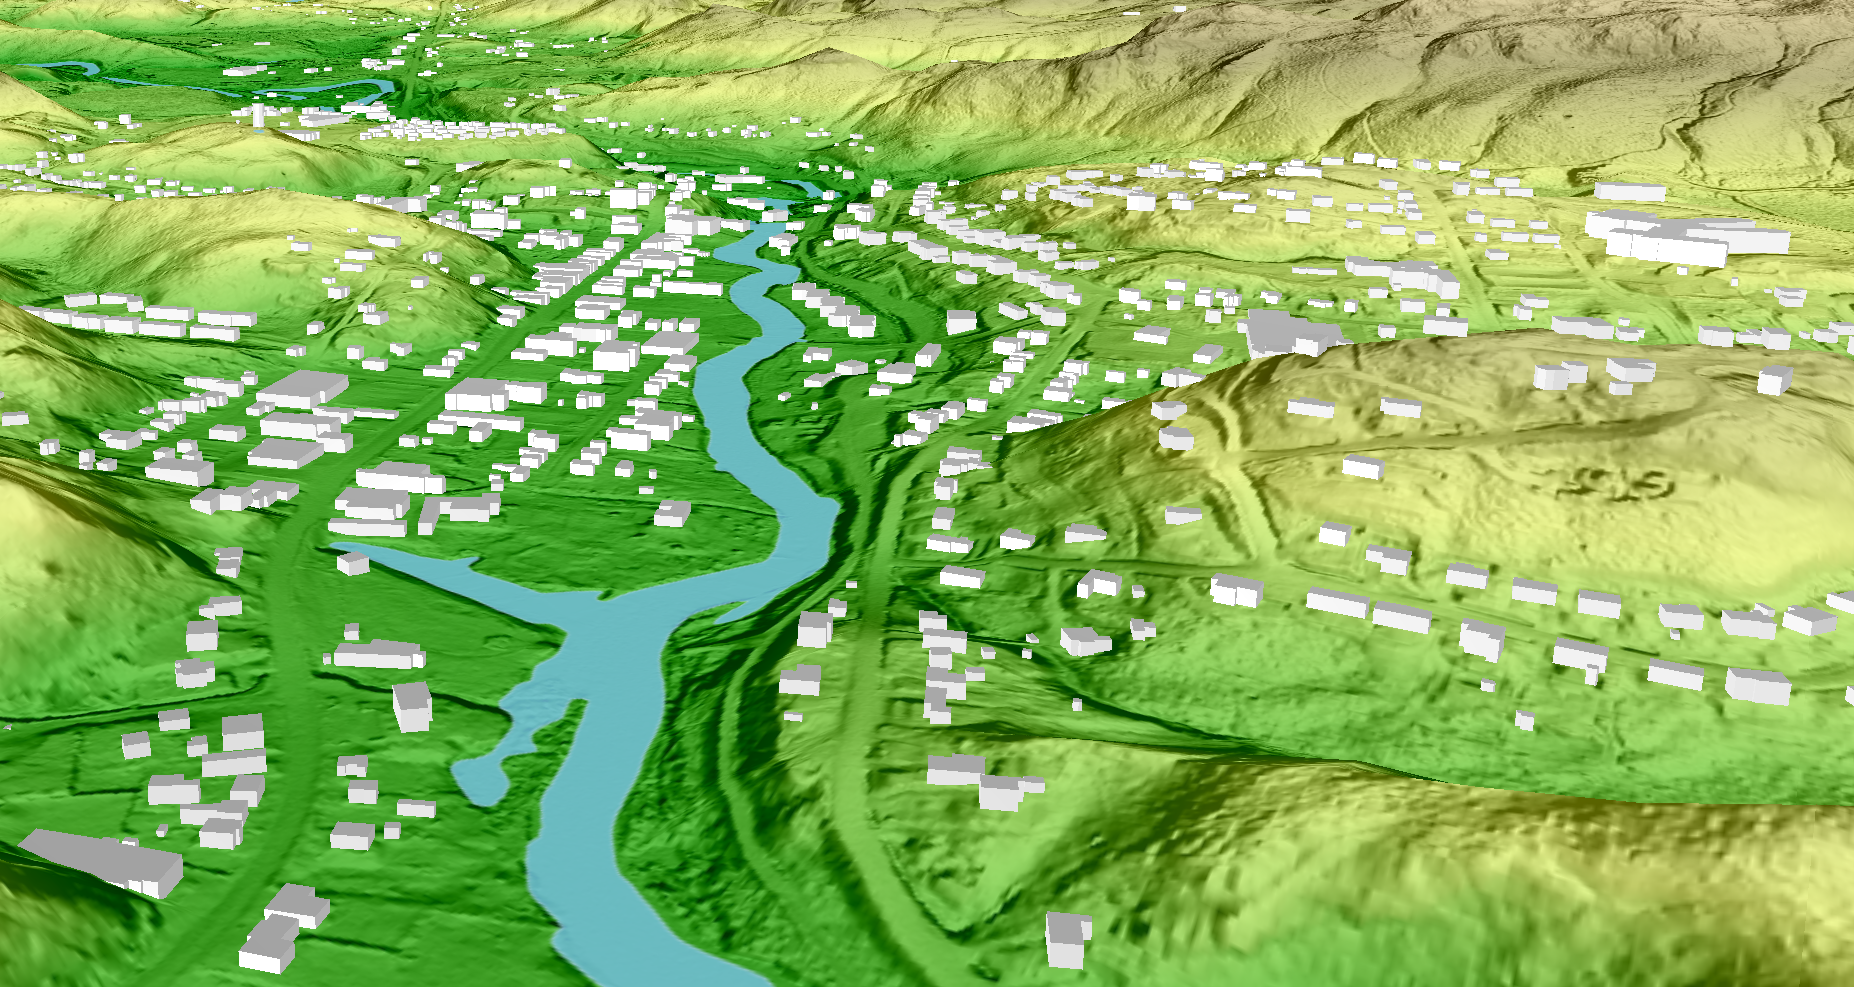
Colored shaded relief of a digital terrain model derived from LiDAR. 3D buildings derived from LiDAR and hydrography features from the National Hydro Network are superimposed. The image covers the city of Bancroft, ON
High Resolution Digital Elevation Model Products (HRDEM)
Over 244,000 km2 of LiDAR-derived elevation data have been released on Open Maps to add to the HRDEM and HRDEM Mosaic products. This new release is surpassing a milestone of 1,034,000 km2! This new data is in:
- Alberta
- British Columbia
- Manitoba
- Northwest Territories
- Ontario
- Quebec
- Saskatchewan
- Yukon
With this new data release, over 36.6 million Canadians–92% of the population–lives within the region covered by the HRDEM and HRDEM Mosaic products. Now, 95 of the country’s 100 largest cities are covered by these two products. The LiDAR data used comes from many partners across the country, as well as from acquisition projects performed by NRCan over 2022, including through funds from the Flood Hazard Identification and Mapping Program.
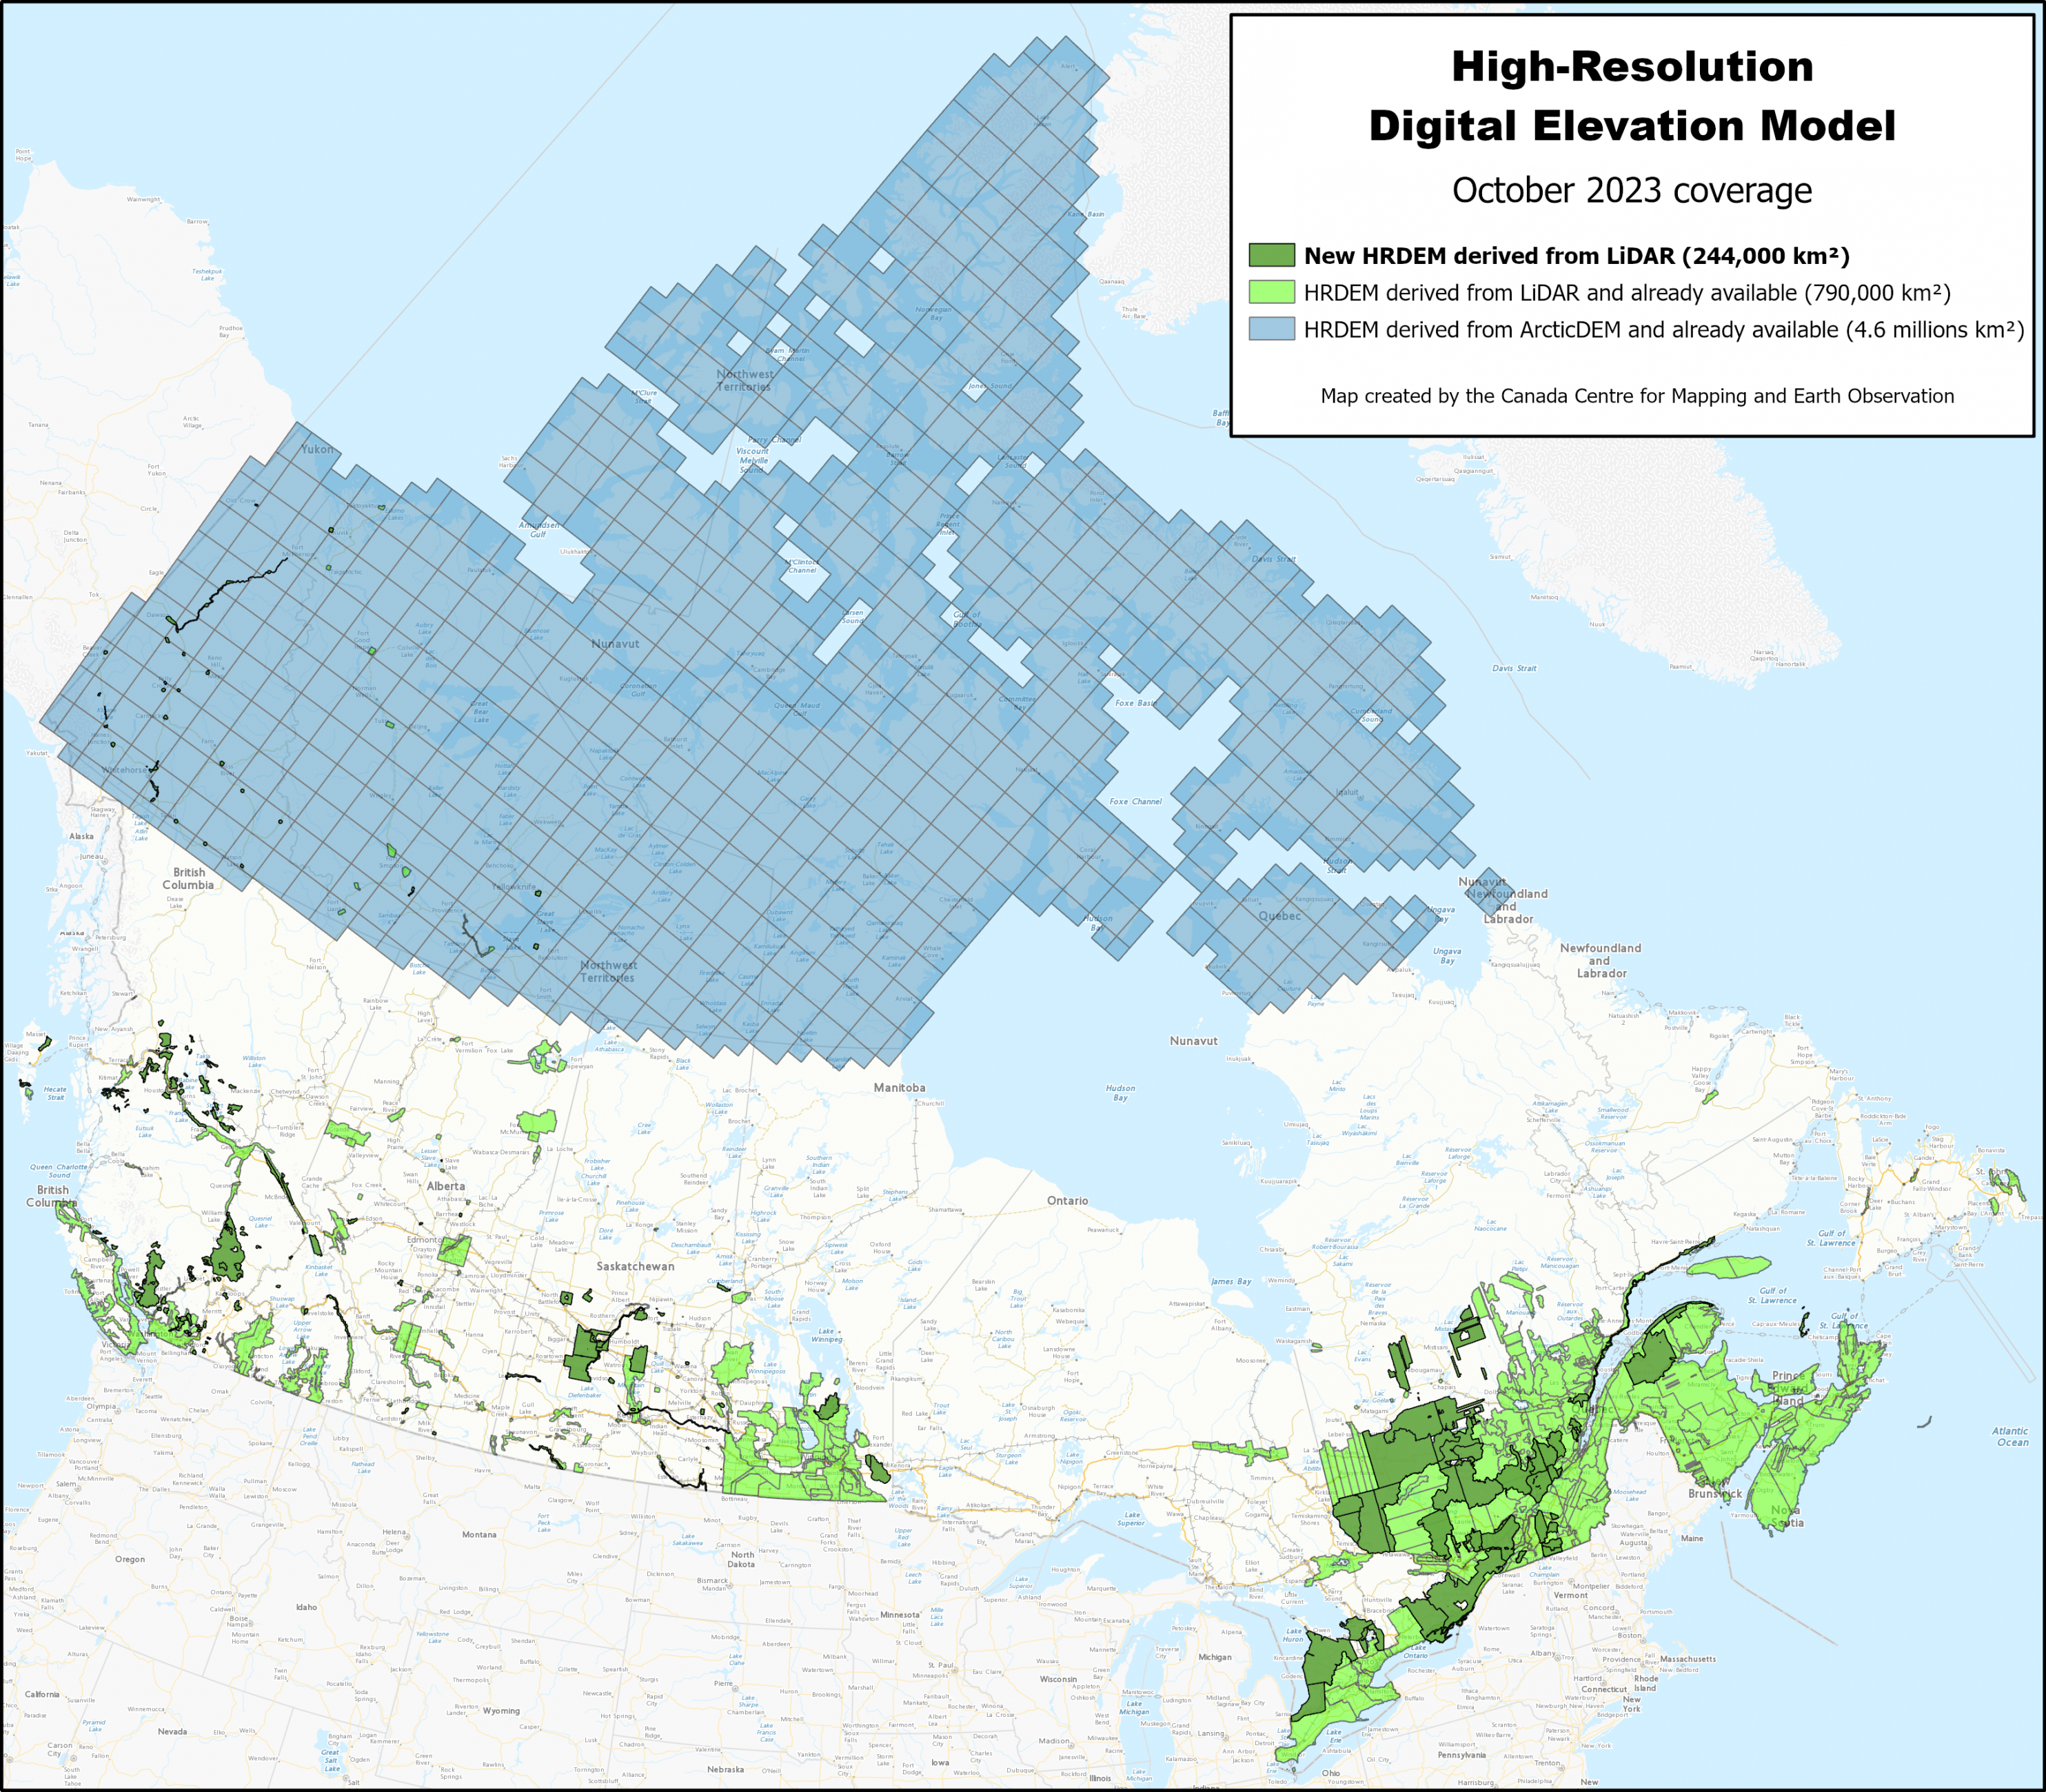
HRDEM and HRDEM Mosaic products coverage in October 2023
Improved dissemination of HRDEM and HRDEM Mosaic products
In addition to increased coverage, there is now a new way to access the HRDEM product. Mosaics by LiDAR projects in Cloud Optimized GeoTIFF (COG) format are now available in Lambert Conformal Conic projection. The COG format enables efficient data distribution, as compatible tools and software can now remotely access only the portions of the data they need, simplifying data management and improving access times. For more information on this new feature, see the product specification.
To facilitate browsing through the HRDEM product, the HRDEM web services URL and symbology have been changed. You can access the new URL using the links available on the product or by browsing here. The download guide provides more details on the various methods for accessing HRDEM product data.
The HRDEM Mosaic can now be accessed and extracted for specific areas through NRCan’s Geospatial Data Extraction Tool. In addition, the access guide provides more details on the various methods for accessing the HRDEM Mosaic product.
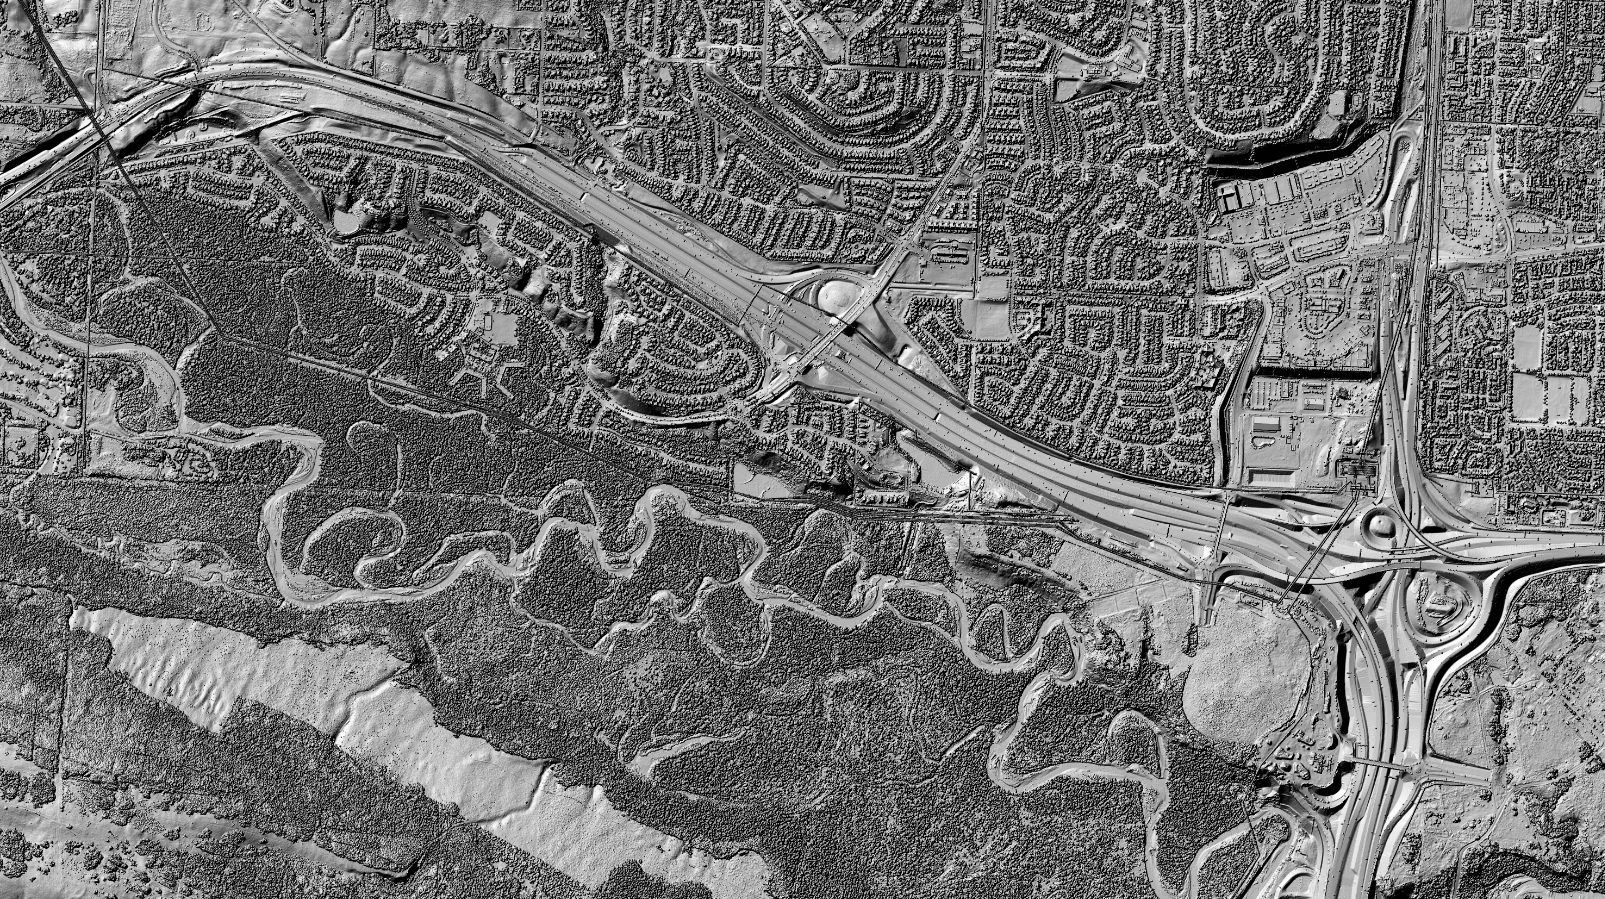
Shaded 3D reliefs of the Digital Surface Model (top image) and the Digital Terrain Model (bottom image) covering an area of the City of Calgary, AB.
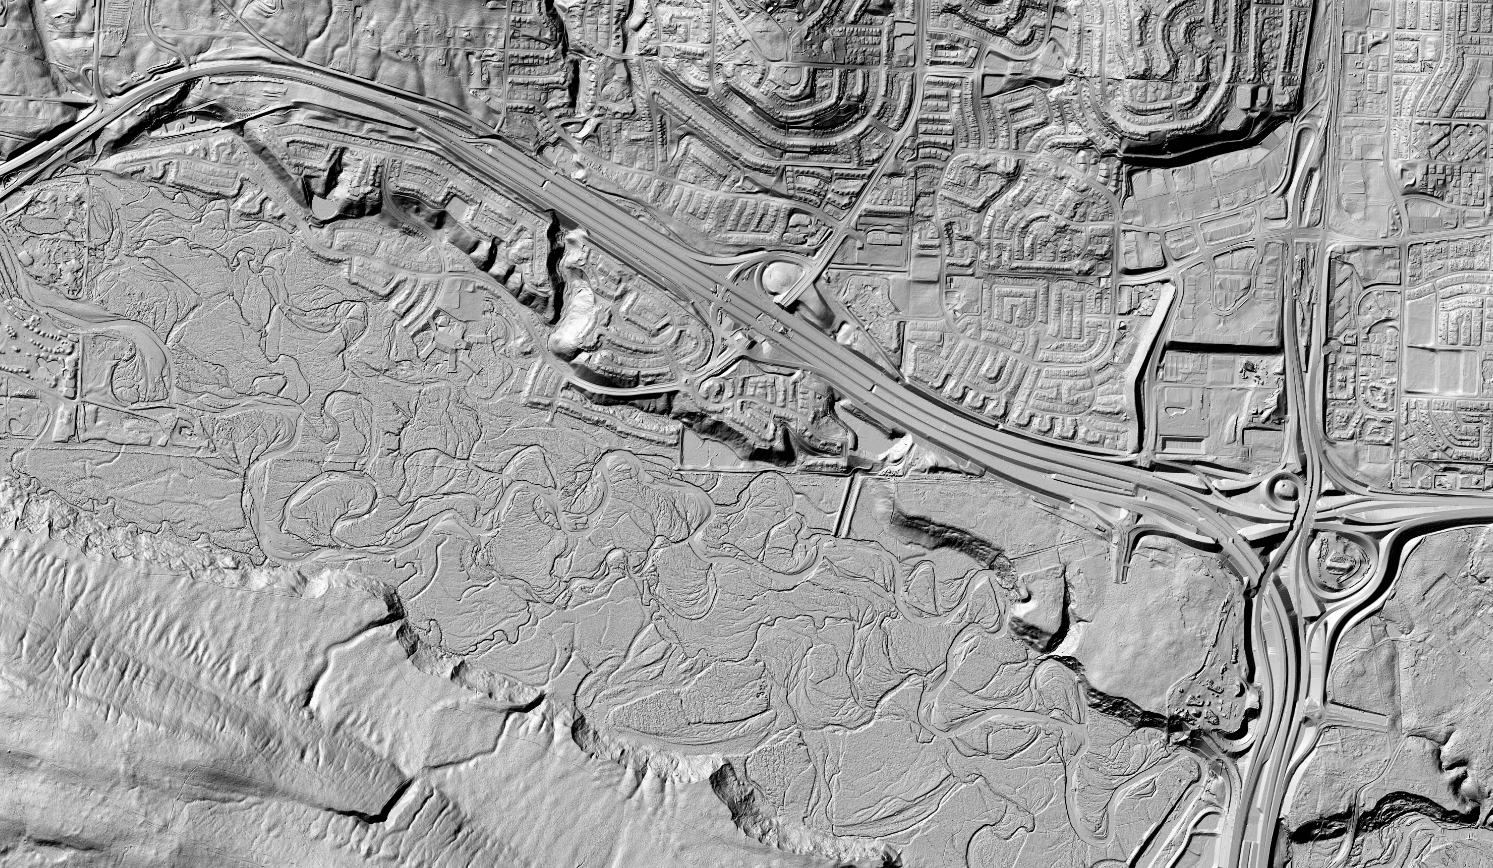
Shaded 3D reliefs of the Digital Surface Model (top image) and the Digital Terrain Model (bottom image) covering an area of the City of Calgary, AB.
Automatically Extracted Buildings
Nearly 6 million new LiDAR-derived building footprints have been added to the Automatically Extracted Buildings product in regions of Alberta, British Columbia, Manitoba, Ontario, Quebec, Saskatchewan, and Yukon. This new release has more than doubled the amount of building footprints in the dataset, for a total of over 9.6 million footprints! These footprints are automatically generated using LiDAR point clouds. Each footprint contains information such as elevation and minimum and maximum building heights. In addition, an attribute providing an estimate of the quality of the building footprint has recently been added. This estimate is based on the quality and specifications of the LiDAR data used to generate the product. For more information on this new attribute, please refer to section 7 of the product specification. The data is available either by download or through a Web Map Service.
LiDAR Point Clouds
This release covers over 70,000 km2 of new LiDAR point cloud data, for a total of 130,000 km2 in the product. This new data cover regions of Manitoba, Northwest Territories, Ontario, Quebec, Saskatchewan, and Yukon. The release includes completed LiDAR projects partly acquired through funds from the Flood Hazard Identification and Mapping Program, including contracts managed by NRCan.
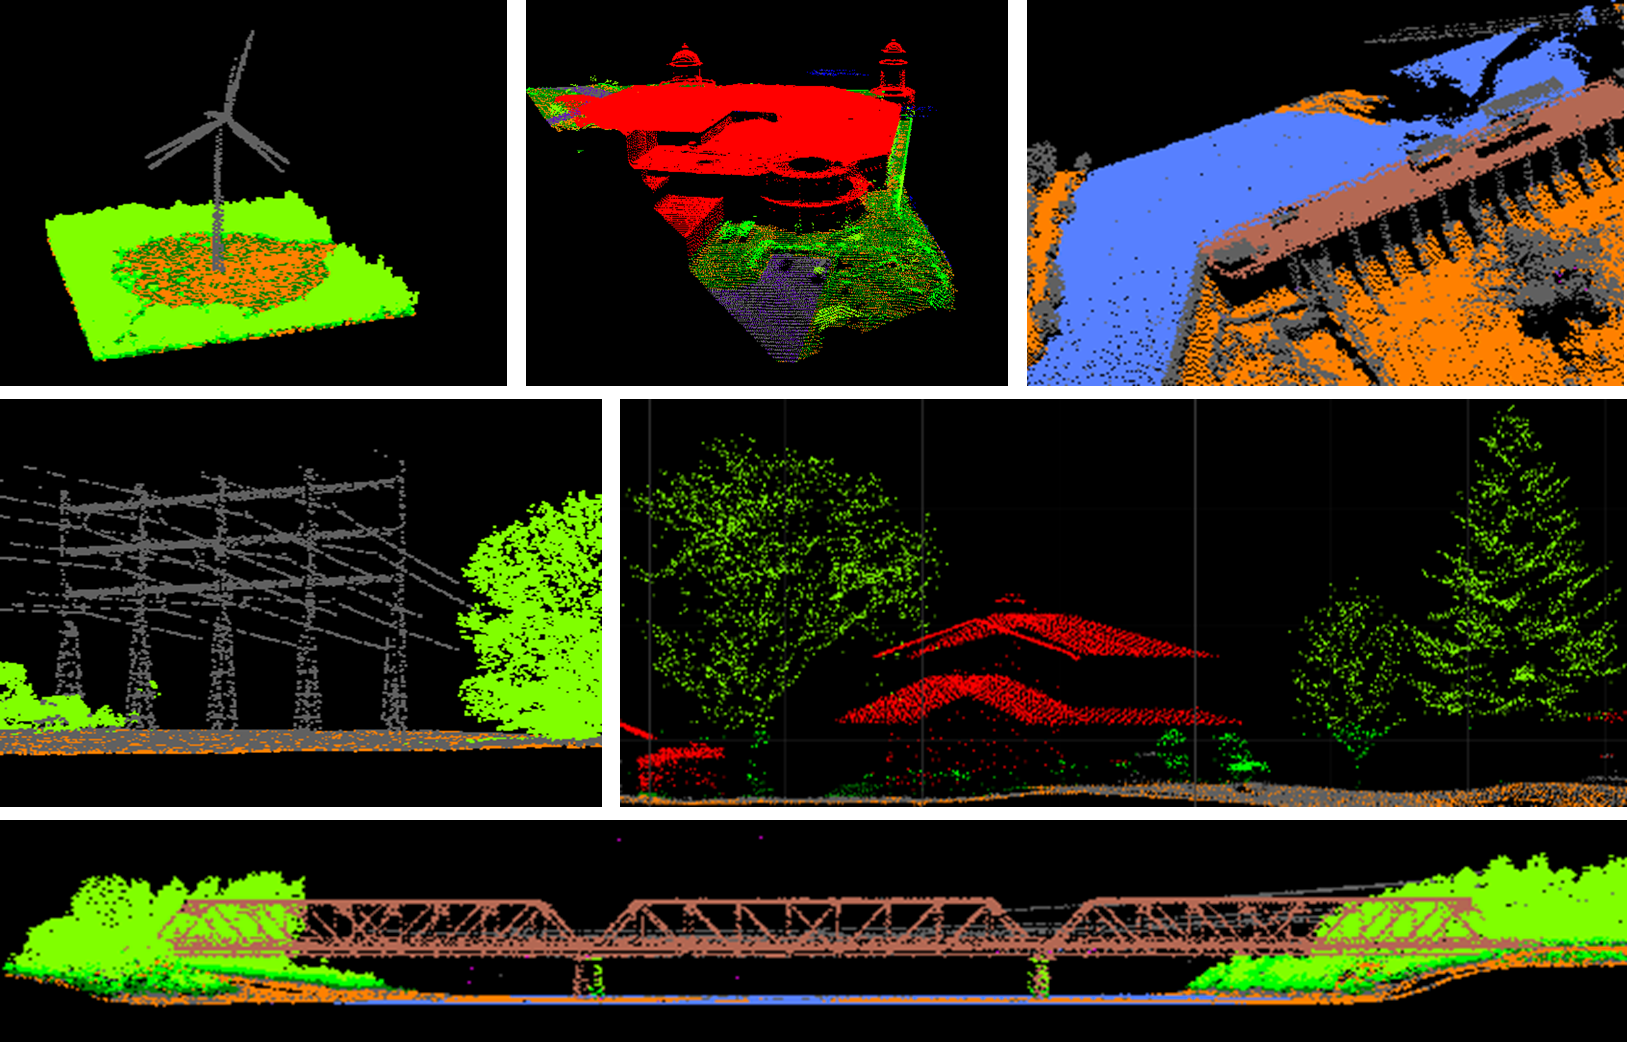
Various LiDAR point clouds showing buildings, energy infrastructure, a bridge and vegetation.
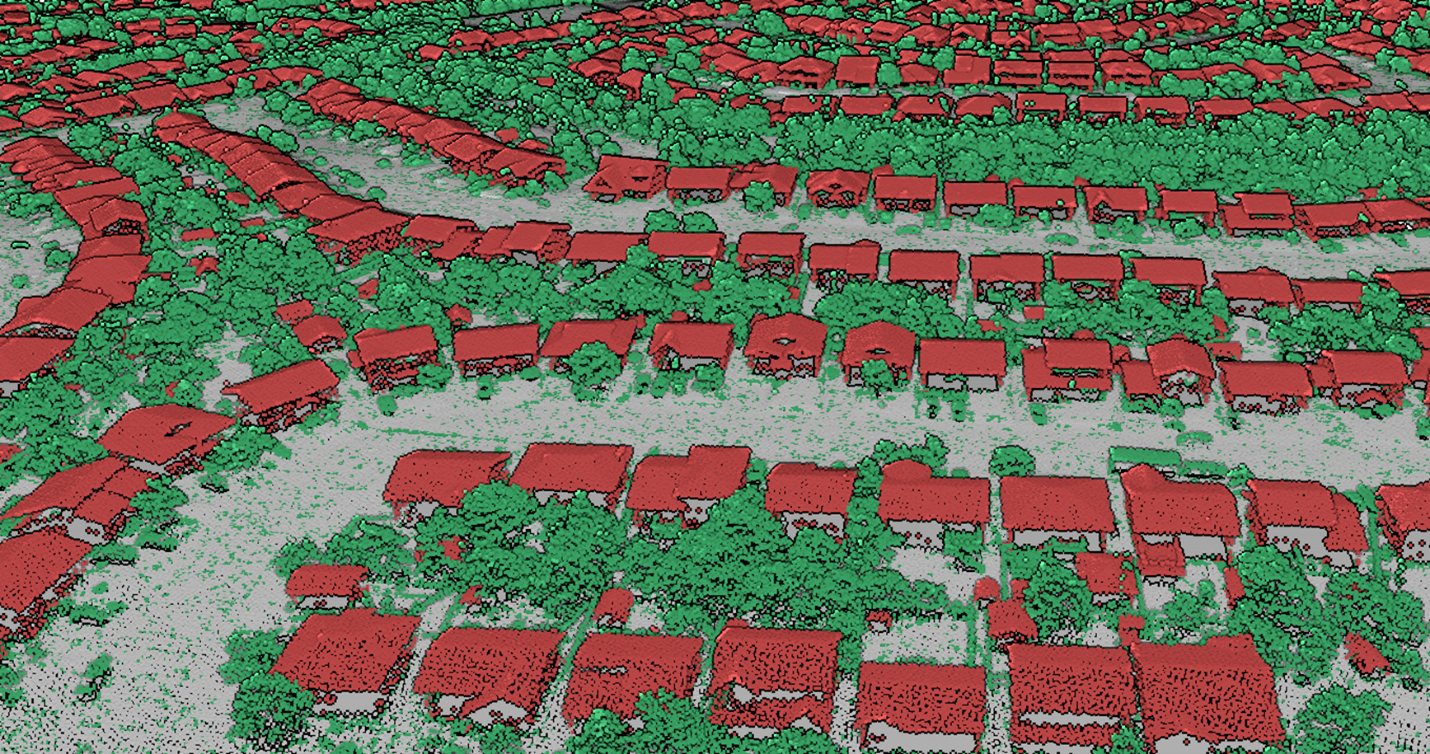
A 3D view of LiDAR point clouds from above a neighbourhood of houses and trees. Points corresponding to buildings, trees and the ground were colorized as red, green and gray, respectively.
For more information about elevation data and projects, visit the National Elevation Data Strategy or contact us directly at geoinfo@nrcan-rncan.gc.ca!
Page details
- Date modified: