
This web mapping application gives estimates of photovoltaic potential (in kWh/kWp) and of the mean daily global insolation (in MJ/m2 and in kWh/m2) for any location in Canada on a 60 arc seconds ~2 km grid.
The photovoltaic (PV) potential represents the expected lifetime average electricity production (in kWh) produced per kilowatt of installed photovoltaic DC capacity rated at Standard Test Conditions (STC) for grid-connected PV systems without batteries.
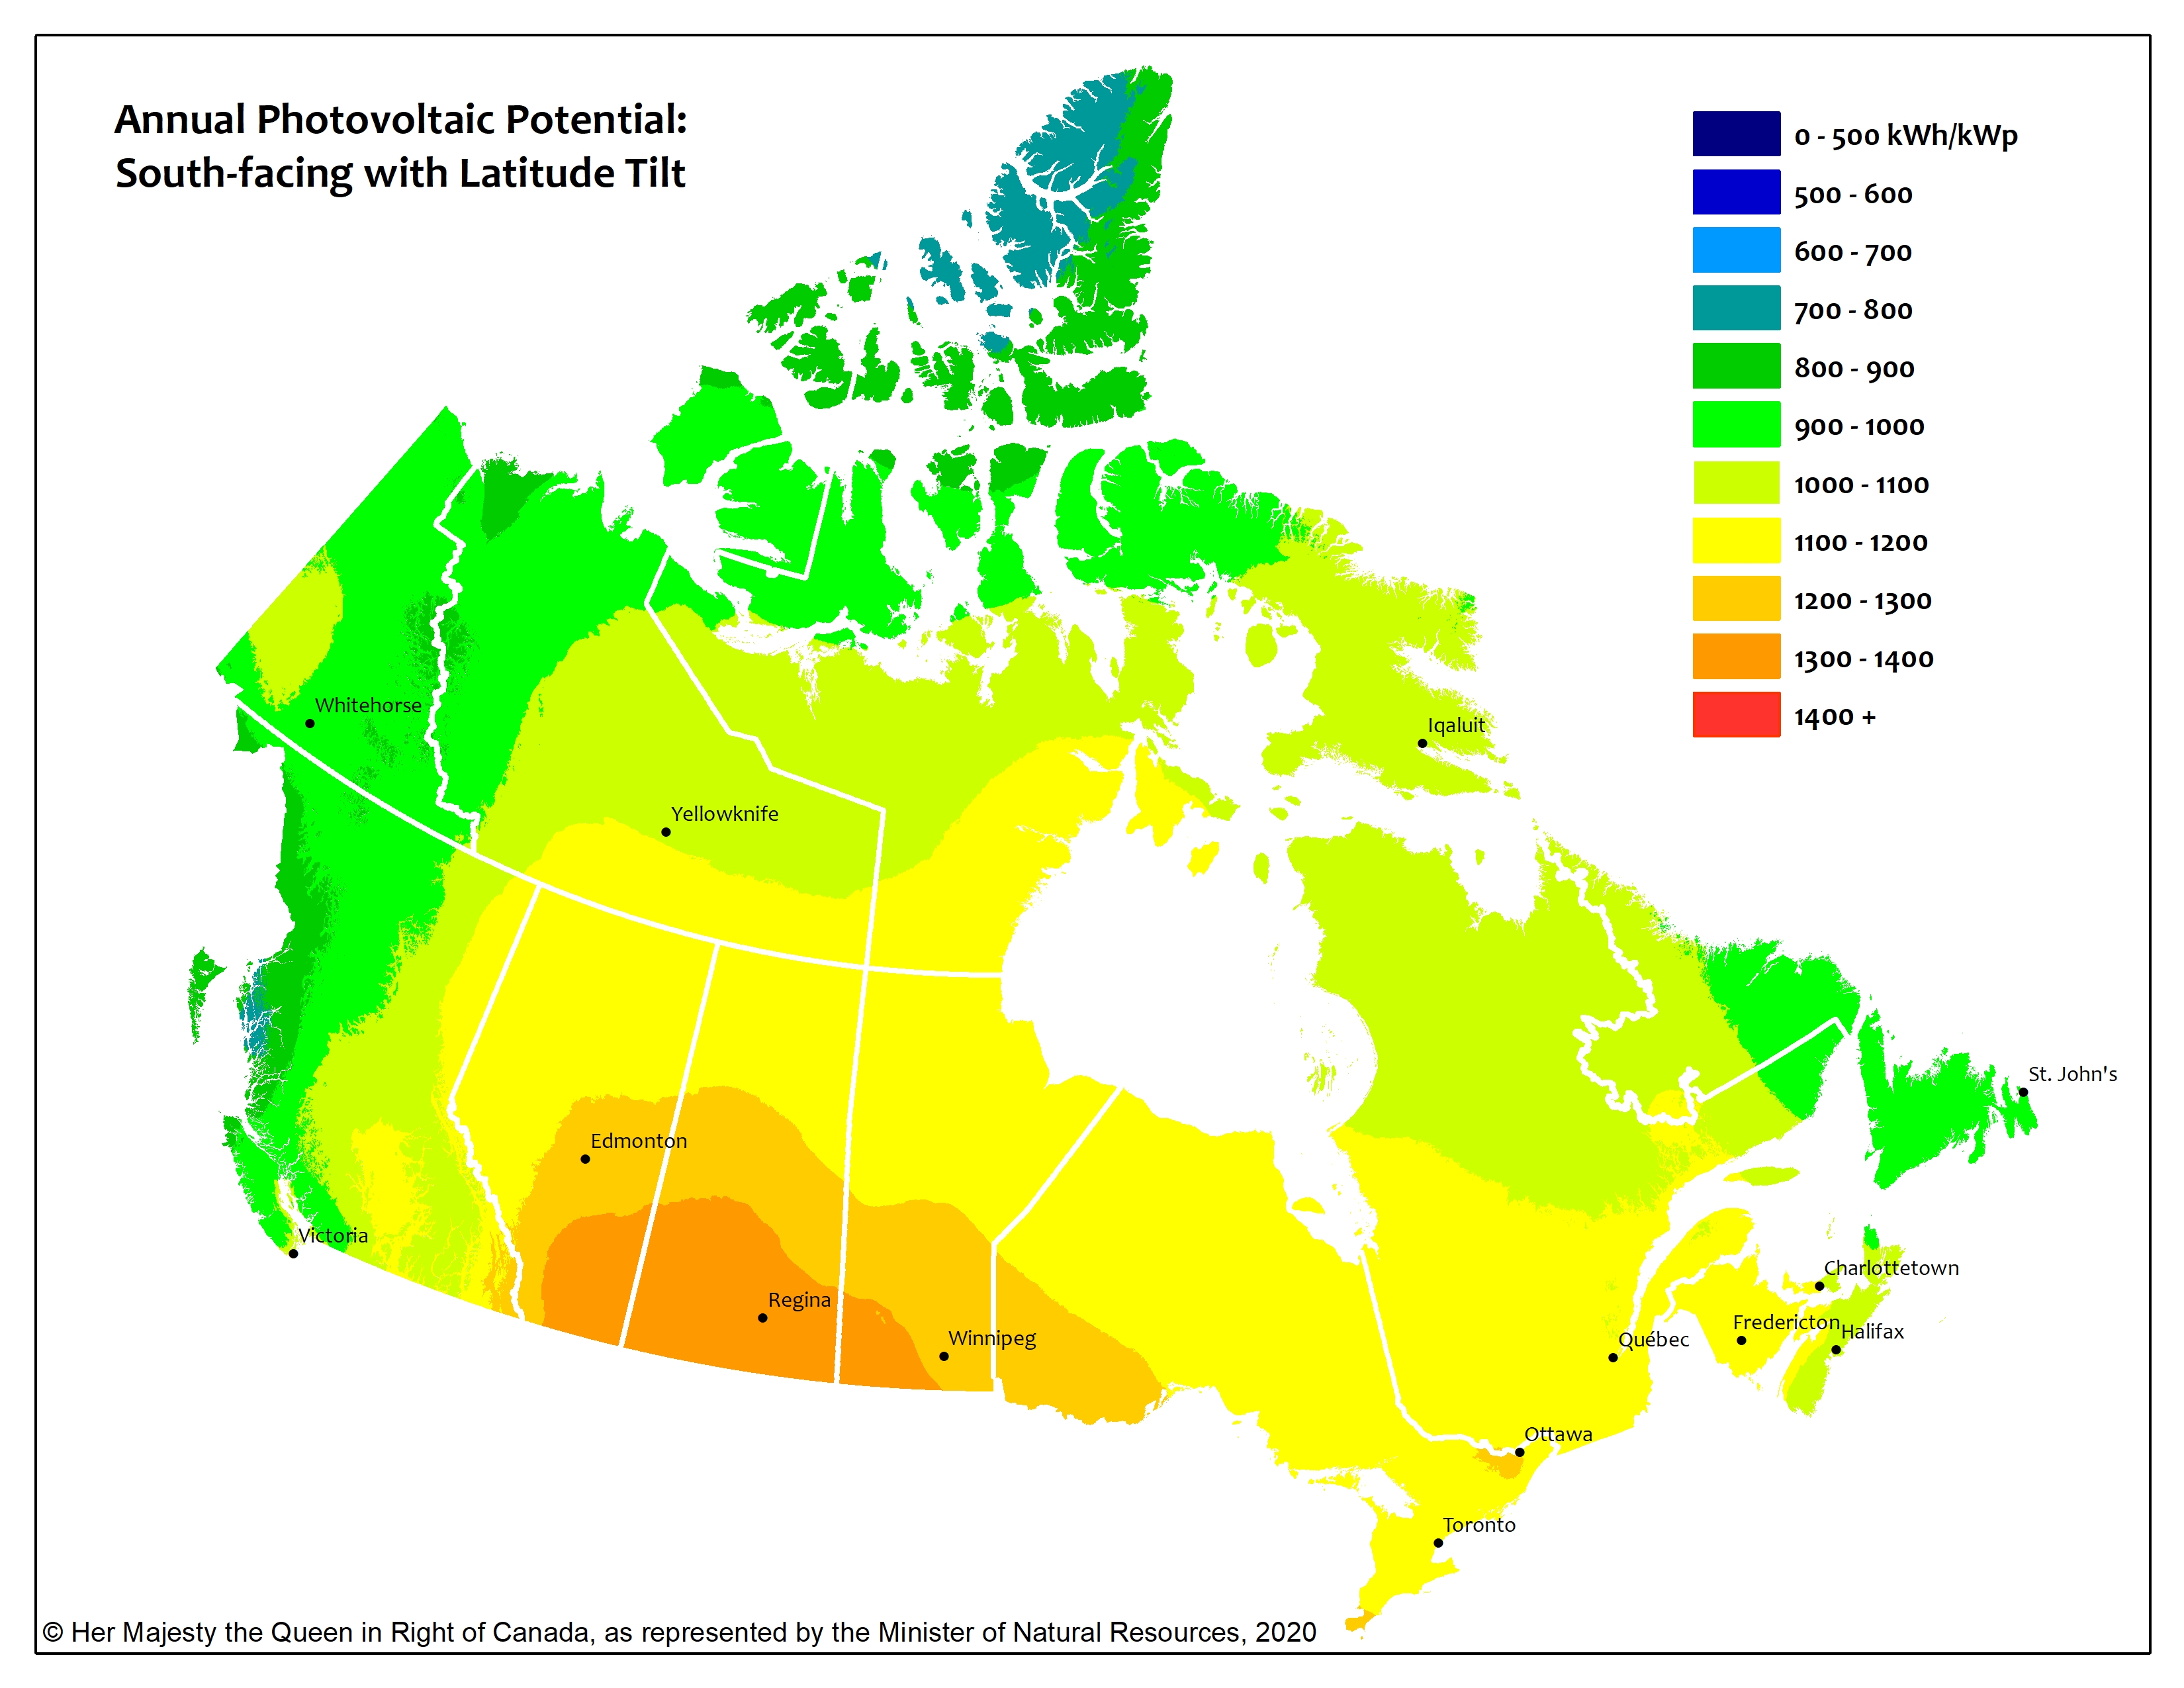
The maps are presented for each month and for the entire year, for six different PV array orientations: a sun-tracking orientation, a horizontal orientation and four fixed South-facing orientations with latitude, vertical (90°) and latitude ± 15° tilts (see figure). Data can also be obtained directly for individual municipalities from a list of over 3500 municipalities or downloaded for all municipalities at once.
These maps and datasets were developed by the Canadian Forest Service (Great Lakes Forestry Centre) in collaboration with the CanmetENERGY Renewable Energy Integration group and the Federal Geospatial Platform. Insolation data were provided by Environment and Climate Change Canada.
Methodology and uncertainty
Methodology
The models used to generate the maps are based on 1974-1993 (CERES, Environment and Climate Change Canada) monthly mean daily global insolation data from 144 meteorological stations across Canada. Data from an additional 8 stations in Alaska (U.S. National Solar Radiation Database, 1961-1990) were also used to improve the models in that region. Insolation values were interpolated over the country in a regular grid (grid size: 60 arc seconds ~2 km grid) using thin-plate smoothing splines as operationalized in the ANUSPLIN model. In addition to monthly mean daily global insolation, the interpolation models are based on position (longitude, latitude) and precipitation (used as a surrogate for cloudiness).
Photovoltaic (PV) electricity generation potential for grid-connected photovoltaic systems without batteries was estimated from the insolation models for each grid cell using a performance ratio of 0.75. The performance ratio quantifies and takes into account overall system losses due to operation under non-ideal conditions: climatic factors, inverter operation and so on. The photovoltaic potential represents a first order approximation of the expected lifetime average system production for each month and for the entire year. It indicates the amount of electricity in kilowatt-hours produced per kilowatt of installed photovoltaic DC capacity rated at Standard Test Conditions (STC).
Uncertainty
Solar resource
Two main metrics were used to quantify the uncertainty in the solar resource estimates presented here, namely the square root of the Generalised Cross-Validation statistic (RTGCV) and the root mean square model error (RTMSE). The standard deviation of the true error will typically lie somewhere in between RTMSE and RTGCV, with RTGCV being a more conservative estimate that includes error from noise in the underlying data. For annual means, RTGCV ranges between 0.5% and 5.3% of the mean depending on the PV array orientation, while RTMSE ranges between 0.2% and 2.4% of the mean.
Photovoltaic potential
Lifetime average annual PV potential values for most systems should be within about 10% of the values presented here. Well-functioning PV systems typically have annual performance ratios in the first years of operation in the range of roughly 0.75 to 0.9 and degrade at a rate of about 0.6% per year (see e.g. Jordan et al. 2016) over an expected lifetime of 25 years or more. Since our estimates represent lifetime averages, initial PV system performance should typically compare favorably to these. Regarding monthly values, these are only indicative and do not take into account monthly performance variations linked to changes in temperature, snowfall, interannual variability in the solar resource, etc.
Any reproduction or public use of these maps or datasets should mention “© Her Majesty the Queen in Right of Canada, as represented by the Minister of Natural Resources, 2020”. A high resolution image of the annual photovoltaic potential map for the South-facing, latitude tilt orientation can be downloaded here.
Text Version
Illustration of different photovoltaic array orientations
References
For an overview of the methodology used and the model uncertainty, see
A more detailed scientific article is also available: