
Information Bulletin
(Published in May 2026)
Canada is a trading nation, with its minerals and metals sector (or “minerals sector”) playing a crucial role in its success, supplying ores, concentrates, and semi-fabricated and fabricated productsFootnote 1 to nearly every country worldwide.
Find out how Canada’s mineral trade is performing:
- Overview
- Trade by stage of processing
- Canada’s principal mineral trading partners
- Trade by commodity
- Trade by province and territory
- Tables
Overview
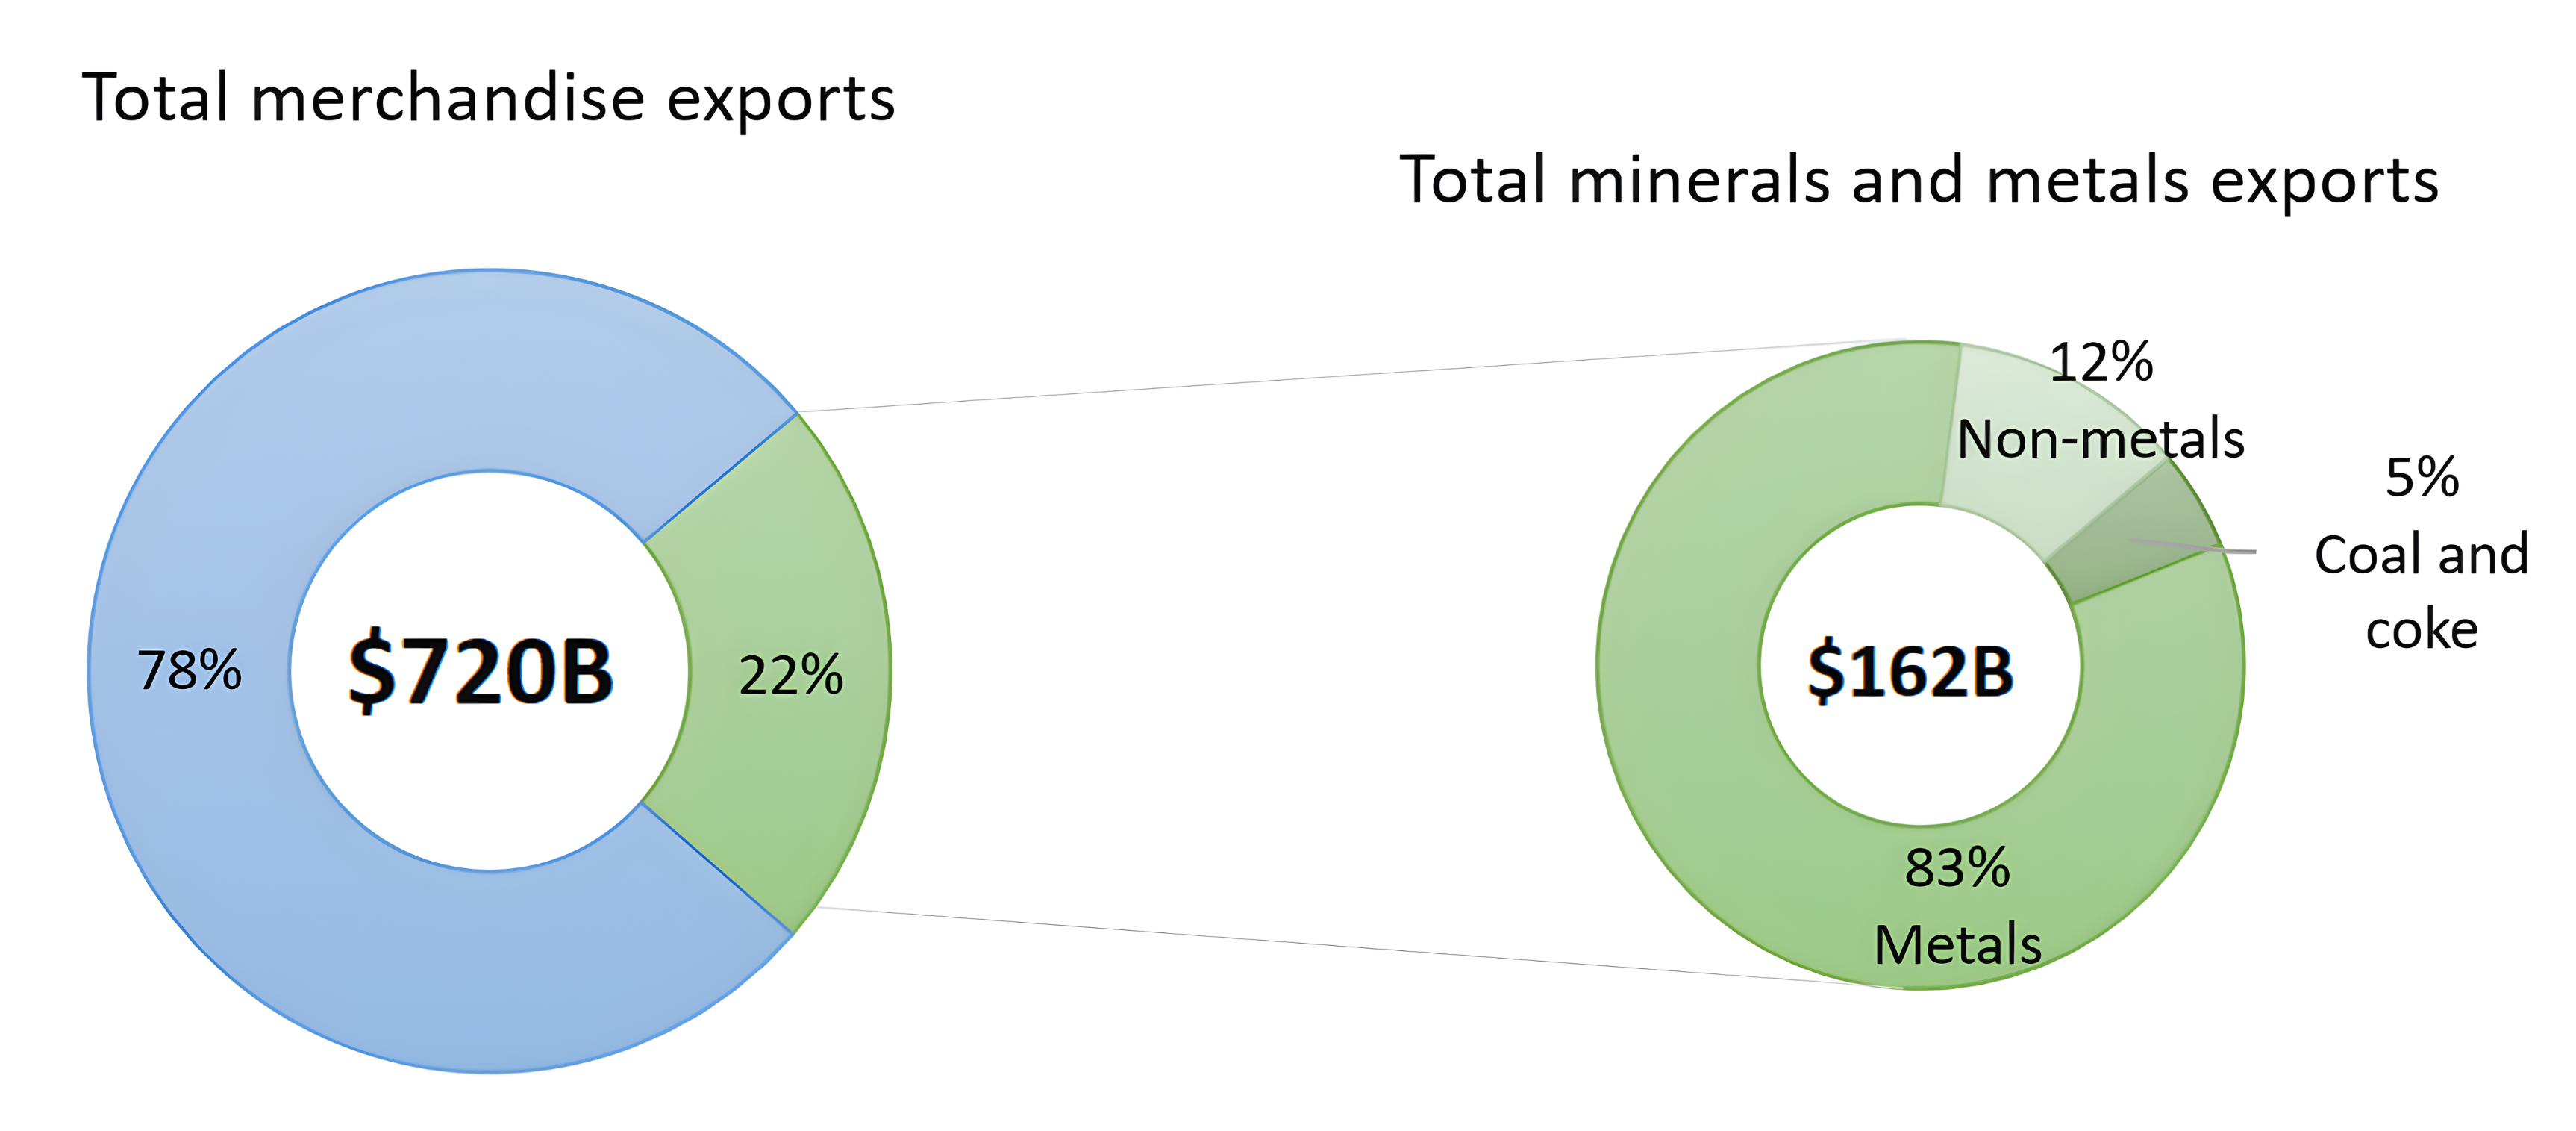
In 2025, Canada’s minerals sector exportsFootnote 2 rose by 6% year-over-year to reach $162 billion, accounting for 22% of total Canadian merchandise exports.
This growth was largely driven by an 8% increase in the value of metal exports, supported by strong gains in gold, copper, and potash. Elevated gold prices, amid ongoing geopolitical uncertainty and sustained central bank demand, reinforced gold’s position as Canada’s leading mineral export and a key driver of overall export growth.
Figure 1. Canadian mineral and metal export as a percentage of total merchandise exports, 2025
Data table – Figure 1
| Sector | Exports ($ billion) |
|---|---|
| Mineral and metal exports | 162.0 |
| Metals | 134.0 |
| Non-metals | 19.1 |
| Coal | 8.1 |
| Other exports | 558.3 |
| Total merchandise exports | 720.3 |
Sources: Natural Resources Canada, Statistics Canada.
B = billion.
Although global economic growth remained subdued and trade policy uncertainty stayed elevated in 2025, strength in gold markets helped sustain higher mineral export values.
Mineral imports also increased, rising 8% to $136 billion and making up 17% of Canada’s total merchandise imports.
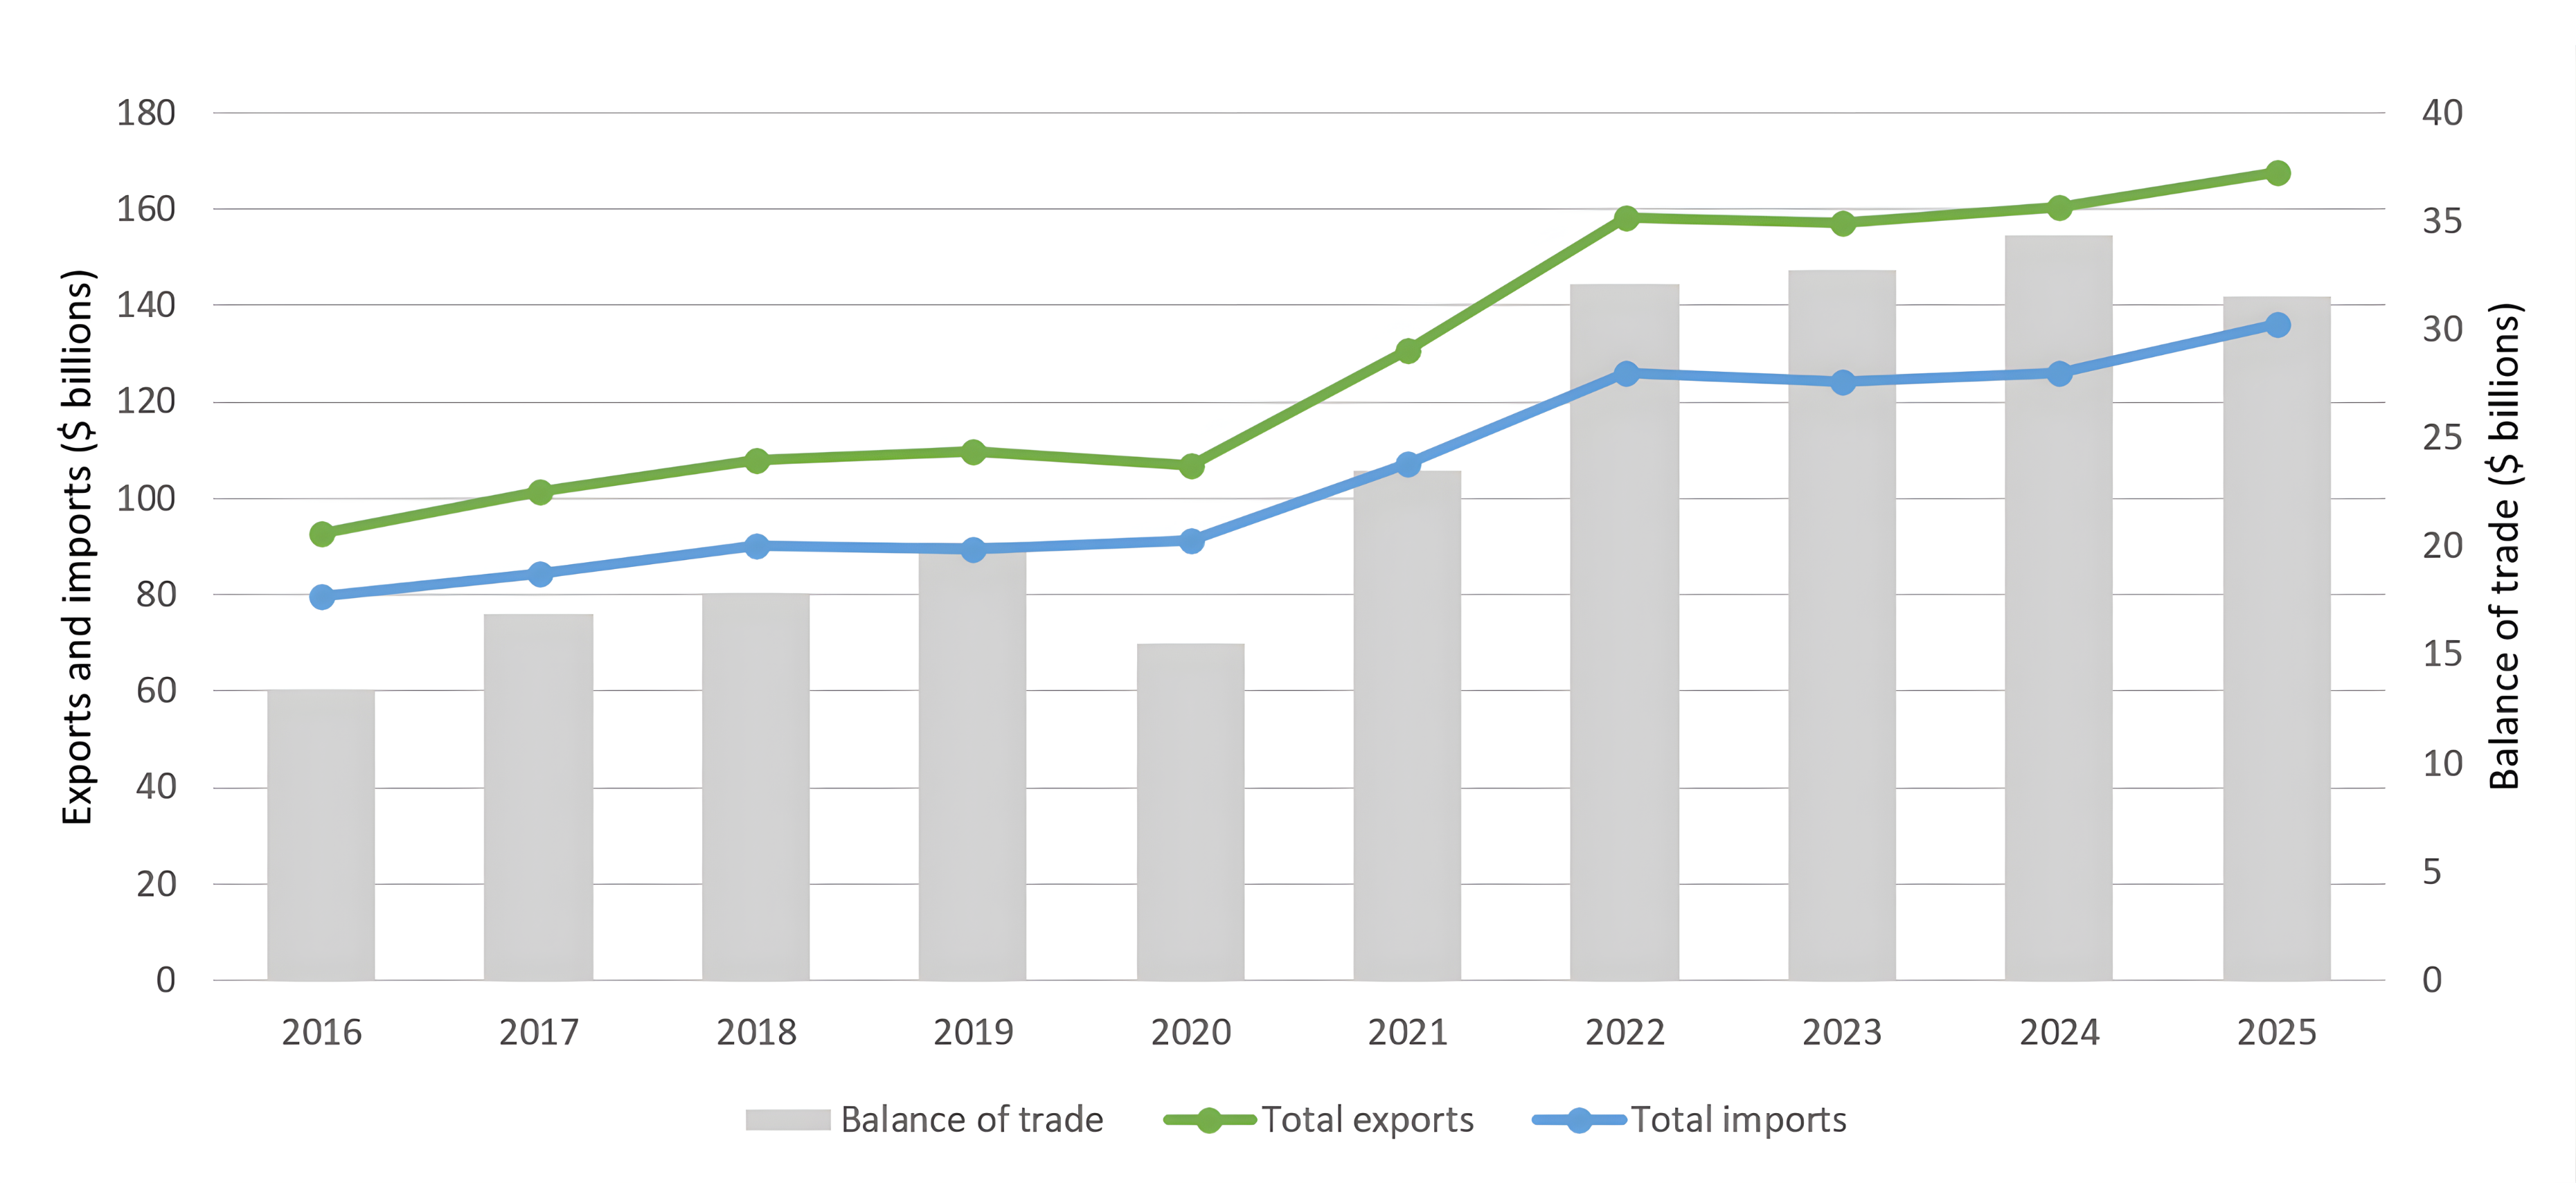
The value of total mineral exports (domestic exports plus re-exports) increased by 4% in 2025. However, with imports growing at a faster pace than exports, Canada’s trade balance (total exports minus imports) for minerals and metals declined by 8% year-over-year to $31.6 billion. This decline reflects stronger growth in demand for imported downstream and manufactured mineral products relative to export gains in upstream commodities.
Figure 2. Minerals and metals trade, 2016–2025
Data table – Figure 2
| Year | Domestic exports | Total exports | Total imports | Balance of trade |
|---|---|---|---|---|
| 2016 | 88.6 | 92.8 | 79.5 | 13.3 |
| 2017 | 97.3 | 101.3 | 84.4 | 16.9 |
| 2018 | 104.3 | 108.1 | 90.2 | 17.9 |
| 2019 | 106.0 | 109.6 | 89.4 | 20.2 |
| 2020 | 102.6 | 106.8 | 91.3 | 15.5 |
| 2021 | 127.0 | 130.8 | 107.3 | 23.5 |
| 2022 | 153.4 | 158.1 | 126.0 | 32.1 |
| 2023 | 150.7 | 157.0 | 124.3 | 32.7 |
| 2024 | 153.4 | 160.4 | 126.0 | 34.4 |
| 2025 | 162.0 | 167.6 | 136.0 | 31.6 |
Note: Domestic exports are displayed in Figure 2. However, total exports (including re-exports) are used to calculate the balance of trade.
Sources: Natural Resources Canada, Statistics Canada.
Trade by stage of processing
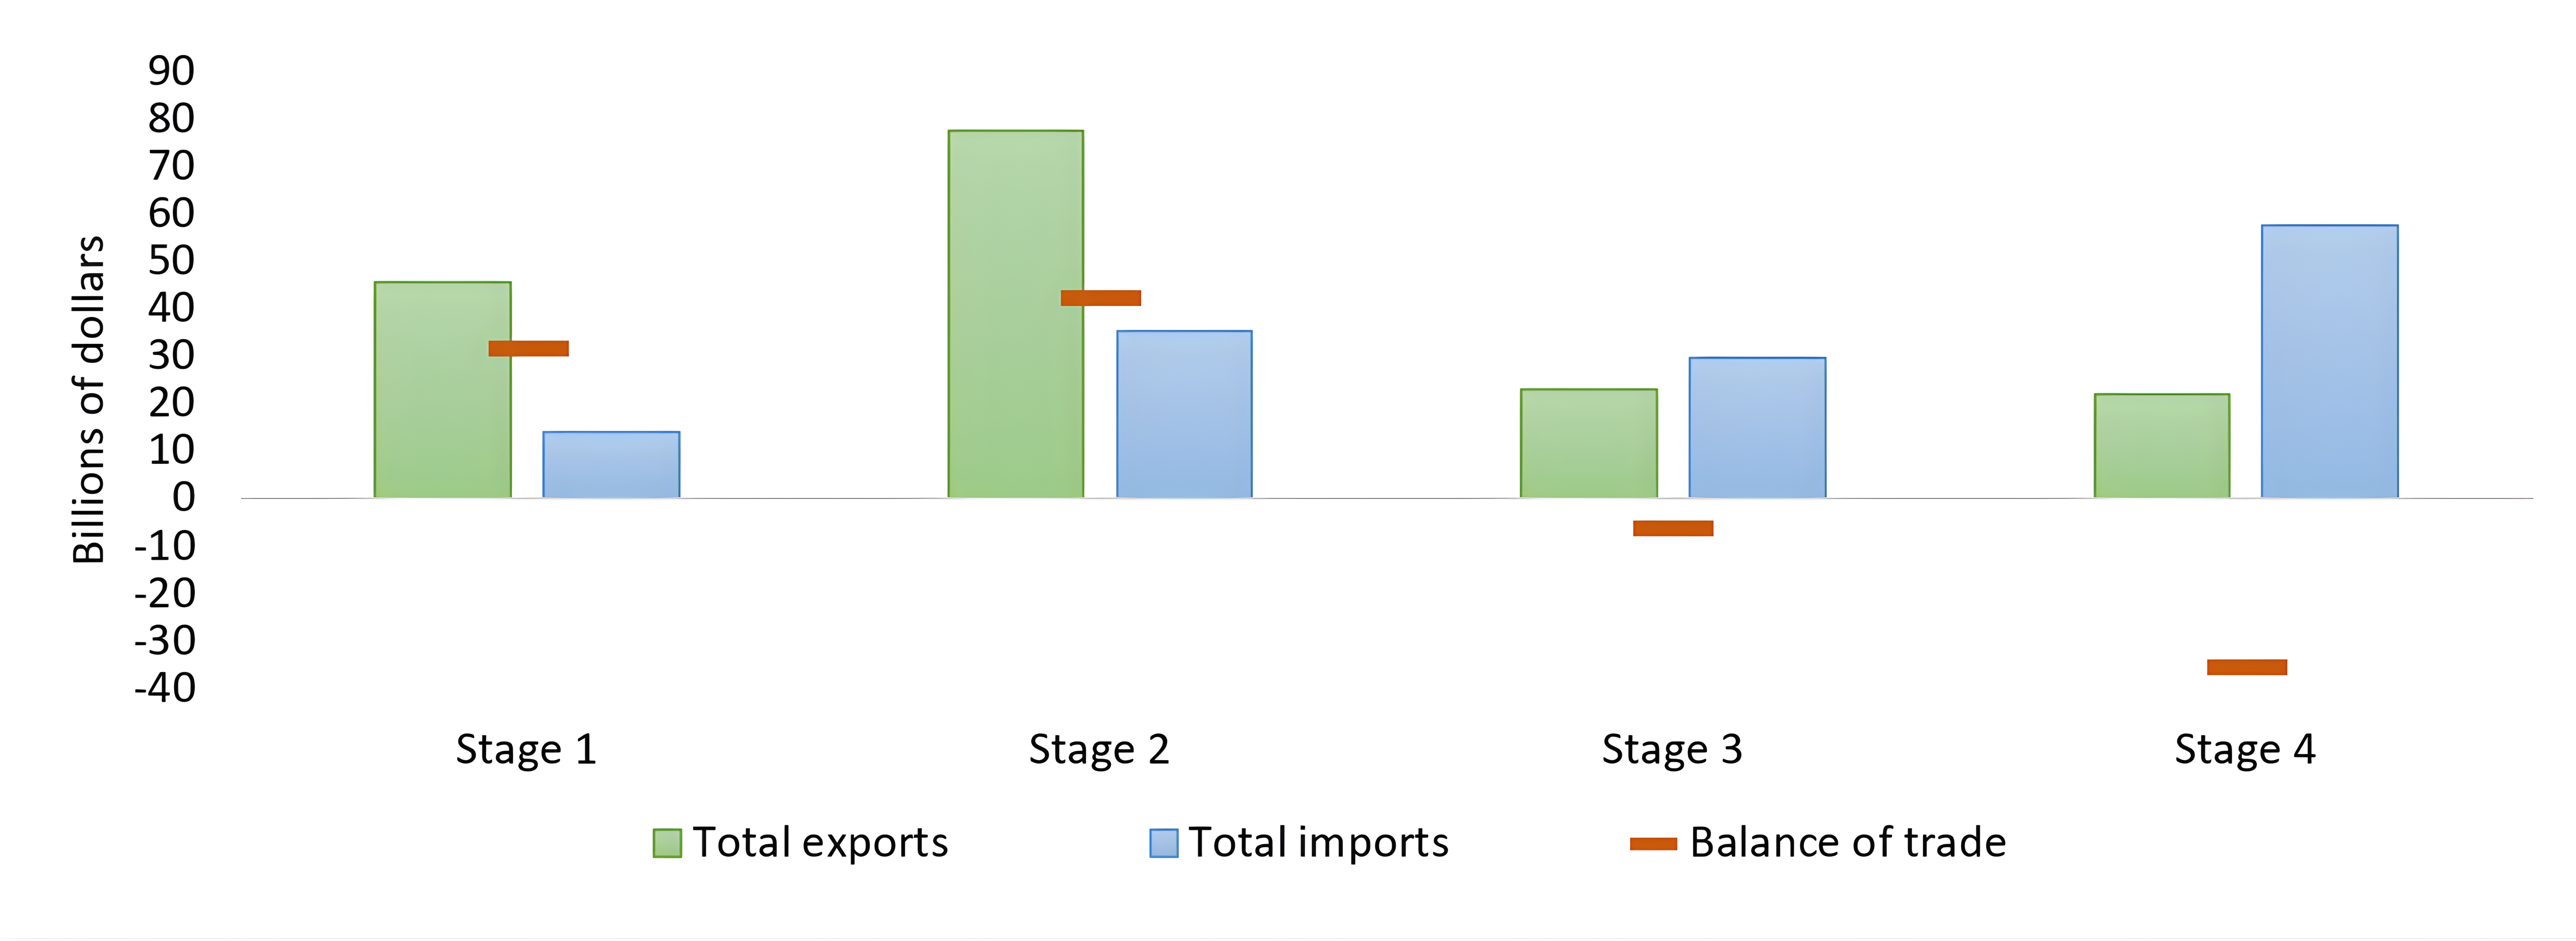
As illustrated in Figure 3, Canada exports significantly more mineral products in the upstream stages 1 and 2 than it imports. Conversely, it imports a higher value of mineral products in the downstream stages 3 and 4 than it exports. This results in a positive trade balance in the upstream segments of the value chain and a negative balance downstream, reflecting Canada’s rich geological resources and strong mining and mineral processing capabilities compared to its more limited manufacturing capacity.
In 2025, the trade balance for stage 1 products increased by 10% to $31.5 billion, while for stage 2 products, it increased by 10% to $42.2 billion. Stage 3 products recorded a deficit of -$6.6 billion, compared to -$1.2 billion in the previous year, while stage 4 products declined further to -$35.6 billion from -$30.9 billion in the previous year.
Mineral products are classified into four stages of processing:
Stage 1 (primary products) includes metal scrap and products from the mining industry, such as ores and concentrates.
Stage 2 (smelting and refining products) includes products from metallurgical processes, which are relatively pure minerals, metals and alloys.
Stage 3 (semi-fabricated products) includes semi-fabricated products that are input in other industries, such as wire, sheets, strips, tubes and flat rolled products.
Stage 4 (fabricated products) includes further processed products and final goods, such as metal structures and framing, hardware items, tools, cutlery and pipe fittings.
Figure 3: Mineral and metal trade by stage, 2025
Data table – Figure 3
| Stage | Domestic exports | Total exports | Total imports | Balance of trade |
|---|---|---|---|---|
| Stage 1 — Primary products | 45.3 | 45.4 | 13.9 | 31.5 |
| Stage 2 — Smelting and refining products | 76.9 | 77.5 | 35.3 | 42.2 |
| Stage 3 — Semi-fabricated products | 21.4 | 22.9 | 29.5 | -6.6 |
| Stage 4 — Fabricated products | 18.3 | 21.7 | 57.4 | -35.6 |
| Total minerals and metals | 162.0 | 167.6 | 136.0 | 31.5 |
Note: Total exports (including re-exports) are displayed in Figure 3. Total exports (including re-exports) are used to calculate the balance of trade.
Sources: Natural Resources Canada, Statistics Canada.
Canada’s principal mineral trading partners
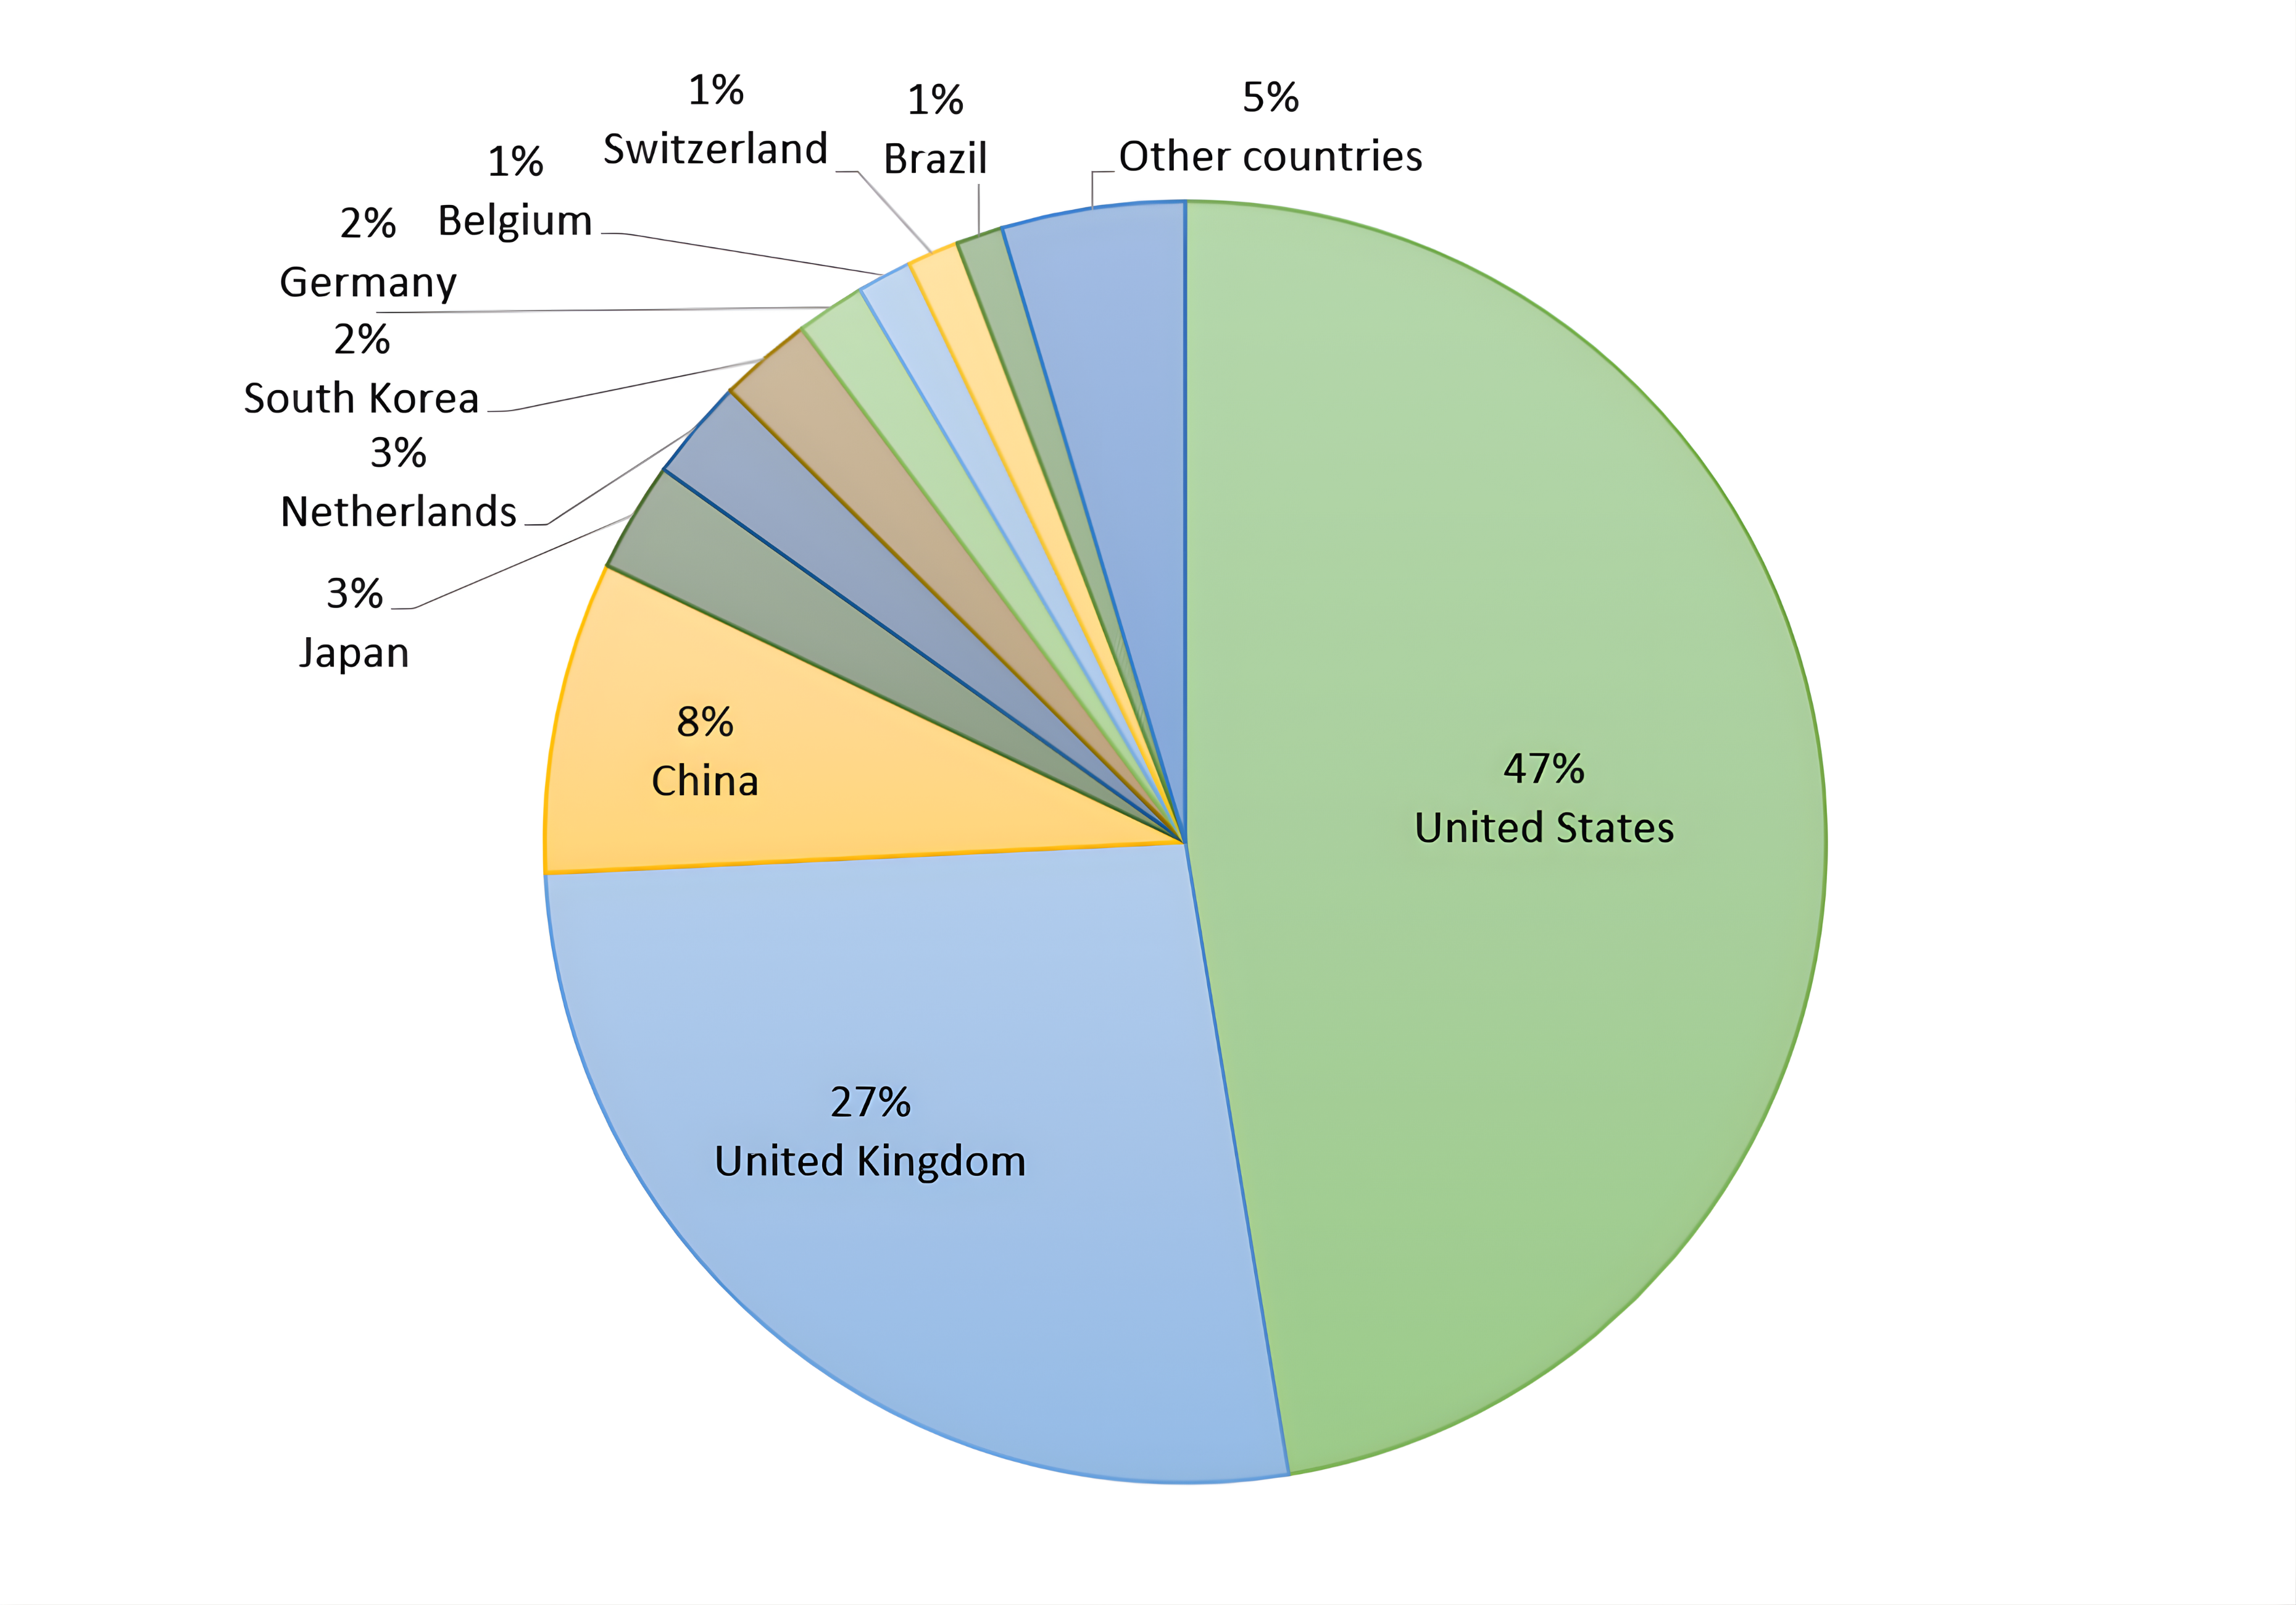
The United States (U.S.) remained Canada’s top destination for mineral exports in 2025, although its share declined. The value of exports to the U.S. decreased by 9% to $76.4 billion, while exports to other destinations increased by 20% to $91.4 billion. As a result, the share of Canada’s mineral exports destined for the U.S. fell from 52% in 2024 to 46% of total shipments in 2025. This shift coincided with the introduction of U.S. tariffs on a range of mineral products, including aluminum, steel, and many derivative copper products.
On an aggregate basis, Canada’s mineral exports are less concentrated toward the U.S. market than total Canadian merchandise exports (at 72%), reflecting a broader diversification of end markets for mineral commodities. However, the degree of U.S. export concentration varies across individual mineral and metal products. For example, exports of gold flow more to the United Kingdom, while products such as steel and aluminum remain more closely tied to U.S. supply chains.
Other key markets for Canada’s mineral products in 2025 included the United Kingdom (27%), China (8%), Japan (3%), Netherlands (3%), South Korea (2%), and Germany (2%). Although Canadian mineral products are exported to nearly every country worldwide, the top seven countries accounted for over 90% of Canada’s mineral exports.
Figure 4. Canada’s mineral exports by country, 2025
Text version – Figure 4
This pie chart illustrates Canada’s mineral exports by country, with the United States as the leading destination, accounting for 47% of the total. Other notable destinations included the United Kingdom (27%), China (8%), Japan (3%), Netherlands (3%), South Korea (2%), Germany (2%), Belgium (1%), Switzerland (1%), and Brazil (1%). Collectively, other countries account for the remaining 5%.
Sources: Natural Resources Canada, Statistics Canada.
Find out more about Canada’s top three mineral and metal export markets for 2025:
United States
- In 2025, bilateral mineral trade between Canada and the United States was valued at $129.3 billion, a decrease of approximately 9% compared to 2024.
- Canada maintained a positive trade balance in minerals and metals with the United States, reaching $23.5 billion in 2025, down 12% year-over-year.
- The value of exports to the United States in 2025 amounted to $76.4 billion, reflecting a decline of about 9% compared to the previous year.
- Mineral exports were divided between upstream stages 1 and 2 products (51%) and downstream stages 3 and 4 products (49%).
- The leading exports included:
- Iron and steel ($14.4 billion, or 19% of the total)
- Aluminum ($13.8 billion, or 18% of the total)
- Gold ($10.8 billion, or 14% of the total)
- Copper ($5.6 billion, or 7% of the total)
- Potash ($4.2 billion, or 5% of the total)
- Canada also plays a crucial role as a supplier of critical minerals to the United States, including uranium, tellurium, and niobium.
- In 2025, Canada’s mineral imports from the United States decreased by 8% to $53.1 billion.
- Stages 1 and 2 products comprised 28% of the imports, while stages 3 and 4 products accounted for the majority at 72%.
- The top imports included:
- Iron and steel ($14.0 billion, or 26% of the total)
- Gold ($5.0 billion, or 9% of the total)
- Copper ($4.0 billion, or 8% of the total)
- Aluminum ($3.9 billion, or 7% of the total)
United Kingdom
- In 2025, bilateral mineral trade between Canada and the United Kingdom was valued at $42.4 billion, a 74% increase compared to the previous year, driven primarily by a surge in gold exports.
- Canada maintained a significant positive trade balance for minerals and metals with the United Kingdom, valued at $40.7 billion in 2025.
- Canada’s mineral and metal exports to the United Kingdom increased by 74% to $41.6 billion in 2025.
- Gold was the leading export, valued at $40.0 billion, which accounted for 96% of the total value of mineral exports. Other notable exports included uranium ($682 million or 2% of the total) and silver ($444 million or 1% of the total).
- Gold comprised 86% of Canada’s total merchandise exports value of $46.6 billion to the United Kingdom in 2025. Canada exported 253 tonnes of gold to the United Kingdom in 2025, representing 69% of its total gold exports. This flow of gold is mainly due to the United Kingdom’s role as a financial hub for global gold trade, where international investors actively buy and sell gold on the London Bullion Market Association.
- In 2025, Canada’s mineral imports from the United Kingdom increased by 22% to $838 million. The primary metals imported were iron and steel, which accounted for 28% of total imports, followed by gold (9%), silver (8%), nickel (6%), aluminum (4%), platinum group metals (4%), and copper (3%).
China
- China is one of the largest global producers and consumers of minerals and metals.
- In 2025, bilateral mineral trade between Canada and China was valued at $27.4 billion, a 12% increase compared to the previous year.
- Canada had a negative trade balance for minerals and metals with China, amounting to -$3.1 billion in 2025.
- The value of mineral exports to China increased by 27% to $12.1 billion in 2025.
- These exports were predominantly stage 1 products, which accounted for 94% of the total value.
- The leading exports included:
- Copper ($3.4 billion, or 28% of the total)
- Iron ore ($3.0 billion, or 24% of the total)
- Coal ($2.6 billion, or 21% of the total)
- Gold ($1.1 billion, or 9% of the total)
- Sulphur ($466 million, or 4% of the total)
- Potash ($441 million, or 4% of the total)
- In 2025, Canada’s mineral imports from China increased by 2% to $15.2 billion.
- These imports were predominantly stage 4 manufactured goods, which constituted 79% of the value.
- The top imports included:
- Iron and steel ($5.1 billion, or 33% of the total)
- Aluminum ($1.4 billion, or 9% of the total)
- Glass ($916 million, or 6% of the total)
- Clay ($595 million, or 4% of the total)
- Graphite ($434 million, or 3% of the total)
- Copper ($383 million, or 3% of the total)
- Lithium ($256 million, or 2% of the total)
- Magnesium ($241 million, or 2% of the total)
Trade by commodity
In 2025, the export value of metals rose by 8%, while non-metal exports increased by 6% and coal exports declined by 20%. Metals, led by gold, accounted for the largest share of total export value at 83%, followed by non-metals at 12% and coal at 5%.
Figure 5. Mineral and metal exports by commodity, 2025
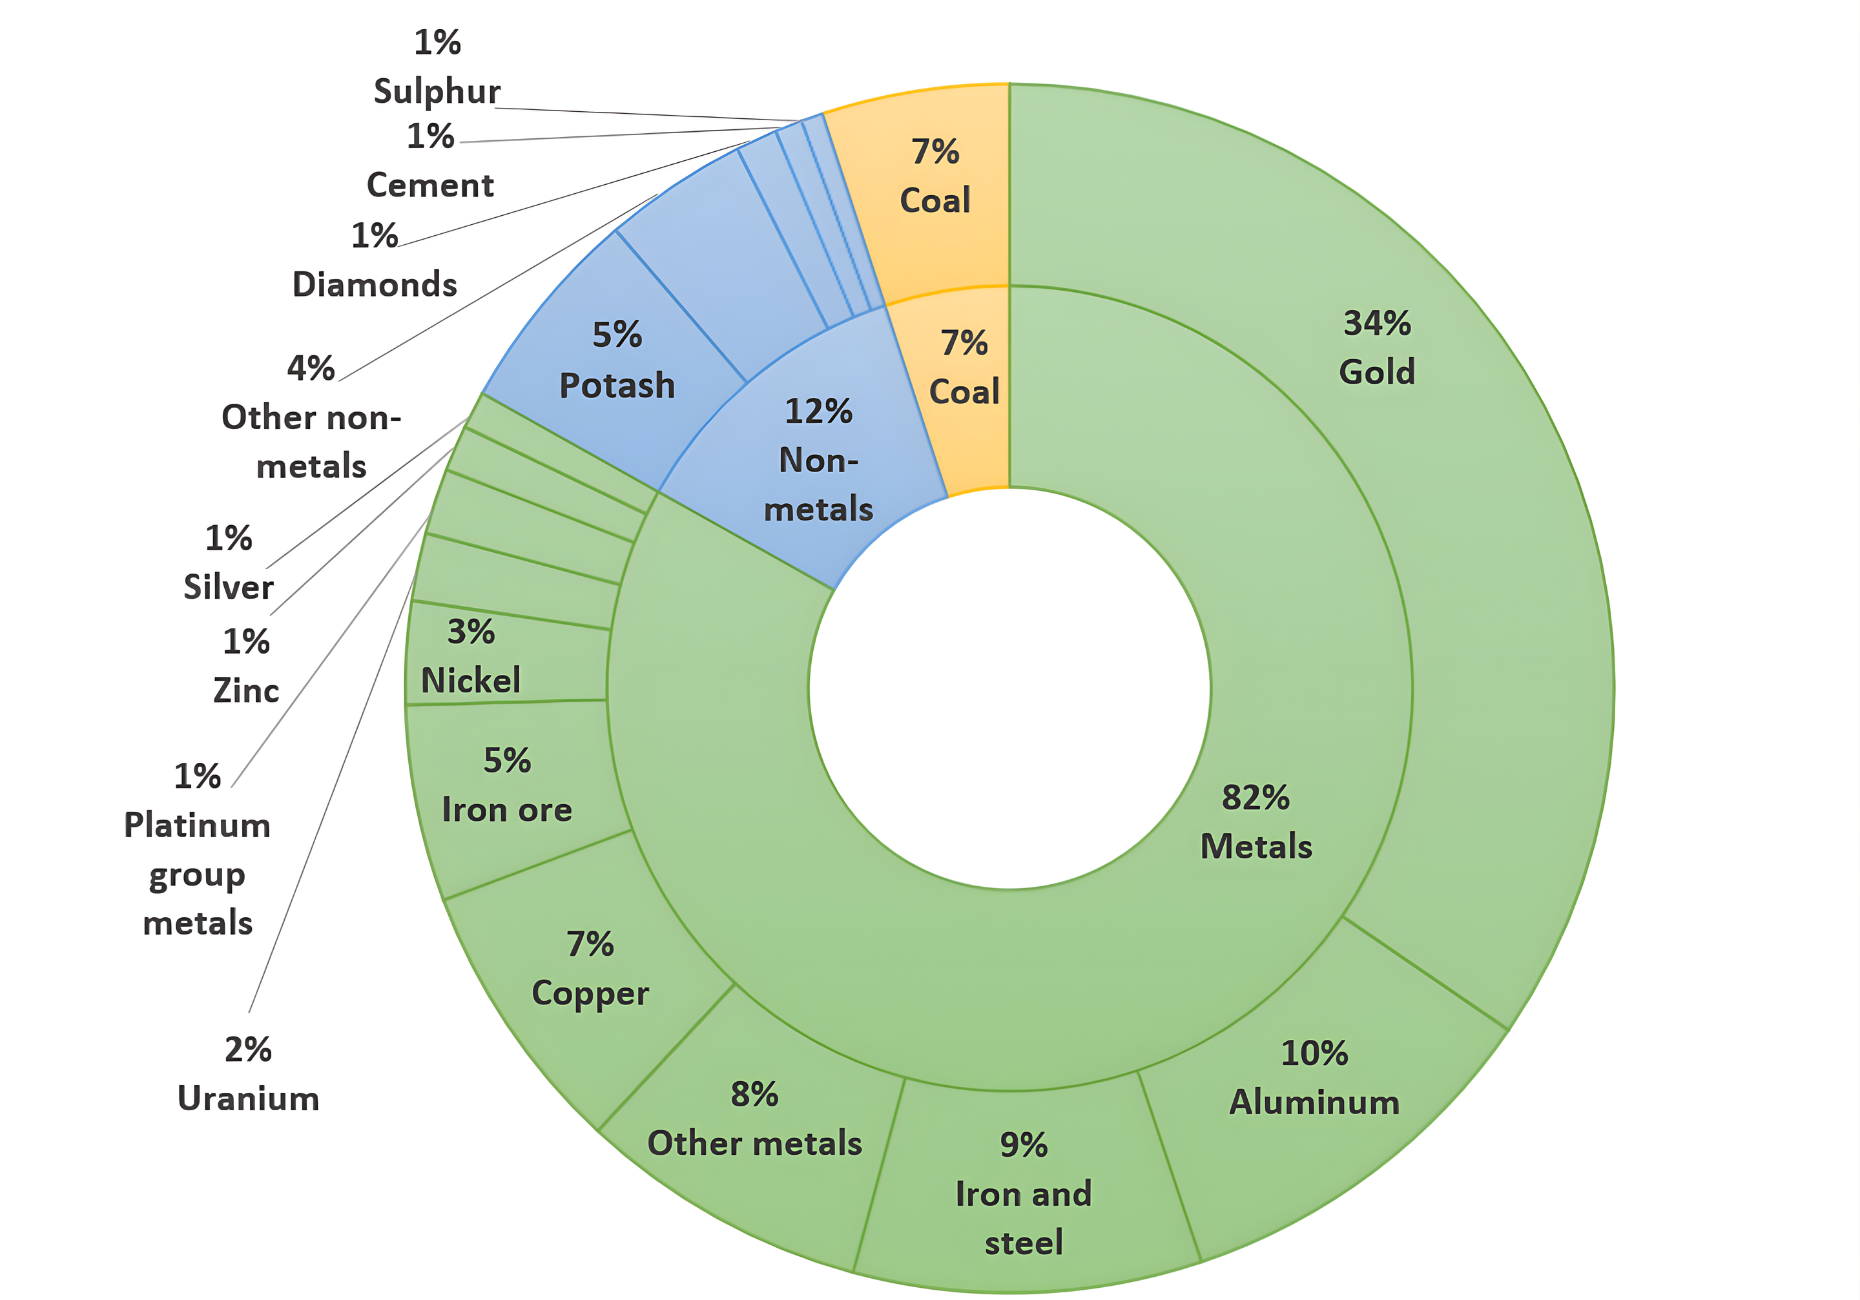
Data table – Figure 5
| Commodity | Domestic exports ($ millions) |
|---|---|
| Metals | 134,012 |
| Gold | 55,716 |
| Aluminum | 16,617 |
| Iron and steel | 15,017 |
| Copper | 11,891 |
| Iron ore | 8,466 |
| Nickel | 4,462 |
| Uranium | 2,926 |
| Silver | 2,826 |
| Zinc | 1,977 |
| Platinum group metals | 1,603 |
| Other metals | 12,511 |
| Non-metals | 18,230 |
| Potash | 9,001 |
| Cement | 1,183 |
| Diamonds | 933 |
| Sulphur | 892 |
| Other non-metals | 6,221 |
| Coal | 8,092 |
| Total | 162,004 |
Sources: Natural Resources Canada, Statistics Canada.
Metal products
In 2025, the value of metal product exports rose by 8% compared to the previous year, reaching $134.0 billion. However, Canada’s top exported metals saw mixed results. Export values increased, largely reflecting higher prices, for gold (37%), silver (64%), copper (11%), and platinum group metals (13%), while they decreased for iron and steel (-27%), aluminum (-5%), nickel (-3%), uranium (-23%), and iron ore (-3%), coinciding with the introduction of tariffs by the United States for some of these products.
Metal imports increased by 9% to $116.2 billion in 2025, with varied results across commodities. Imports increased for platinum group metals (87%), copper (17%), zinc (14%), gold (37%), and aluminum (4%). Conversely, declines were observed for iron ore (-44%), iron and steel (-5%), uranium (-6%), and nickel (-3%).
Non-metal products
In 2025, the value of Canada’s non-metal exports increased by 6% to $18.2 billion. This growth was largely driven by potash and sulphur, which are among Canada’s leading non-metal exports in terms of value.
Potash exports rose by 13% to $9.0 billion in 2025, reflecting improved market conditions following the sharp declines observed in 2023 and 2024.
Diamond exports decreased by 39% to $0.9 billion, reflecting both mine wind-downs in Canada and continued weakness in global natural diamond demand, including soft Chinese demand and ongoing competitive pressure from lab-grown diamonds.
Sulphur exports increased significantly by 117% to $892 million, reflecting strong global demand and higher prices.
Non-metal imports, 90% of which are stages 3 or 4 products, increased by 3% in 2025 to $18.0 billion.
Coal and coke products
In 2025, the value of exports of coal and coke products declined by 20% to $8.1 billion. This drop was primarily driven by continued weakness in metallurgical coal prices, which are closely tied to global steel demand.
Meanwhile, imports of coal and coke products also declined in 2025, by 17% to $1.6 billion.
Critical mineralsFootnote 3
In March 2021, the Government of Canada published a list of 31 critical minerals deemed essential for the sustainable economic success of Canada and its allies. Since then, the Government of Canada has made significant financial commitments in budgets and launched the Canadian Critical Minerals Strategy. In 2024, the list was updated through consultations with provinces, territories, industry stakeholders and Indigenous organizations. The 2024 update introduced three new critical minerals:
- High-purity iron – Essential to green steel-making and decarbonization
- Phosphorous – Essential for batteries and food security
- Silicon metal – Essential for semiconductors and computer chips
In 2025, the value of critical minerals exports increased by 3% to $49.4 billion (Table 3). Growth was supported by higher export values for several critical minerals, while some battery and specialty metals remained under pressure. Aluminum led in export value at 31%, followed by copper (24%), potash (18%), nickel (9%), uranium (6%), and zinc (4%). Together, these minerals comprised 92% of critical minerals exports.
The value of critical minerals imports increased by 13% to $23.7 billion. Aluminum (including alumina for processing into aluminum) accounted for 36% of the import value, followed by copper (26%), platinum group metals (7%), zinc (6%), nickel (5%), and uranium (4%). Together, these minerals comprised 84% of critical minerals imports.
Canada is the world’s fourth-largest producer and second-largest exporter of aluminum. With no domestic bauxite mines, the primary ore used in aluminum production, Canada relies largely on imported bauxite and alumina, primarily from Brazil, while maintaining some domestic alumina production.
With the growth of imports outpacing exports in 2025, Canada’s critical minerals trade balance declined by 5% year-over-year to $27.0 billion.
The United States remained Canada’s top trading partner for critical minerals in 2025 (Table 4), with total trade valued at $37.0 billion. Exports to the United States reached $28.8 billion, accounting for approximately 57% of Canada’s total critical minerals exports. Meanwhile, imports from the United States were $8.6 billion, or 36% of Canada’s critical minerals imports. Canada maintained a positive trade balance with the United States at $20.2 billion.
China was Canada’s second largest critical minerals trading partner, with trade totaling $6.1 billion, followed by Brazil ($4.2 billion) and the Netherlands ($2.6 billion). Exports to China amounted to $4.5 billion, while imports totaled $1.6 billion, resulting in a positive trade balance. Copper and potash remained the top exports. On the import side, aluminum and magnesium were the largest imports.
As illustrated in Figure 6, most critical minerals exports are concentrated in stages 1 and 2 of the value chain, reflecting Canada’s upstream strength in critical minerals processing.Figure 6. Critical minerals trade by stage, 2025
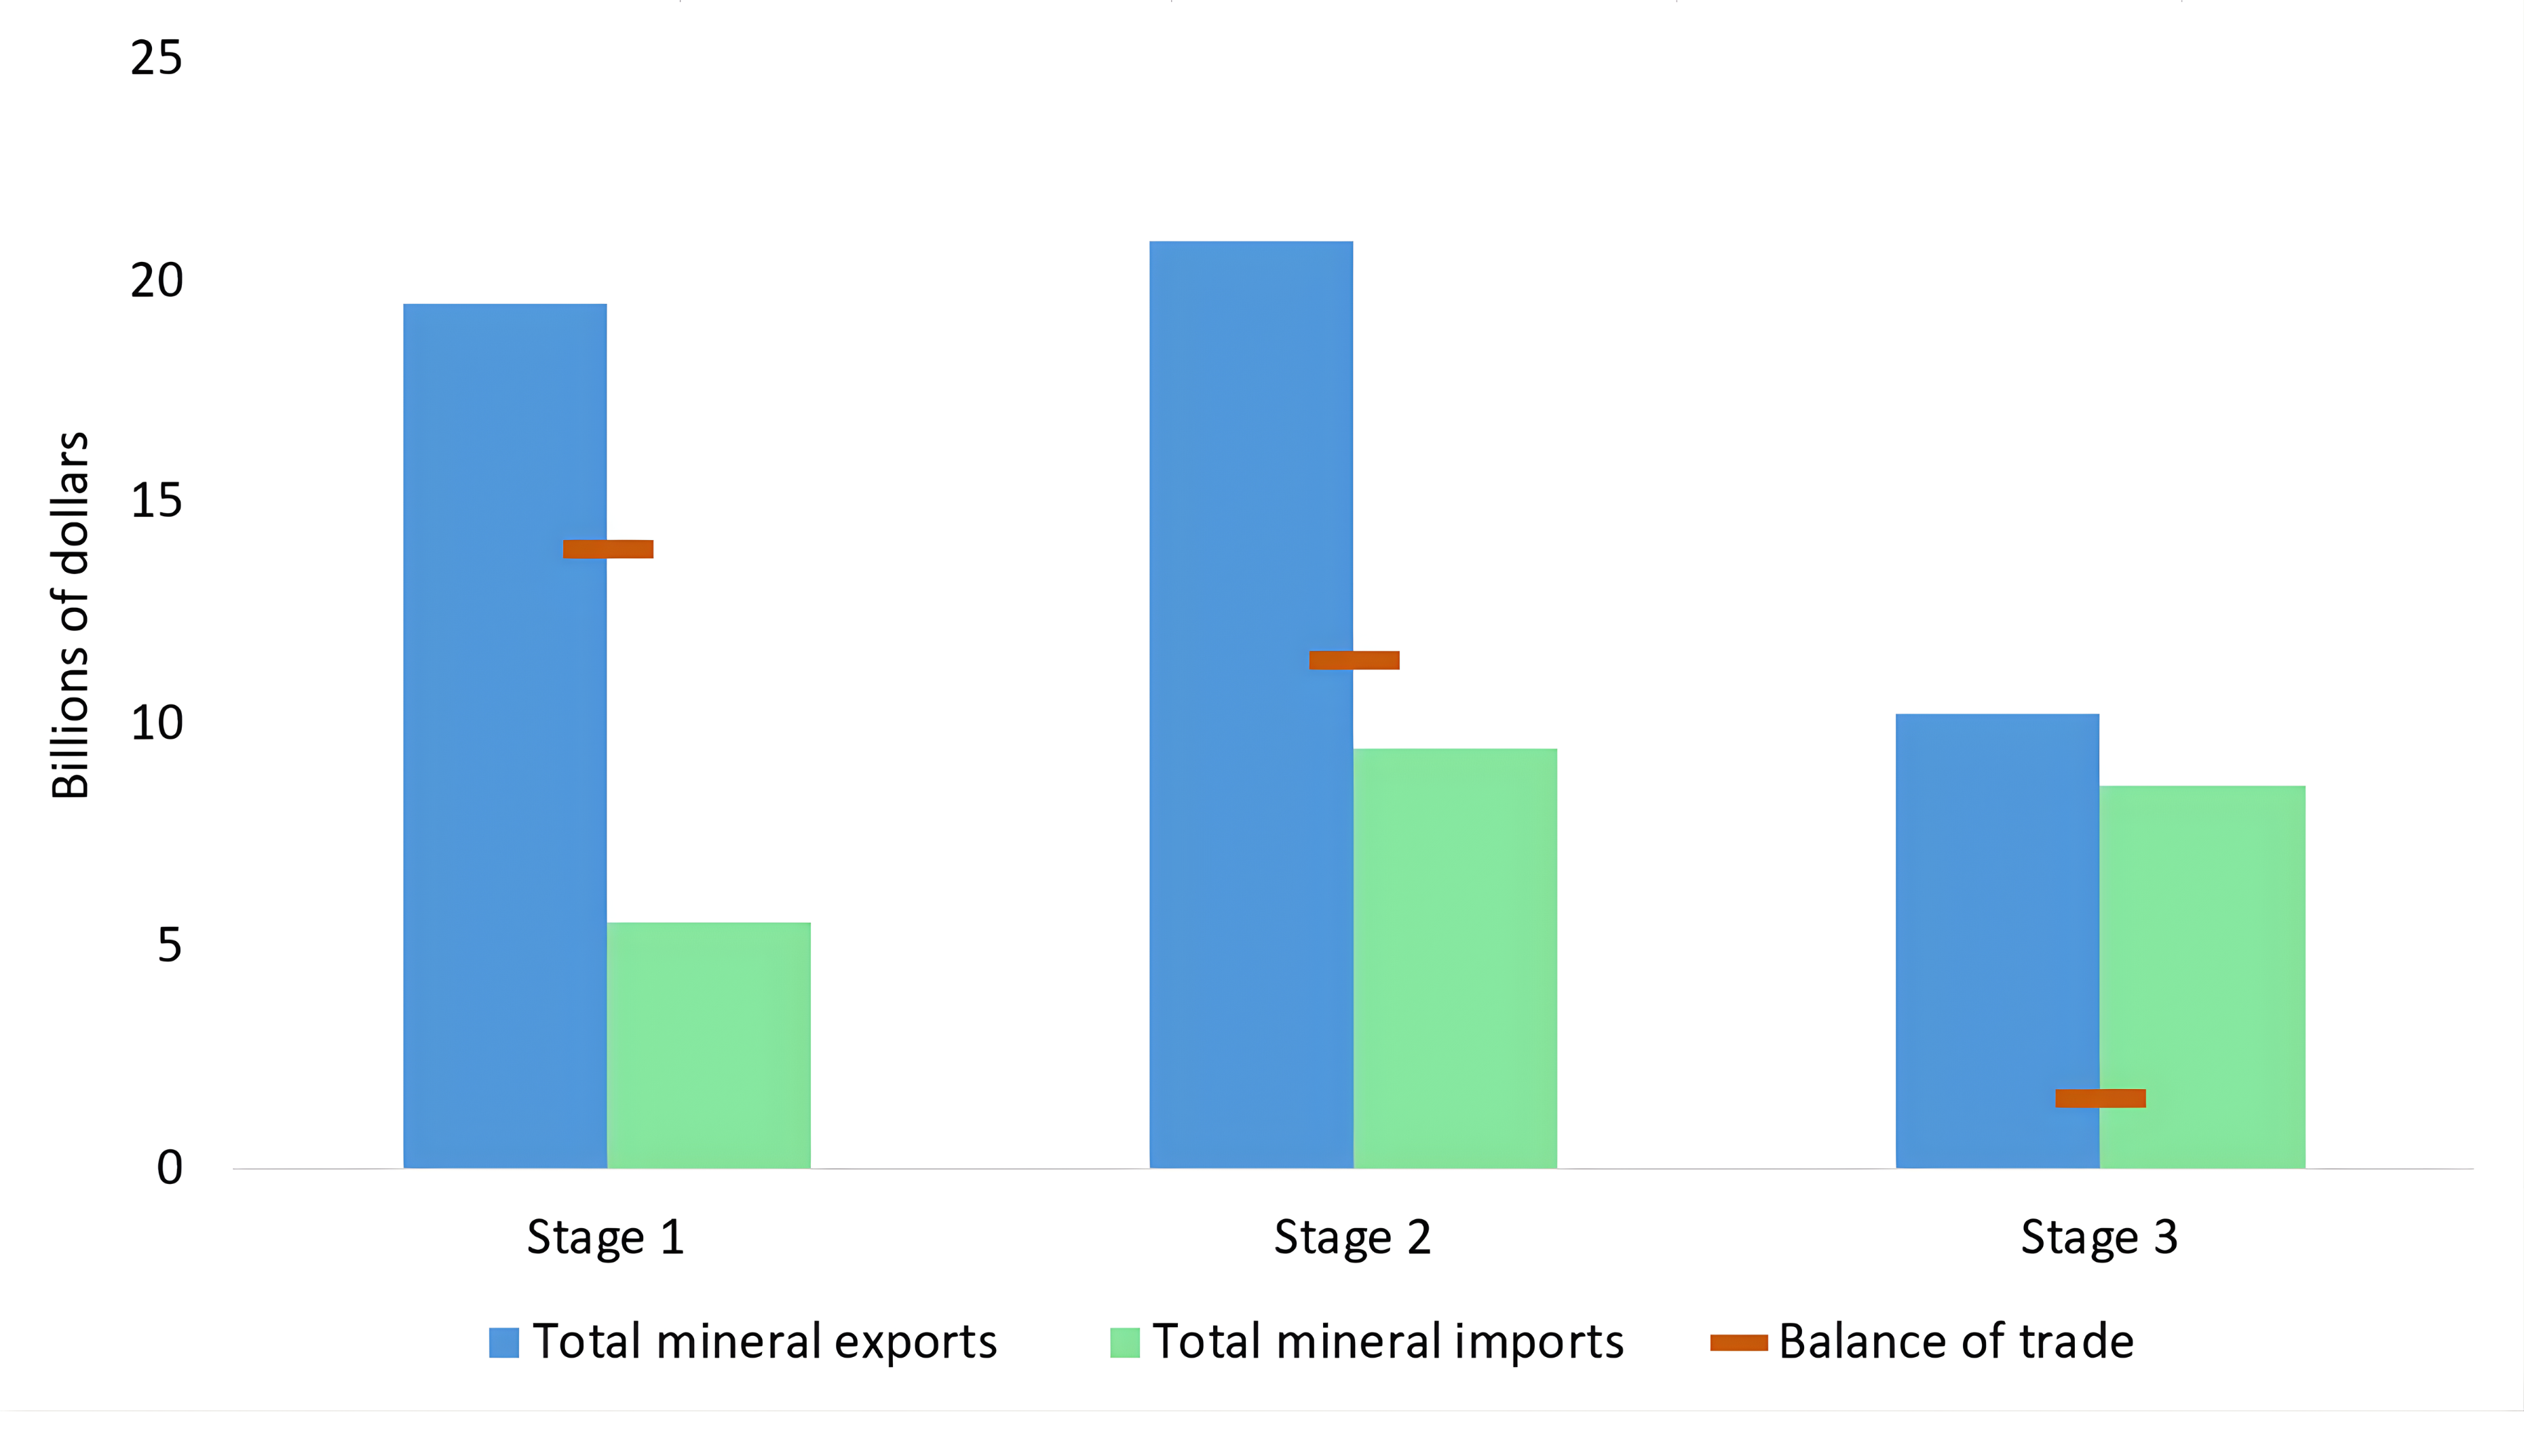
Data table – Figure 6
| Stage | Domestic exports | Total exports | Total imports | Balance of trade |
|---|---|---|---|---|
| Stage 1 — Primary products | 19.5 | 19.5 | 5.6 | 13.9 |
| Stage 2 — Smelting and refining products | 20.8 | 20.9 | 9.5 | 11.4 |
| Stage 3 — Semi-fabricated products | 9.2 | 10.2 | 8.7 | 1.6 |
| Total minerals and metals | 49.4 | 50.6 | 23.7 | 27.0 |
Note: Total exports (including re-exports) are displayed in Figure 6. Total exports (including re-exports) are used to calculate the balance of trade.
Sources: Natural Resources Canada, Statistics Canada.
Trade by province and territory
Most of Canada’s mineral trade is concentrated in Ontario and Quebec, with these two provinces accounting for 52% and 21% of exports, respectively. Ontario also led mineral imports, representing 63% of the total, while Quebec followed at 17%. This pattern reflects the significant processing of mine outputs within these provinces before export, along with the high concentration of manufacturing industries. It also highlights the strategic importance of Ontario and Quebec as entry points for Canadian imports, due to their proximity to major consumer markets.
From 2024 to 2025, provincial and territorial mineral export values showed mixed results, as illustrated in Figure 7. Several regions experienced a decline in exports, including Nunavut (-49%), Northwest Territories (-37%), Manitoba (-19%), Quebec (-8%), Alberta (-4%), British Columbia (-4%), and Nova Scotia (-3%). However, some regions saw increases, including Prince Edward Island (59%), Yukon (39%), Ontario (20%), Saskatchewan (4%), Newfoundland and Labrador (4%), and New Brunswick (4%).
The provinces and territories experiencing the largest fluctuations largely reflected commodity-specific developments and the composition of regional mineral exports. In Nunavut, the decline was primarily driven by lower gold exports, despite elevated gold prices; however, this may be temporary as new gold production ramps up, including at the Goose Mine, which achieved first gold production in 2025. In the Northwest Territories, the decline reflected continued weakness in diamond exports, with both values and quantities lower, reflecting structural factors, including the gradual depletion of existing diamond mines and softer global demand for natural diamonds, particularly amid weaker demand in key markets and growing competition from lab-grown diamonds. Yukon’s increase was supported by notably higher silver prices and output from the Keno Hill Mine, Canada’s only primary silver producer. While other Canadian mines produce silver, it’s usually as a by-product of other precious or base metals. Prince Edward Island also recorded strong growth despite having no operating mines, reflecting an increase in exports of fabricated metal products rather than mineral extraction.
Figure 7. Variation of mineral export values between 2024 and 2025, by province and territory
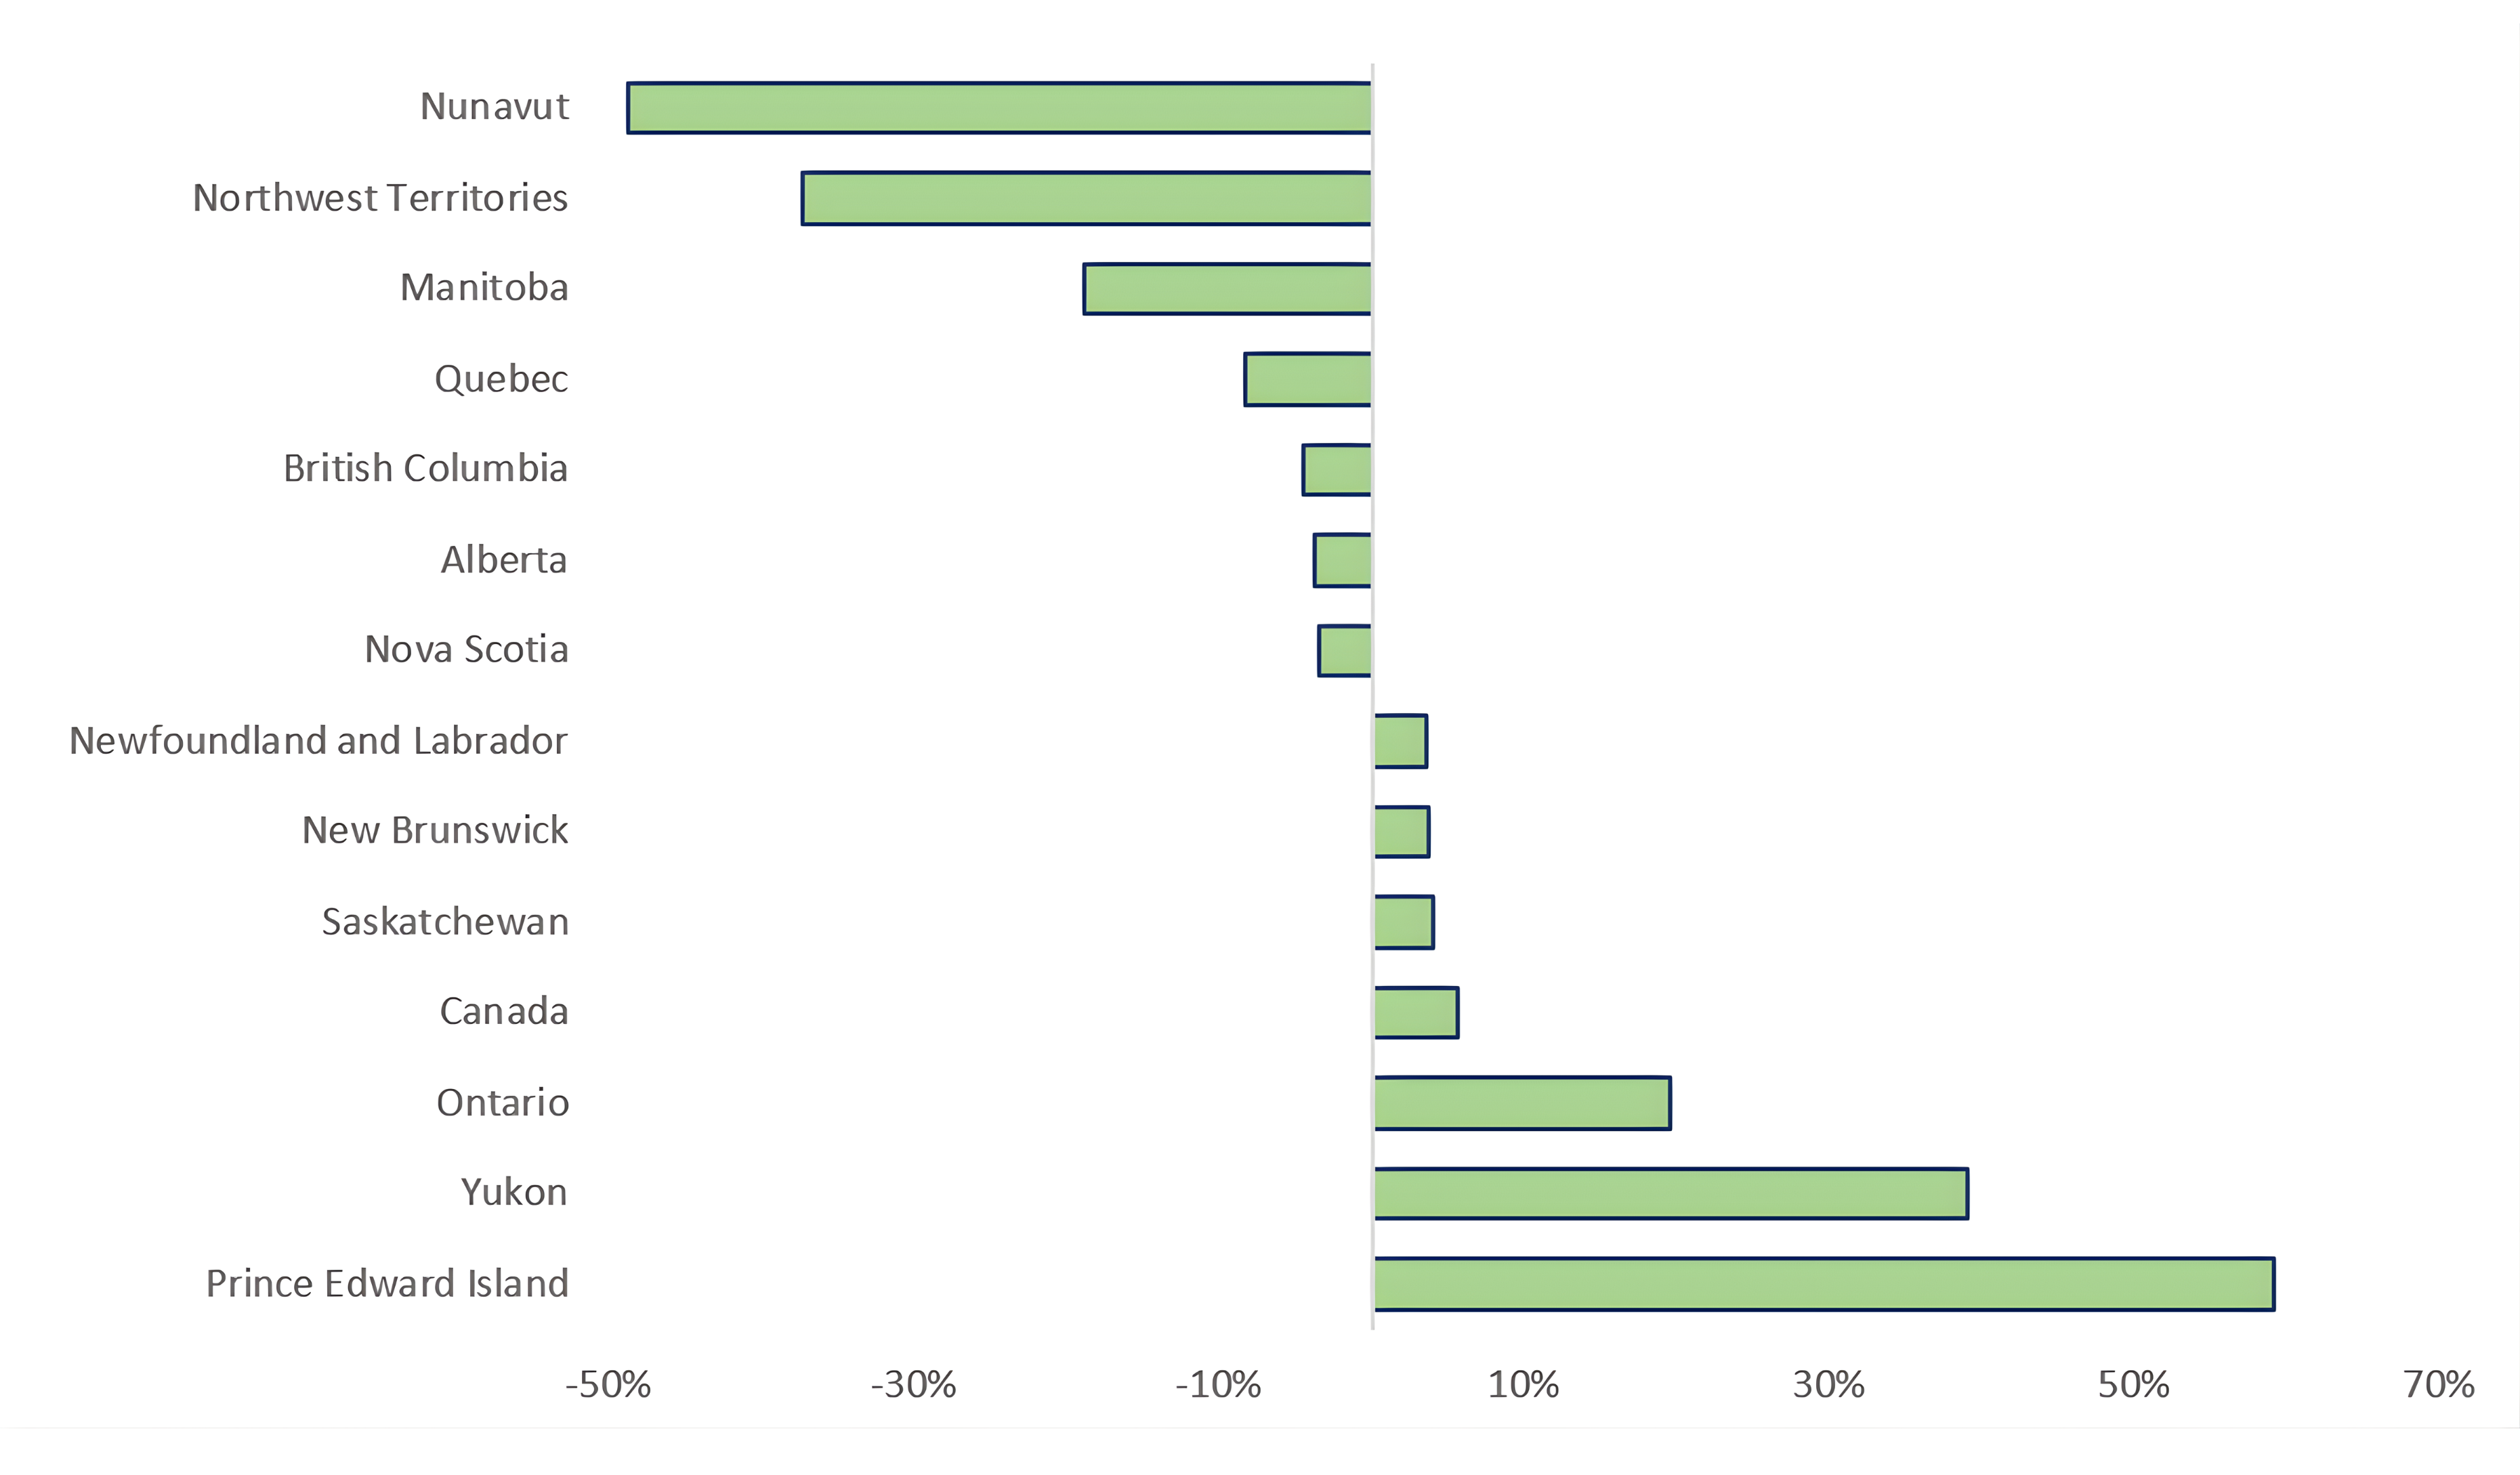
Text version — Figure 7
This chart illustrates the changes in the value of mineral and metal exports across provinces and territories between 2024 and 2025. Nunavut saw the largest decline (-49%), followed by Northwest Territories (-37%), Manitoba (-19%), Quebec (-8%), Alberta (-4%), British Columbia (-4%), and Nova Scotia (-3%). These declines were partially offset by increases in other regions, with Prince Edward Island recording the highest rise (59%), followed by Yukon (39%), Ontario (20%), Saskatchewan (4%), Newfoundland and Labrador (4%), and New Brunswick (4%). Overall, Canada experienced a 6% increase in the total export value.
Sources: Natural Resources Canada, Statistics Canada.
Mineral commodity exports represented a significant share of total merchandise exports for several provinces and territories—making up 34% of British Columbia’s exports, 32% of Ontario’s, 29% of Quebec’s, 28% of Newfoundland and Labrador’s, 27% of Saskatchewan’s, and nearly all of Yukon’s (96%), Nunavut’s (99.6%), and the Northwest Territories (99.9%).
Tables
| Country | Domestic exports | Total exports | Total imports | Balance of trade |
|---|---|---|---|---|
| United States | 72,681 | 76,388 | 52,920 | 23,468 |
| United Kingdom | 41,082 | 41,552 | 837 | 40,715 |
| China | 12,069 | 12,141 | 15,247 | -3,106 |
| Japan | 4,258 | 4,274 | 1,578 | 2,696 |
| Netherlands | 3,923 | 4,109 | 374 | 3,735 |
| South Korea | 3,611 | 3,618 | 2,269 | 1,349 |
| Germany | 2,662 | 2,989 | 2,990 | -1 |
| Belgium | 2,120 | 2,141 | 443 | 1,698 |
| Switzerland | 1,975 | 1,996 | 4,452 | -2,456 |
| Brazil | 1,809 | 1,831 | 7,230 | -5,399 |
| Norway | 1,787 | 1,793 | 192 | 1,601 |
| India | 1,586 | 1,605 | 2,513 | -908 |
| Indonesia | 1,039 | 1,043 | 394 | 649 |
| Mexico | 1,018 | 1,139 | 5,759 | -4,620 |
| Hong Kong | 1,005 | 1,031 | 103 | 928 |
| France | 890 | 953 | 974 | -21 |
| Malaysia | 753 | 757 | 440 | 317 |
| Taiwan | 719 | 723 | 1,801 | -1,078 |
| Australia | 715 | 747 | 2,044 | -1,297 |
| Italy | 632 | 648 | 2,008 | -1,360 |
| Spain | 574 | 634 | 1,204 | -570 |
| Other countries | 5,084 | 5,435 | 30,242 | -24,807 |
| Total | 162,004 | 167,558 | 136,026 | 31,532 |
Sources: Natural Resources Canada, Statistics Canada
| Province and territory | Domestic mineral exports | Total mineral exports | Total mineral imports | Total domestic exports | Domestic mineral exports as a percentage of the total |
|---|---|---|---|---|---|
| Ontario | 85,022,600 | 89,991,107 | 85,767,794 | 266,636,887 | 31.9% |
| Quebec | 33,574,878 | 33,915,611 | 22,807,138 | 117,851,827 | 28.5% |
| British Columbia | 18,699,443 | 18,787,024 | 12,650,116 | 54,661,113 | 34.2% |
| Saskatchewan | 11,807,201 | 11,831,271 | 2,272,011 | 43,534,430 | 27.1% |
| Alberta | 4,923,195 | 5,008,180 | 5,625,604 | 176,750,718 | 2.8% |
| Newfoundland and Labrador | 3,783,825 | 3,796,854 | 162,726 | 13,676,697 | 27.7% |
| Nunavut | 1,163,890 | 1,163,912 | 5,249 | 1,168,152 | 99.6% |
| Manitoba | 1,047,901 | 1,054,675 | 4,950,920 | 19,693,760 | 5.3% |
| Northwest Territories | 870,389 | 870,950 | 3 | 871,680 | 99.9% |
| Nova Scotia | 546,288 | 555,431 | 1,077,749 | 6,605,973 | 8.3% |
| New Brunswick | 345,068 | 346,782 | 659,884 | 16,038,173 | 2.2% |
| Yukon | 196,422 | 197,897 | 1,406 | 205,422 | 95.6% |
| Prince Edward Island | 23,149 | 38,748 | 45,264 | 2,567,161 | 0.9% |
| Canada | 162,004,249 | 167,558,441 | 136,025,865 | 720,261,994 | 22.5% |
Sources: Natural Resources Canada, Statistics Canada
| Critical mineral | Domestic exports | Total exports | Total imports | Balance of trade |
|---|---|---|---|---|
| Aluminum | 15,372,437 | 15,582,148 | 8,531,600 | 7,050,548 |
| Antimony | 1,991 | 6,656 | 107,589 | -100,933 |
| Bismuth | 1,240 | 2,094 | 4,912 | -2,818 |
| Chromium | 4,357 | 5,515 | 119,898 | -114,383 |
| Cobalt | 498,018 | 507,637 | 56,831 | 450,807 |
| Copper | 11,784,964 | 11,906,306 | 6,245,685 | 5,660,621 |
| Fluorspar | 12,314 | 12,692 | 193,010 | -180,319 |
| Germanium | 119,270 | 120,239 | 5,748 | 114,491 |
| Graphite | 79,162 | 92,547 | 243,750 | -151,203 |
| Helium | 125,323 | 125,323 | 46,258 | 79,065 |
| Lithium | n/a | 2 | 10,299 | -10,297 |
| Magnesium | 79,333 | 82,536 | 314,125 | -231,589 |
| Manganese | 777 | 7,698 | 238,979 | -231,281 |
| Molybdenum | 164,981 | 167,068 | 128,117 | 38,951 |
| Nickel | 4,320,228 | 4,382,753 | 1,140,292 | 3,242,461 |
| Niobium | 375,620 | 375,620 | 38,885 | 336,735 |
| Phosphate | 28,020 | 28,056 | 9,614 | 18,442 |
| Platinum group metals | 625,345 | 639,634 | 1,759,685 | -1,120,051 |
| Potash | 9,001,160 | 9,004,275 | 166,269 | 8,838,006 |
| Rare earth elements (REEs) | 2,683 | 7,113 | 7,343 | -230 |
| Silicon | 140,471 | 141,329 | 38,599 | 102,730 |
| Tantalum | 13,179 | 13,865 | 11,496 | 2,369 |
| Tellurium | 28,675 | 39,658 | 47,380 | -7,722 |
| Tin | 37,732 | 42,267 | 124,424 | -82,157 |
| Titanium metal | 238,686 | 256,427 | 356,832 | -100,405 |
| Tungsten | 52,880 | 58,529 | 66,702 | -8,173 |
| Uranium | 2,926,009 | 3,594,381 | 876,933 | 2,717,448 |
| Vanadium | 52,728 | 53,791 | 72,339 | -18,548 |
| Zinc | 1,933,136 | 1,935,129 | 1,522,185 | 412,943 |
| Other | 1,426,231 | 1,447,828 | 1,202,242 | 245,587 |
| Total | 49,446,952 | 50,639,116 | 23,688,020 | 26,951,096 |
Sources: Natural Resources Canada, Statistics Canada
n/a = not available
| Country | Domestic exports | Total exports | Total imports | Balance of trade |
|---|---|---|---|---|
| United States | 28,426 | 28,832 | 8,621 | 20,211 |
| China | 4,460 | 4,464 | 1,618 | 2,846 |
| Netherlands | 2,496 | 2,650 | 65 | 2,585 |
| Brazil | 1,662 | 1,663 | 2,564 | -901 |
| Germany | 1,548 | 1,772 | 392 | 1,380 |
| Japan | 1,383 | 1,383 | 127 | 1,257 |
| Norway | 1,376 | 1,377 | 122 | 1,255 |
| South Korea | 1,091 | 1,092 | 319 | 773 |
| Belgium | 975 | 976 | 193 | 783 |
| India | 804 | 806 | 336 | 470 |
| Indonesia | 672 | 672 | 51 | 622 |
| United Kingdom | 479 | 795 | 106 | 689 |
| Italy | 425 | 425 | 202 | 223 |
| Malaysia | 391 | 391 | 152 | 239 |
| Finland | 320 | 320 | 247 | 73 |
| France | 313 | 315 | 147 | 168 |
| Mexico | 285 | 318 | 325 | -7 |
| Thailand | 271 | 271 | 56 | 215 |
| Hong Kong | 213 | 214 | 4 | 210 |
| Taiwan | 212 | 213 | 60 | 153 |
| Other Countries | 1,645 | 1,691 | 7,984 | -6,293 |
| Total | 49,447 | 50,639 | 23,688 | 26,951 |
Sources: Natural Resources Canada, Statistics Canada.