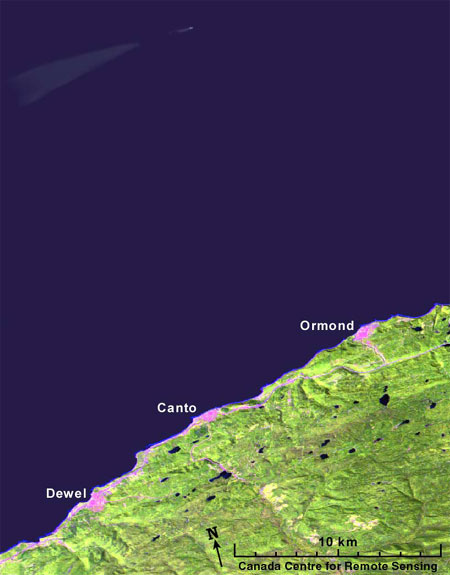
June 10 image
What do we see on the satellite image of June 10? About 20 km offshore, we see a ship travelling parallel to the coastline, and it looks like it has released some oily material. The lighter blue tone located behind the ship is an oil slick floating on the water surface. If the water current pushes that slick towards the coast, then the shoreline will be polluted with oil! If we act quickly, we can send people and equipment to try to protect the shore with floating barriers. But where do we send them? Should we send the team to Dewel, Canto, or Ormond? These towns show up as pink areas on the coast, because the image is processed to show vegetation as green and yellow, and nonvegetated areas like pavement and bare earth as pink. These are not the real colours that we would normally see by eye.

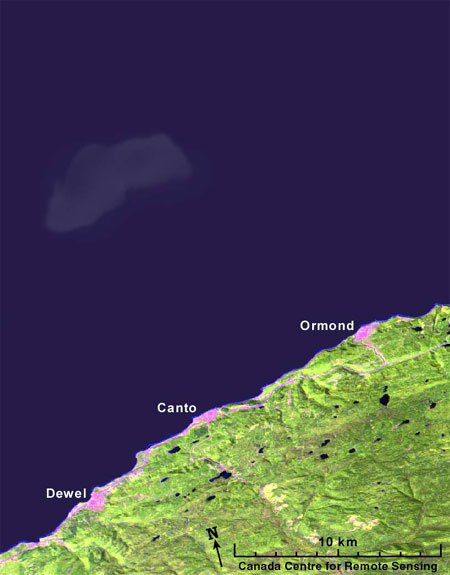
June 12 image
We managed to get another satellite image of this area, two days later. The image of June 12 shows the slick (the ship itself is long gone) as it spread and moved towards the coast. But it didn't move exactly in the direction that we expected. Wind, waves, currents and tide combined in a complicated way can make it difficult to predict the slick motion. But with this second image, we can tell how the slick actually moved.

If you know that the water current is coming from the north-west, you should be able to estimate which part of the coast the oil slick will reach. The nearest town is where we should send our clean-up team. Considering only what we knew on June 10th, which town should it be?
Answer: _________________________
Trace the outline of the slick on the June 12 image onto a sheet of acetate. Also trace the coastline onto the same acetate. Position this acetate carefully on top of the June 10 image by matching the coastline on the acetate with the coastline on the image. Draw a straight line on the acetate joining the approximate middles of the two oilslick positions. Extend this straight line until it hits the coastline. If the oilslick keeps moving the way it has in the last two days, then it should hit the coastline near the town of:
Answer: ________________________
How long will it be before the slick reaches the coast? No more hints or instructions for this! You figure it out! The slick will arrive on:
June _________________________
We also need to know how many floating barriers to send to this location. It will depend on how much oil there is in the slick. Measure the area of the slick on the July 12 image using the dot grid technique in Appendix A. Each five dots that you count, represents 1 square kilometre. We will need to send 4 barriers for each square kilometre of slick that we measure. How many do we send?
Answer: ________________________