
SmartWay Transport Partnership: 2021 Truck Carrier Benchmarking Report
N.B. This is a sample report and may differ from the original version
Partner Name: Company X
SmartWay – Years in Program: 2019 - Present
Partner and Operation Type: Truck Carrier – TL/Dry Van Operations
Primary Contact: XXX
Partner Account Manager: XXX
Logo Status: Qualified
1. About Your Benchmarking Report
The 2022 Truck Carrier Benchmarking Report is provided to each truck carrier company that registers for SmartWay through Natural Resources Canada. The purpose of this report is to provide you with additional information to help you track your year-to-year changes and to help you benchmark your performance against your peers. This report also provides you with information about your emissions binning. The information in this report is shared only with you.
For more information about this report and its contents, these free resources or on the SmartWay program in general, please contact SmartWayCanada@nrcan-rncan.gc.ca.
2. Partner Performance Improvement
Natural Resources Canada is committed to helping its SmartWay partners reduce their fuel consumption and improve their performance. Natural Resources Canada has a variety of FREE resources available to help you reduce your fuel consumption, including:
- Fuel efficient driver training
- Fuel management training
- Information on SmartWay-certified technologies
- A forecasting tool to help fleet managers with purchasing decisions
3. Emissions Bins
All SmartWay-registered truck carriers are ranked for each of the six emissions metrics used in the SmartWay Transport Partnership. All fleets are sorted into five bins for each of these metrics, with the top 20% of carriers for each emission put in the first bin, the next 20% in the second bin, and so on. The midpoint value for each bin is calculated and this number is the publicly-available emissions value for the truck carriers in that bin. Carriers are only binned with similar carriers (e.g. tankers with other tankers, auto haulers with other auto haulers) to allow for a better comparison. Figure 1 below shows the 2022 bin rankings for Company X
| Measurement | CO2 | NOx | PM |
|---|---|---|---|
| g/km | 4 | 5 | 5 |
| g/tonne-km | 5 | 5 | 5 |
SmartWay carriers in Bin 1 are in the top 20% of performers in their operation type, carriers in Bin 2 are in the next 20% and so on, with carriers in Bin 5 being in the bottom 20%. Since we do not have company data for non-SmartWay carriers, by default they are attributed higher emissions compared to SmartWay partners.
4. Benchmarking
This section contains four graphs showing Company X's relative performance against other SmartWay-registered TL/Dry Van Operation Fleets (the red dot in each graph represents Company X's performance).
The four graphs show:
- Fuel Consumption (L/100km)
- Idling Hours (avg. hours per truck per year)
- Average Payload (tonnes)
- Average Kilometres per Truck (km)
Please note that the information shown in these graphs is meant to provide a comparison of your fleet's operational performance against similar fleets but does not consider outside factors which could affect your relative performance. For example, the L/100km graph does not consider the impacts of operating in different climates when measuring fuel consumption.
Fuel Consumption
Company X's fuel consumption of 38.386 L/100km ranks 932 out of 1217 SmartWay TL/Dry Van Operation truck carriers. It is important to note that fuel consumption is influenced by many factors, including vehicle size, engine year, payload, idling, geography, etc. Many strategies and practices are available to help reduce fuel consumption. If you would like more information on these, please contact your Partner Account Manager.
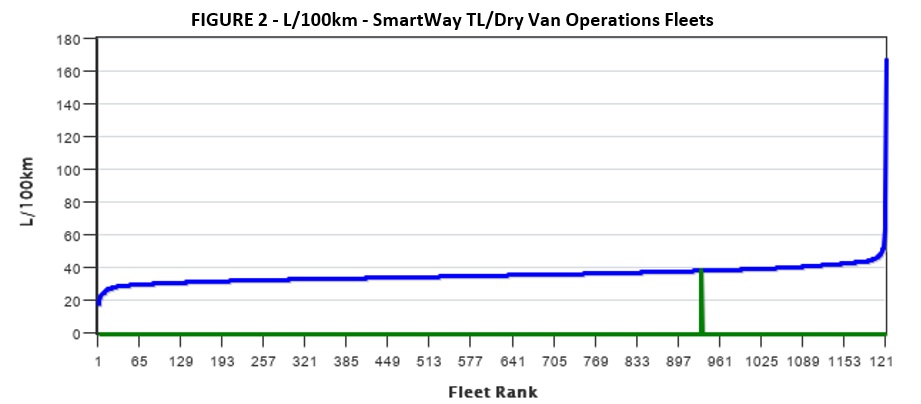
| Fuel Consumption (L/100km) | Fleet Rank | Total # of SmartWay TL/Dry Van Operations Fleets |
|---|---|---|
| 38.386 | 932 | 1217 |
Idling Hours
Idling hours refers to the time a truck spends with the engine running but not moving. Idling hours can be long-duration, such as idling overnight or short duration, such as idling in traffic. At 900 hours per truck per year, Company X ranks 766 out of 1217 SmartWay TL/Dry Van Operation truck carriers in average idling hours. Higher idling hours can result in increased fuel consumption and can be minimized through the use of auxiliary power units, the implementation of idling reduction strategies/policies, and/or through improved routing.
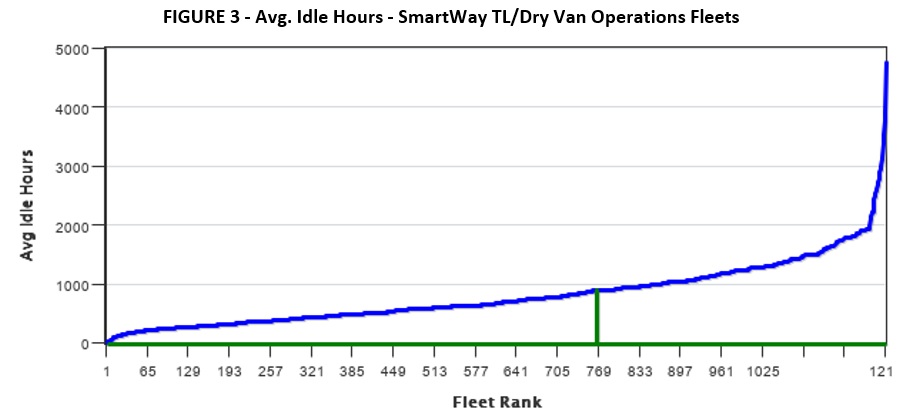
| Average Idle Hours | Fleet Rank | Total # of SmartWay TL/Dry Van Operations Fleets |
|---|---|---|
| 900 | 766 | 1217 |
Average Payload
Average payload is the average weight of the freight being hauled on each trip. Company X’s average payload of 15.00 tonnes ranks 223 out of 1217 SmartWay TL/Dry Van Operation truck carriers. A carrier's average payload can significantly influence its fuel economy. For companies with higher average payloads, the grams per tonne-km bin metrics shown on the first page of this report may be a better indicator of the carrier's relative performance than the grams per km metrics. The average payload is affected primarily by vehicle class and the type of commodity being hauled (e.g. lighter-weight commodities generally have lower payloads than heavier commodities).
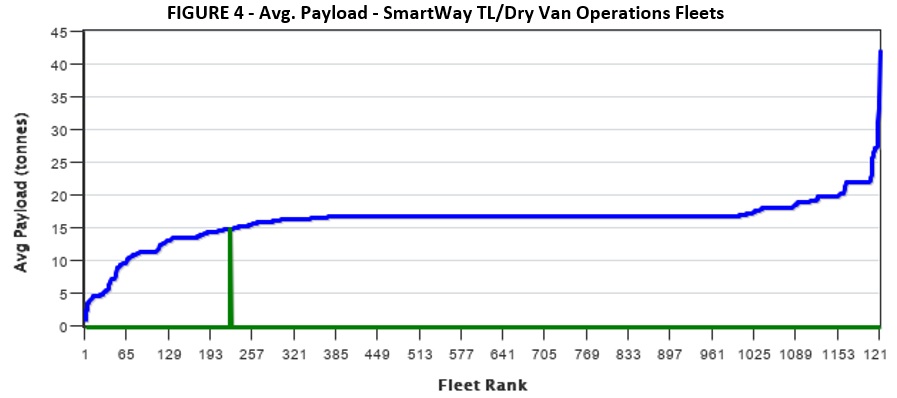
| Average Payload (Tonnes) | Fleet Rank | Total # of SmartWay TL/Dry Van Operations Fleets |
|---|---|---|
| 15.00 | 223 | 1217 |
Average Kilometres per Truck
With an annual average of 152,427 km per truck Company X ranked 399 out of 1217 in average kilometres per truck among SmartWay TL/Dry Van Operation truck carriers.
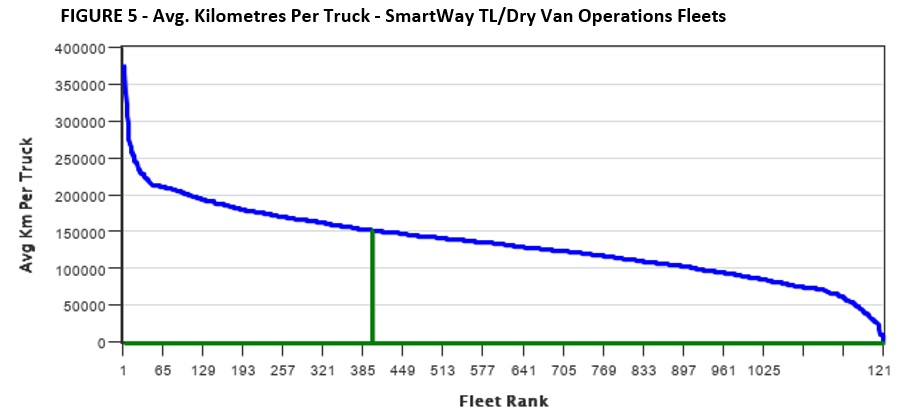
| Annual Average Kilometres Per Truck | Fleet Rank | Total # of SmartWay TL/Dry Van Operations Fleets |
|---|---|---|
| 152,427 | 399 | 1217 |
5. Year-to-Year Improvement and Comparison
The table below summarizes the year-to-year changes for seven metrics, both for Company X and for the SmartWay TL/Dry Van Operation fleets as a whole. This table can help you measure your year-to-year progress against fleets with similar operation types. You can also compare your emissions ranking against your peers on the SmartWay Web site at SmartWay under "Carrier Emissions Results".
| 2022 | 2021 | % Change | |
|---|---|---|---|
| L/100km | |||
| Company X | 38.386 | 38.459 | -0.19% |
| TL/Dry Van Operations Average | 33.017 | 33.311 | -0.88% |
| Average Idling Hours | |||
| Company X | 900 | 204 | 341.18% |
| TL/Dry Van Operations Average | 652 | 643 | 1.43% |
| Average Payload (tonnes) | |||
| Company X | 15 | 15.00 | 0.00% |
| TL/Dry Van Operations Average | 16.76 | 16.66 | 0.58% |
| CO2 g/tonne-km | |||
| Company X | 69 | 69 | -0.19% |
| TL/Dry Van Operations Average | 53 | 54 | -1.60% |
| NOx g/tonne-km | |||
| Company X | 0.53 | 0.92 | -42.56% |
| TL/Dry Van Operations Average | 0.09 | 0.09 | -0.93% |
| PM2.5 g/tonne-km | |||
| Company X | 0.01119 | 0.02986 | -62.51% |
| TL/Dry Van Operations Average | 0.00052 | 0.00059 | -12.33% |
Page details
- Date modified: