
SmartWay provides information on the freight sector and the performance of the SmartWay program. This information is based on annual aggregated data provided by participants of SmartWay.
Graph 1
2017: For-hire fleets represent 86% of total SmartWay Truck fleets in North America
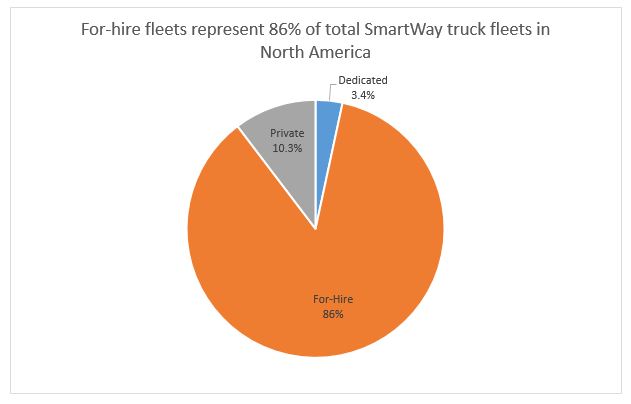
Figure 1 breaks down SmartWay Truck fleets into three types of operations: private, dedicated and for-hire. Private fleets primarily haul for a parent company, and dedicated fleets are primarily reserved for one customer. For-hire fleets provide freight transportation services to customers, and are contracted out on a per use basis. As indicated in Figure 1, for-hire fleets represent 86% of total SmartWay Truck fleets in North America. This is likely due to the fact that for-hire companies compete for contracts, and it is important to demonstrate efficiency to secure them.
| Percentage of private SmartWay truck fleets (%) | Percentage of for-hire SmartWay truck fleets (%) | Percentage of dedicated SmartWay truck fleets (%) | |
|---|---|---|---|
| 2017 | 10.3 | 86 | 3.4 |
Graph 2
2014-2017: For-hire fleets use less fuel per tonne kilometer on average
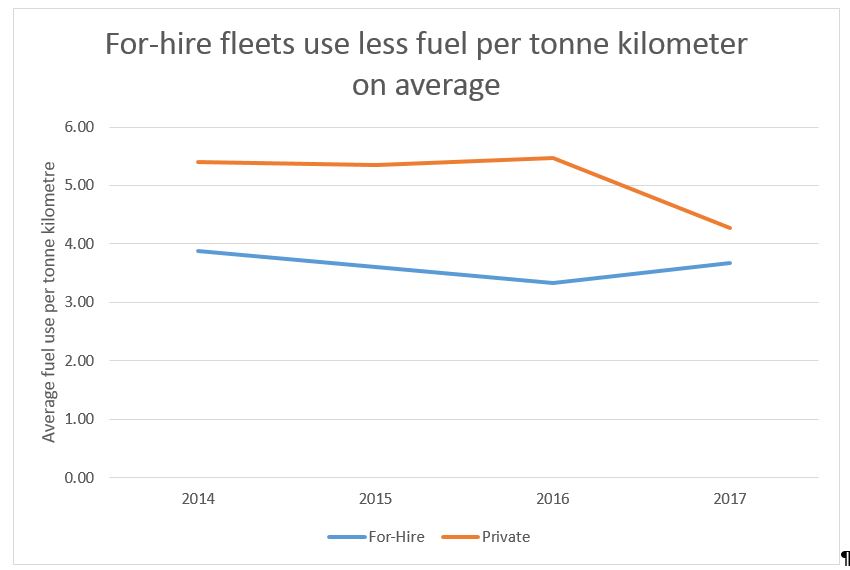
Figure 2 demonstrates the average fuel use (L/100 tonne km) for private and for-hire SmartWay truck fleets. A fleet’s fuel usage per tonne kilometer is a good indicator as it takes into account both, the amount of fuel used and payload to calculate efficiency. For-hire fleets, which account for 86% of trucks registered in SmartWay, consume less fuel per tonne kilometer than private carriers. A potential reason for this is the adoption of cost reduction strategies such as route optimization and back hauling, which increase efficiency and give companies an advantage when competing for contracts.
| Data Year | L/100 tonne km for-hire fleets | L/100 tonne km private fleets |
|---|---|---|
| 2014 | 3.88 | 5.40 |
| 2015 | 3.60 | 5.36 |
| 2016 | 3.34 | 5.48 |
| 2017 | 3.67 | 4.27 |
Graph 3
2014-2017: The percentage of empty kilometers are higher for private fleets than for-hire fleets
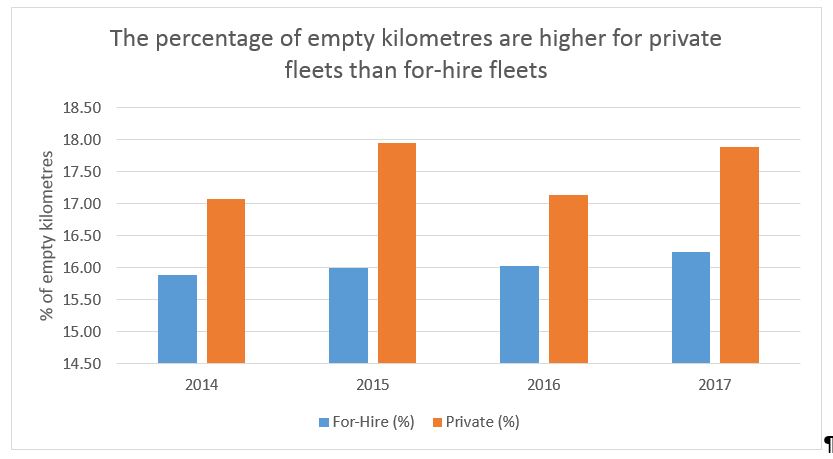
Figure 3 identifies the difference between for-hire fleets and private fleets in regard to their average percentage of empty kilometres. Empty kilometres are kilometres driven without a payload. For-hire fleets had a lower percentage of empty kilometres than private fleets in each year between 2014 and 2017. One potential reason for this is that private fleets usually move freight for just one company, making it more difficult to find freight for back-haul trips.
| Percentage of empty kilometers for for-hire fleets (%) | Percentage of empty kilometres for private fleets (%) | |
|---|---|---|
| 2014 | 15.89 | 17.07 |
| 2015 | 16.00 | 17.95 |
| 2016 | 16.02 | 17.14 |
| 2017 | 16.24 | 17.89 |
Archived SmartWay Trends and Statistics
2016 - Average idle hours in 2016 were lower for Canadian truck carriers who have been in the SmartWay program for more years
Average idle hours in 2016 were lower for Canadian truck carriers who have been in the SmartWay program for more years
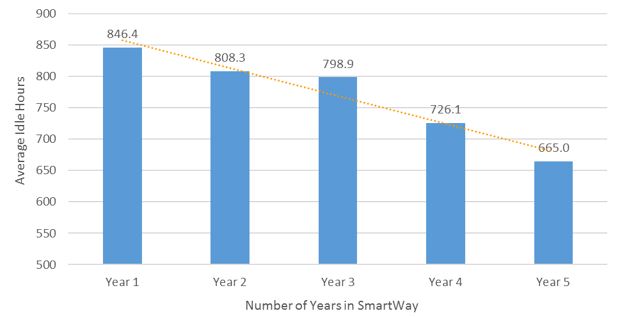
Graph 1 shows the average idling hours in 2016 (2017 data is not yet available) for Canadian truck carrier partners in their first year with the SmartWay program (represented by year 1) up to partners who have been in the program since 2012 (represented by year 5). The average idle hours displayed in this graph are generally lower for partners who have been in the SmartWay program for more years with a rate of decrease of 5.9%. Thus, it can be said that SmartWay truck carriers tend to decrease their average idle hours the longer that they remain in the SmartWay program. A possible explanation for this trend is that, through benchmarking their operations year-over-year, returning SmartWay partners have been able to identify their weaknesses and make improvements where needed, including their hours of idle time. Contrarily, new partners are still in the process of identifying their areas for improvement and it may take some time to implement the proper measures to reduce their idle hours.
| Number of Years in SmartWay | Average Idle Hours |
|---|---|
| Year 1 | 846.4 |
| Year 2 | 808.3 |
| Year 3 | 798.9 |
| Year 4 | 726.1 |
| Year 5 | 665.0 |
2016 - Canadian Class 8 truck fleets that have been in the SmartWay program for more years used less fuel per 100 kilometres in 2016 compared to new partner
Canadian Class 8 truck fleets that have been in the SmartWay program for more years used less fuel per 100 kilometres in 2016 compared to new partners
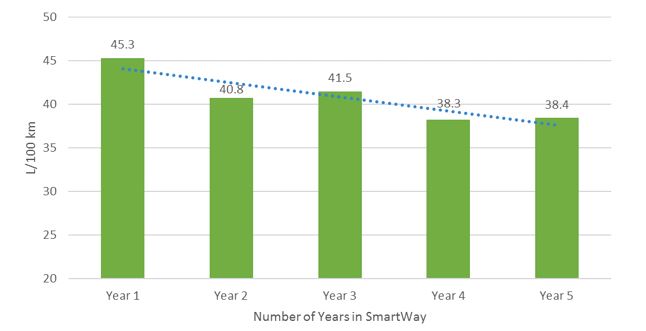
Graph 2 shows the average litres of fuel used per 100 kilometres in 2016 (2017 data is not yet available) for Canadian class 8 truck carrier partners in their first year with the SmartWay program (represented by Year 1) up to partners who have been in the program since 2012 (represented by Year 5). The average litres of fuel per 100 kilometres displayed in this graph have a downward sloping trend, decreasing at a rate of 3.9%, as the number of years that class 8 truck fleets have been in the SmartWay program increases. This is an indication that SmartWay class 8 truck fleets tend to use less fuel per 100 kilometres on average, the longer that they remain in the SmartWay program. A possible explanation for this trend is that returning SmartWay partners have made a conscious effort to improve their fuel efficiency as a reflection of remaining in the program, while new partners may still be in the process of identifying where to make improvements in their operations.
| Number of Years in SmartWay | Average L/100 KM |
|---|---|
| Year 1 | 45.3 |
| Year 2 | 40.8 |
| Year 3 | 41.5 |
| Year 4 | 38.3 |
| Year 5 | 38.4 |
2016 - Canadian Class 8 truck fleets that have been in the SmartWay program for more years emitted less CO2 per kilometre in 2016 compared to newer partners
Canadian Class 8 truck fleets that have been in the SmartWay program for more years emitted less CO2 per kilometre in 2016 compared to newer partners
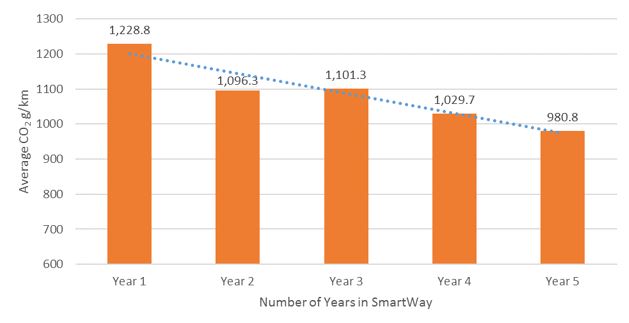
Graph 3 shows the average CO2 emitted in grams per kilometre in 2016 (2017 data is not yet available) for Canadian class 8 truck carrier partners in their first year with the SmartWay program (represented by Year 1) up to partners who have been in the program since 2012 (represented by Year 5). The average CO2 emitted in grams per kilometre displayed in this graph tends to decrease (at a rate of 5.1%) as the number of years that a partner has been in SmartWay increases. This finding is strongly correlated with Graph 2, which shows that, in 2016, class 8 truck fleets in their fifth year with SmartWay used less fuel per 100 kilometres on average, than fleets in their first year with SmartWay. This is an indication, through benchmarking their operations year-over-year, returning SmartWay partners have been able to identify their level of emissions and make operational improvements where needed.
| Number of Years in SmartWay | Average CO2 g/km |
|---|---|
| Year 1 | 1228.8 |
| Year 2 | 1096.3 |
| Year 3 | 1101.3 |
| Year 4 | 1029.7 |
| Year 5 | 980.8 |
2014-2016 : Truck fleets hired by SmartWay Shippers are reducing their CO2 emissions
Truck fleets hired by SmartWay Shippers are reducing their CO2 emissions
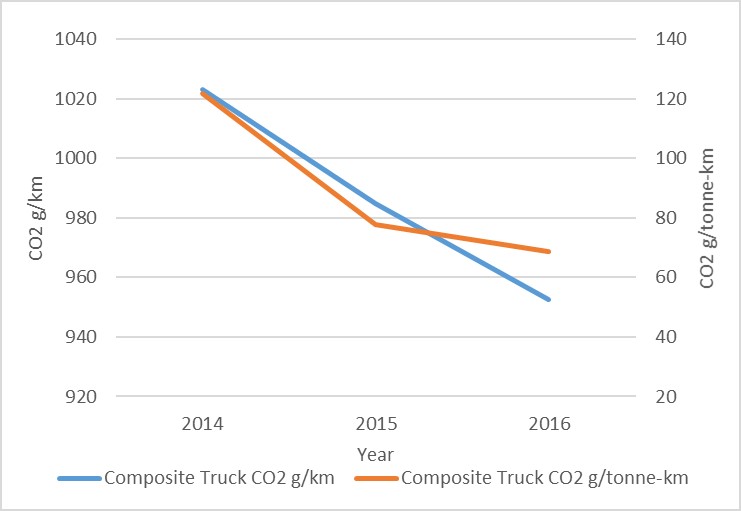
Graph 1 shows the average composite CO2 in grams per kilometre emitted by trucks hired by SmartWay shippers. This graph also shows the average composite CO2 in grams per tonne-kilometre emitted by trucks hired by SmartWay shippers. Data shows that from 2014 to 2016 (2017 data is not yet available), truck carriers hired by SmartWay shippers are decreasing their levels of CO2 in grams per kilometre and per tonne-kilometre. As SmartWay shippers work towards lowering their GHG emissions, they are hiring carriers with lower emitting trucks while encouraging their existing truck carriers to be more fuel-efficient. This trend is expected to continue as SmartWay shippers work towards greening their operations.
| Year | Composite Truck CO2 g/km | Composite Truck CO2 g/tonne-km |
|---|---|---|
| 2014 | 1023.08 | 121.63 |
| 2015 | 984.86 | 77.63 |
| 2016 | 952.64 | 68.82 |
2014-2016: SmartWay Shippers are increasing their Total Kilometres logged on average
SmartWay Shippers are increasing their Total Kilometres logged on average
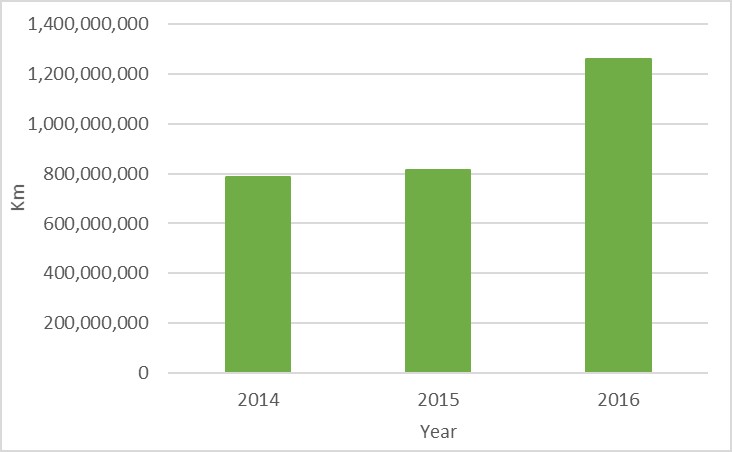
Graph 2 shows the average total kilometres logged by SmartWay shippers from 2014 to 2016 (2017 data is not yet available). On average, SmartWay shippers are increasing their total kilometres over the last three years. As shown in Graph 1, SmartWay shippers are not only increasing total kilometres logged, but their truck carriers are also reducing CO2 g/km. This is could be attributed to SmartWay shippers increasing their business while improving fuel-efficiency.
| Year | Average of Total KM |
|---|---|
| 2014 | 785,174,364.81 |
| 2015 | 813,330,250.51 |
| 2016 | 1,258,702,715.52 |
2014-2016: SmartWay Shippers are increasing their Total Tonne-Kilometres logged on average
SmartWay Shippers are increasing their Total Tonne-Kilometres logged on average
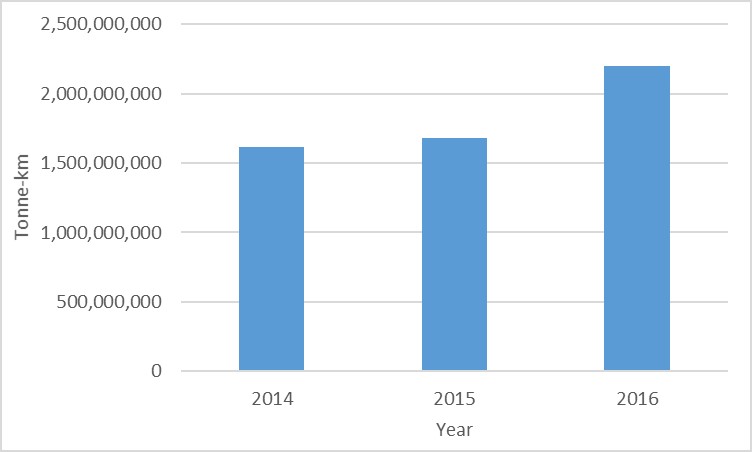
Graph 3 shows the average total tonne-kilometres logged by SmartWay shippers from 2014 to 2016 (2017 data is not yet available). On average, SmartWay shippers are increasing their total tonne-kilometres over the last three years. As shown in Graph 1, SmartWay shippers are not only increasing total tonne-kilometres logged, but their truck carriers are also reducing CO2 g/tkm. This is an indication that SmartWay shippers are transporting more goods per haul while improving fuel-efficiency.
| Year | Average of Total Tonne KM |
|---|---|
| 2014 | 1,617,754,618.76 |
| 2015 | 1,676,698,213.53 |
| 2016 | 2,196,393,443.55 |
2015: Fuel reduction activities SmartWay Shippers reported implementing in 2015
Fuel reduction activities SmartWay Shippers reported implementing in 2015
.JPG)
Graph 1 identifies several fuel reduction activities and the percentage of SmartWay shipper companies that reported implementing them in 2015. The most popular fuel reduction measure implemented by SmartWay shippers was consolidation of shipment/load maximization. This activity is even more important for shipping companies as their operational costs are directly impacted by the amount of goods they are moving per haul. Additionally, the graph shows that SmartWay shippers encourage improved routing, as route optimization helps lower transportation costs. Only 6.25% of shipper companies reported to using no fuel reduction technologies in 2015, down by 41% since 2014. Many of these shippers were new to the program in 2014, thus most of the fuel reduction activities listed in this graph were not adopted until 2015. SmartWay shippers are making continued effort to improve their fuel efficiency and minimize their operation costs by implementing technologies and best practices to reduce GHG emissions.
*Please note that SmartWay shipper data for 2016 will be available in December 2017.
| Fuel Reduction Activity | Percentage of partners (%) |
|---|---|
| Consolidation of shipments/load maximization | 68.75 |
| Improved routing | 56.25 |
| Increased use of intermodal shipping | 43.75 |
| Flexible loading and receiving schedules | 43.75 |
| Increased use of backhauling to minimize empty kilometers | 43.75 |
| No-idle policies for carriers during loading/unloading | 37.5 |
| Using SmartWay participation as a criteria in selection | 37.5 |
| Using environmental performance as a criteria in selection | 18.75 |
| None | 6.25 |
2016: Fuel reduction activities SmartWay Logistic companies reported implementing in 2016
Fuel reduction activities SmartWay Logistic companies reported implementing in 2016
.JPG)
Graph 2 identifies several fuel reduction activities and the percentage of SmartWay logistic companies that reported implementing them in 2016. These activities include the utilization of technologies as well as company best practices to reduce fuel use and GHG emissions. Similar to SmartWay shippers, the most popular fuel reduction measure implemented by logistics partners was consolidation of shipment/load maximization, a measure widely promoted as it can reduce the number of trucks on the road by maximizing trailer capacity utilization. Additionally, the graph shows that SmartWay logistic companies factor in SmartWay certification when selecting carriers in an effort to green their supply chain operations. Only 10% of logistic companies reported to having implemented no fuel reduction activities in 2016, which is down 4.7% from 2015. SmartWay logistic partners are therefore, increasing their adoption of fuel reduction technologies and best practices to maximize the efficiency of their operations.
| Fuel Reduction Activity | Percentage of partners (%) |
|---|---|
| Consolidation of shipments/load maximization | 59.0 |
| Using SmartWay participation as a criteria in selection | 52.0 |
| Improved routing | 51.0 |
| Flexible loading and receiving schedules | 45.0 |
| Increased use of intermodal shipping | 41.0 |
| Increased use of backhauling to minimize empty kilometers | 38.0 |
| Using environmental performance as a criteria in selection | 31.0 |
| None | 10.0 |
2016: Fuel reduction activities SmartWay Truck carriers reported implementing in 2016
Fuel reduction activities SmartWay Truck carriers reported implementing in 2016
.JPG)
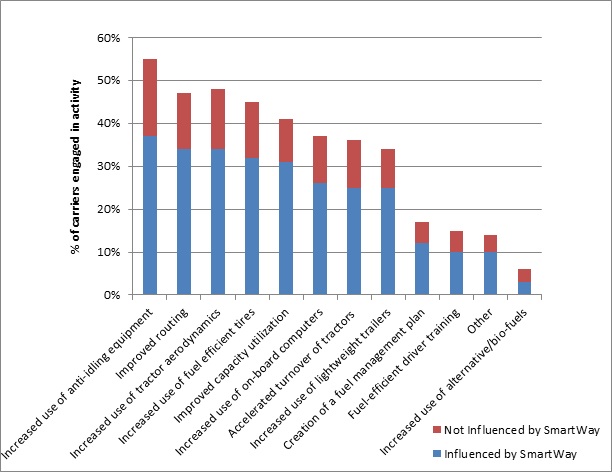
Graph 3 identifies several fuel reduction activities and the percentage of SmartWay truck carriers that adopted them in 2016. The most popular fuel reduction measure was improved routing, a measure that attributes to significantly better fuel economy. Route optimization helps carriers reduce travel time and cut transportation costs. Additionally, the data shows that SmartWay truck carriers increased their use of trailer/tractor aerodynamics and anti-idling equipment. The use of these technologies also contributes to better fuel economy. Only 6.1% of truck carriers reported to using no fuel reduction technologies in 2016, which is down by 1.9% from 2015. SmartWay truck carriers are therefore, increasing their adoption of fuel reduction activities in an effort to reduce their carbon footprint.
| Fuel Reduction Activity | Percentage of partners (%) |
|---|---|
| Improved routing | 57.6 |
| Increased use of anti-idling equipment | 53.1 |
| Increased use of tractor/trailer aerodynamics | 48.5 |
| Increased use of electronic on-board devices | 39.3 |
| Increased use of lightweight trailers | 38.2 |
| Driver Incentive Program | 33.7 |
| Increased use of low-rolling resistance tires | 31.3 |
| Fuel-efficient driver training | 12.5 |
| None | 6.1 |
2014-2016: Number of SmartWay Truck Carriers are increasing
Number of SmartWay Truck Carriers are increasing
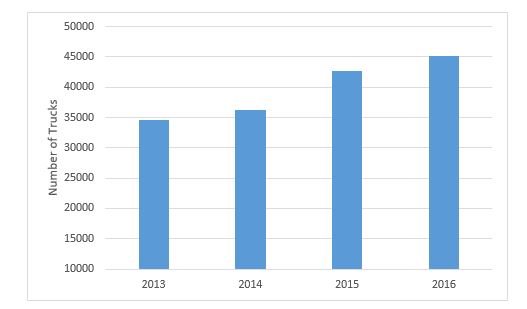
As shown in the graph, the total number of trucks in the SmartWay program have been increasing steadily, seeing an increase of 2,470 trucks in 2016. The average number of trucks for 2016 also increased by 5% since 2015. This increase can be attributed to truck carrier partners increasing their fleet size, or large companies with large fleet sizes having joined the SmartWay program.
| Year | Number of Trucks |
|---|---|
| 2013 | 34560 |
| 2014 | 36230 |
| 2015 | 42641 |
| 2016 | 45111 |
2014-2016:SmartWay-registered trucks are getting newer
SmartWay-registered trucks are getting newer
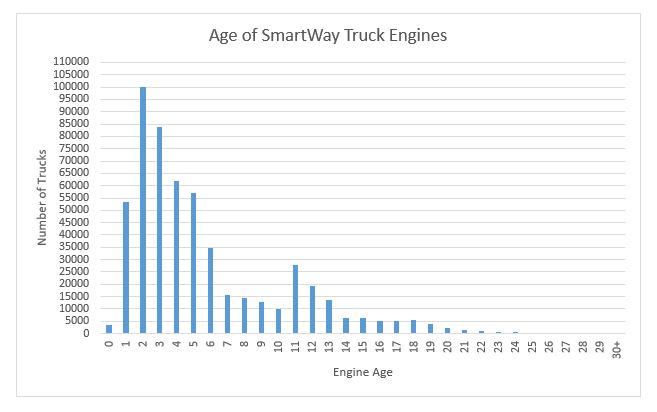
The average age of truck engines in SmartWay is 5.2 years, and 87% of the trucks in SmartWay have an engine age of less than 10 years. Engine age is one of the most important factors contributing to nitrogen oxide (NOx) and particulate matter (PM) emissions, and the use of engine models newer than 2007 can significantly reduce a fleet’s NOx and PM emissions.
| Engine Age | Number of Class 8b trucks |
|---|---|
| 0 | 3321 |
| 1 | 53458 |
| 2 | 100212 |
| 3 | 83679 |
| 4 | 61903 |
| 5 | 56890 |
| 6 | 34817 |
| 7 | 15505 |
| 8 | 14494 |
| 9 | 12776 |
| 10 | 9994 |
| 11 | 28001 |
| 12 | 19166 |
| 13 | 13655 |
| 14 | 6394 |
| 15 | 6378 |
| 16 | 5099 |
| 17 | 5186 |
| 18 | 5590 |
| 19 | 3954 |
| 20 | 2223 |
| 21 | 1258 |
| 22 | 1018 |
| 23 | 769 |
| 24 | 446 |
| 25 | 273 |
| 26 | 155 |
| 27 | 112 |
| 28 | 103 |
| 29 | 93 |
| 30+ | 346 |
2014-2016: CO2 emissions in grams per kilometre have gone down for Canadian SmartWay logistics companies between 2014 and 2016 in all modes of transport
CO2 emissions in grams per kilometre have gone down for Canadian SmartWay logistics companies between 2014 and 2016 in all modes of transport
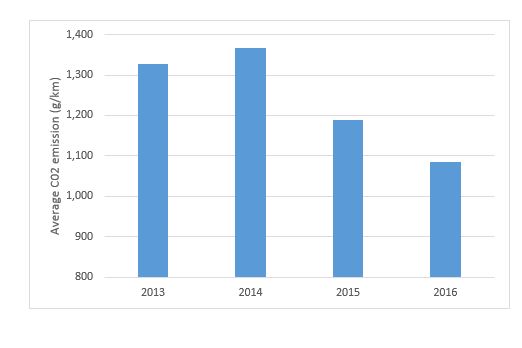
This graph shows the average CO2 emissions in grams per kilometre for all carrier companies hired by Canadian SmartWay logistics providers in all modes of transportation. Since 2013, there is a noticeable downwards trend in the overall CO2 emissions calculated for logistics providers. The 18% decrease in CO2 emissions can be attributed to logistics companies hiring more SmartWay certified carriers. This trend is expected to continue as SmartWay logistics providers become more conscious of fuel use.
| Year | CO2 Emissions (g/km) |
|---|---|
| 2013 | 1327 |
| 2014 | 1366 |
| 2015 | 1189 |
| 2016 | 1085 |
2014-2016: CO2 emissions in grams per kilometre have gone down for Canadian SmartWay logistics companies between 2014 and 2016 in all modes of transport
CO2 emissions in grams per tonne kilometre have gone down for Canadian SmartWay logistics companies between 2014 and 2016 in all modes of transport
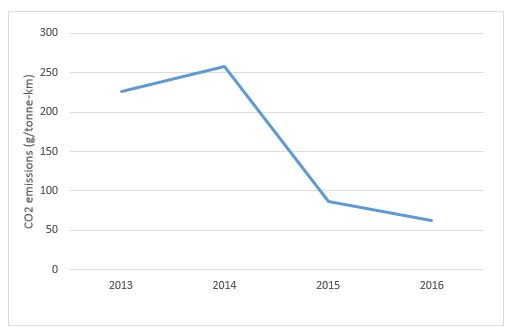
This graph shows the average CO2 emissions in grams per tonne- kilometre for all carrier companies hired by Canadian SmartWay logistics providers in all modes of transportation. Since 2013, there is a noticeable downwards trend in the overall CO2 emissions calculated for logistics providers. This 72% decrease in CO2 emissions can be attributed to logistics companies hiring more SmartWay certified carriers. As shows in Tab 3, CO2 emissions reported by SmartWay logistics companies are decreasing in both grams per kilometre as well as grams per tonne-kilometer. This indicates that carriers hired by SmartWay logistic companies are maximizing the weight in their trailers as well as achieving greater fuel efficiency.
| Year | Average CO2 g/tonne-km |
|---|---|
| 2013 | 226.62 |
| 2014 | 257.37 |
| 2015 | 87.00 |
| 2016 | 62.83 |
2015-2016: Average NOx emissions for all body types show improvement from 2015-2016
Average NOx emissions for all body types show improvement from 2015 to 2016
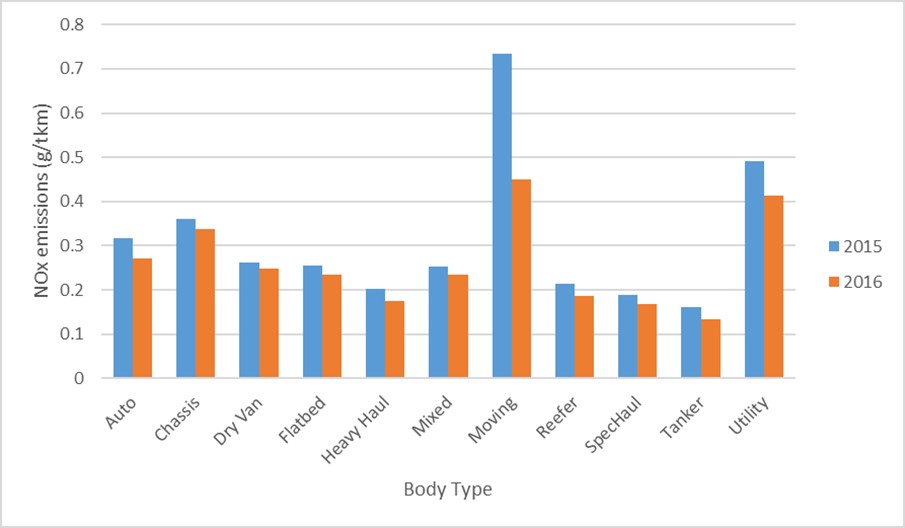
Graph 1 shows the emissions of Nitrogen oxide (NOx) for all body types in grams per tonne- kilometre for SmartWay truck carriers in 2015 and 2016. Nitrogen oxide emissions are largely attributed to road traffic and can lead to the formation of other harmful air pollutants. The amount of NOx emissions released by the trucks have gone down for all truck body types in 2016 compared to 2015. In particular, moving trucks made the biggest improvement of 39%. This demonstrates that SmartWay truck companies have made it a priority to reduce emissions. NOx emissions are expected to continue to decline for all truck body types as the government implements stricter regulations on heavy-duty vehicles and as companies and trucks become more fuel efficient.
| Body Type | Year | |
|---|---|---|
| 2015 | 2016 | |
| Auto | 0.318 | 0.272 |
| Chassis | 0.361 | 0.338 |
| Dry Van | 0.262 | 0.248 |
| Flatbed | 0.254 | 0.235 |
| Heavy haul | 0.203 | 0.175 |
| Mixed | 0.254 | 0.234 |
| Moving | 0.734 | 0.450 |
| Reefer | 0.215 | 0.186 |
| Special Haul | 0.188 | 0.167 |
| Tanker | 0.161 | 0.133 |
| Utility | 0.491 | 0.414 |
2015-2016: Average PM2.5 emissions for all body types show improvement from 2015 to 2016
Average PM2.5 emissions for all body types show improvement from 2015 to 2016
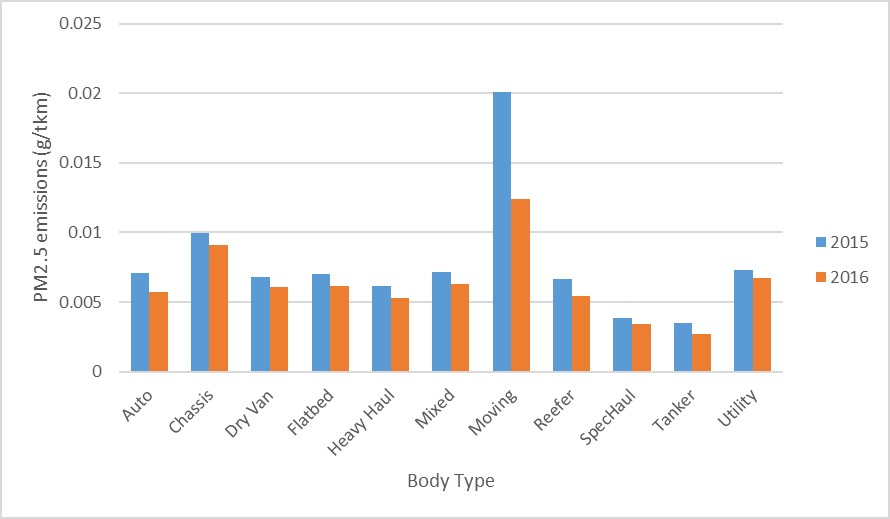
Graph 2 shows the emissions of particulate matter (PM2.5) in grams per tonne-kilometre for all truck body types in the SmartWay program for 2015 and 2016. PM2.5 emissions are fine particles released by the trucks that are 2.5 microns or less in diameter. These particles have been found to pose a significant health risk for humans and it is important that these emissions be reduced. As shown on this graph, emissions of PM2.5 have been reduced for all truck body types in 2016 compared to 2015. In particular, moving trucks made the biggest improvement of 38%. This trend is expected to continue as companies make it a priority to be more fuel efficient.
| Body Type | Year | |
|---|---|---|
| 2015 | 2016 | |
| Auto | 0.0070 | 0.0057 |
| Chassis | 0.0099 | 0.0091 |
| Dry Van | 0.0068 | 0.0060 |
| Flatbed | 0.0070 | 0.0061 |
| Heavy haul | 0.0061 | 0.0053 |
| Mixed | 0.0071 | 0.0063 |
| Moving | 0.0200 | 0.0124 |
| Reefer | 0.0066 | 0.0054 |
| Special Haul | 0.0038 | 0.0034 |
| Tanker | 0.0034 | 0.0027 |
| Utility | 0.0073 | 0.0067 |
2014-2016: Average fuel consumption of SmartWay truck carriers is steadily decreasing while average capacity utilization is increasing from 2014- 2016
Average fuel consumption of SmartWay truck carriers is steadily decreasing while average capacity utilization is increasing from 2014 - 2016
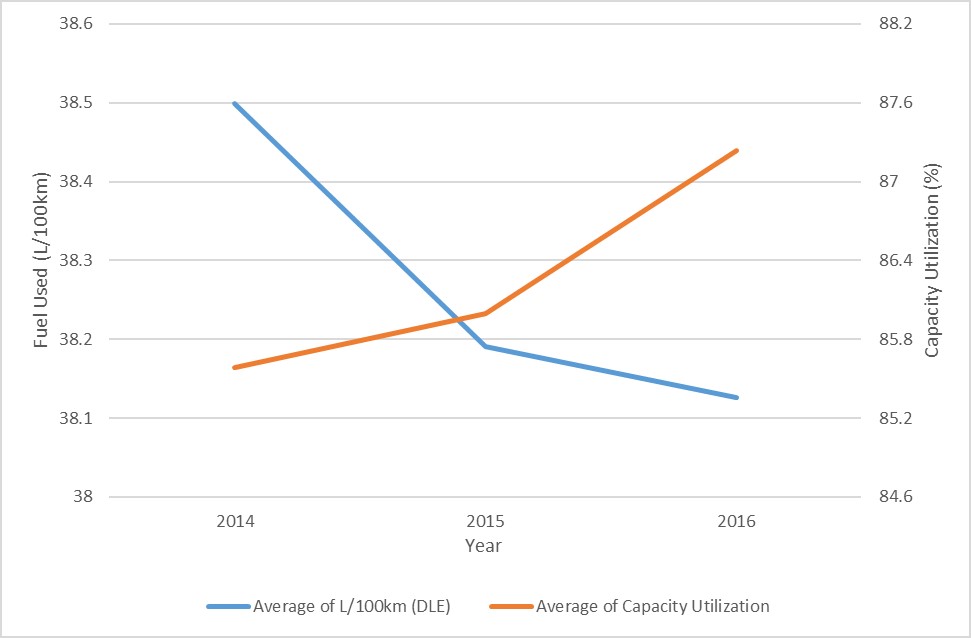
Graph 3 demonstrates the relationship between average fuel consumption in litres per 100 kilometers, and the percentage of capacity utilization for the years 2014 to 2016. As shown, there is a steady decline in average fuel consumption in litres per 100 kilometres. Lower fuel consumption could be an indication of a lighter truckload; however, the trend for capacity utilization shows that SmartWay truck carriers are in fact increasing the capacity of their shipments. Greater capacity utilization is seen positively, as trucks are aiming to maximize freight load per haul. Efficient packaging can maximize capacity utilization. This trend is expected to continue as stricter regulations on heavy duty vehicles (phase II) are imposed and as truck carriers become more fuel conscious.
| Year | Average fuel consumption (L/100km) |
Average Capacity Utilization (%) |
|---|---|---|
| 2014 | 38.50 | 85.59 |
| 2015 | 38.19 | 85.99 |
| 2016 | 38.13 | 87.23 |
2011-2015: Percentage of empty kilometres has been reduced from 2011 to 2015 as capacity utilization increases among SmartWay Truck Partners
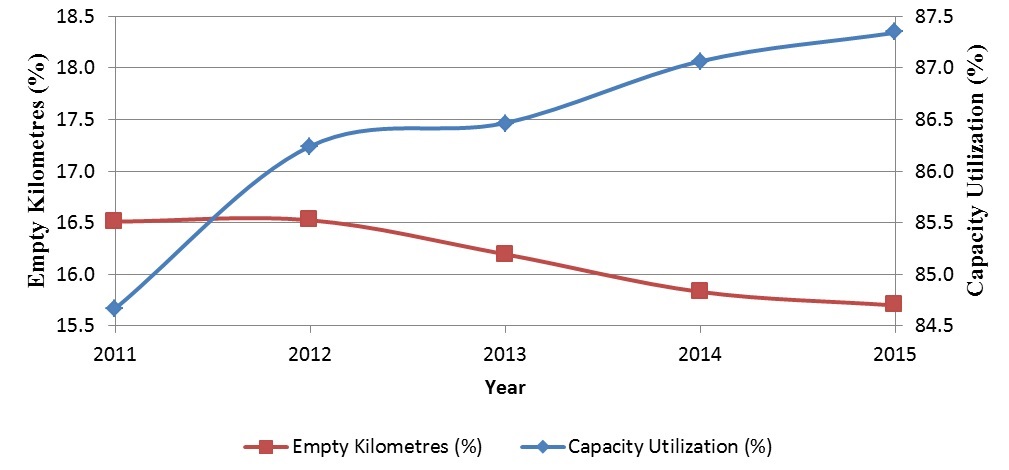
This graph shows the percentage of empty kilometres and capacity utilization for SmartWay Class 8b truck carriers. SmartWay truck carriers have increased their trailer capacity utilization which has led to a decrease in their percentage of empty kilometres. We expect this trend to continue as trucking companies strive to optimize their performance and reduce their time spent with empty trailers.
| Year | Capacity utilization (%) | Empty Kilometres (%) |
|---|---|---|
| 2011 | 84.7 | 16.5 |
| 2012 | 86.2 | 16.5 |
| 2013 | 86.5 | 16.2 |
| 2014 | 87.1 | 15.8 |
| 2015 | 87.3 | 15.7 |
2011-2015: Total fuel use of Class 8b trucks has declined from 2011 to 2015 for SmartWay Truck Partners
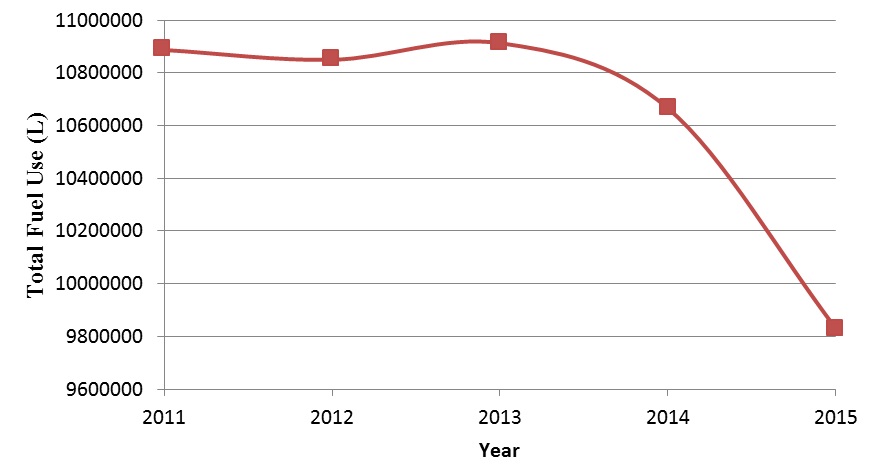
This graph shows the average total fuel consumption in litres for all SmartWay Class 8b truck carriers. SmartWay truck carriers have significantly reduced their fuel consumption over the five years shown in this graph, with a significant decrease in the year 2015. The overall drop in fuel consumption is 9.7% over the five years which amounts to savings of 1,058,031 L of fuel per year. We expect this trend to continue as trucks are getting newer and more fuel efficient.
| Year | Total Fuel Use (L) |
|---|---|
| 2011 | 10,887,553 L |
| 2012 | 10,850,304 L |
| 2013 | 10,913,454 L |
| 2014 | 10,665,725 L |
| 2015 | 9,829,522 L |
2011-2015: Total fuel use of Canadian SmartWay Truck Partners has declined in all provinces from 2011 to 2015 for Class 8b diesel trucks
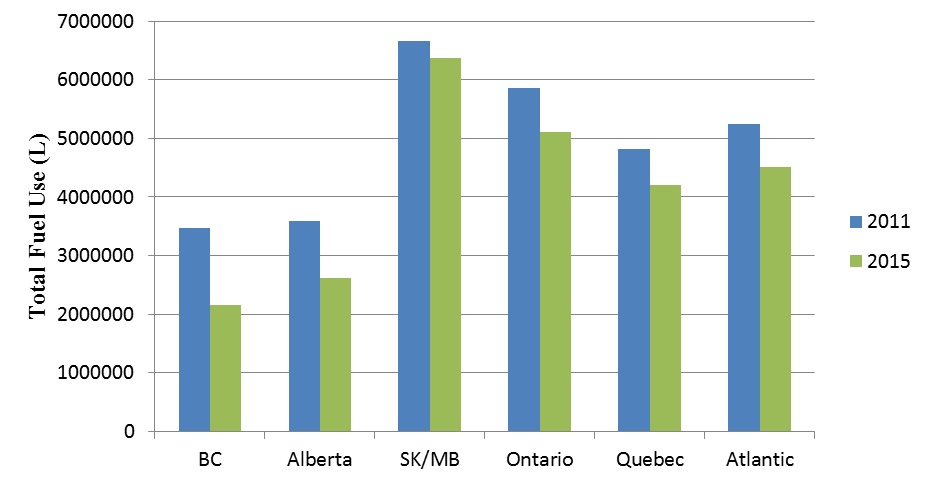
This graph shows the average total fuel consumption in litres for SmartWay Class 8b truck carriers in each Canadian province. The variations for each province can be attributed to geography, climate and operational differences. Given those variations, it is difficult to accurately compare, but trends show that the fuel consumption for SmartWay class 8b truck carriers has been reduced since 2011.
| Province | Total Fuel Use (L) | |
|---|---|---|
| 2011 | 2015 | |
| British Columbia | 3,477,789 L | 2,161,182 L |
| Alberta | 3,583,156 L | 2,616,373 L |
| Saskatchewan/Manitoba | 6,662,193 L | 6,367,258 L |
| Ontario | 5,868,150 L | 5,102,937 L |
| Quebec | 4,818,525 L | 4,198,944 L |
| Atlantic | 8,188,231 L | 7,969,423 L |
2011-2015: Capacity Utilization Percentage in Class 8b diesel trucks has increased from 2011 to 2015 in most provinces for Canadian SmartWay Truck Partners
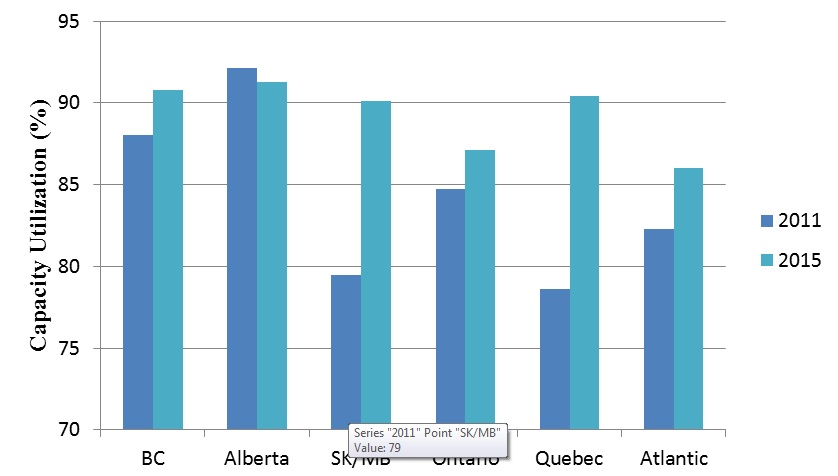
This graph shows the capacity utilization percentage for SmartWay Class 8b diesel trucks in each Canadian province. The capacity utilization percentage has increased for most provinces resulting in increased efficiency. This also coincides with a drop in empty kilometres percentage as shown in graph 1. The only province that has not seen an increase is Alberta which has remained relatively constant and currently stands at an average of 91.3% for 2015 which is the highest capacity utilization percentage of all provinces. The dip of just 0.8% from 2011 is negligible.
| Province | Capacity Utilization (%) | |
|---|---|---|
| 2011 | 2015 | |
| British Columbia | 88.0% | 90.8% |
| Alberta | 92.1% | 91.3% |
| Saskatchewan/Manitoba | 79.4% | 90.1% |
| Ontario | 84.7% | 87.1% |
| Quebec | 78.6% | 90.4% |
| Atlantic | 82.3% | 86.0% |
2008-2015: Carbon dioxide (CO2) and particulate matter (PM2.5) emissions of Canadian class 8b truck carriers decrease in companies’ first five years in SmartWay
.JPG)
This graph shows both the average carbon dioxide (CO2) and particulate matter (PM2.5) emissions in grams/tonne-kilometer (g/tkm) from class 8b truck carriers over the first five years of these companies’ participation in the SmartWay Program. In the graph above, Year 0 is the year a company has joined the program and each subsequent column tracks their progress according to the years passed since they joined. This graph shows that average CO2 and PM2.5 emissions continually decline the longer companies’ are in the program. CO2 emissions were reduced by an average of 12.1% and PM2.5 emissions were reduced by an average of in 59.5% in their first five years. These reductions are a result of fuel savings strategies such as; fuel management plans and training for drivers, aerodynamic truck or trailer technologies, increased capacity utilization (shown in TAB 2) or anti-idling equipment (shown in TAB 3).
| Years in SmartWay | CO2 Emissions (g/tkm) | PM2.5 Emissions (g/tkm) |
|---|---|---|
| Year 0 | 70.97 | 0.0192 |
| Year 1 | 70.94 | 0.0177 |
| Year 2 | 68.38 | 0.0141 |
| Year 3 | 64.60 | 0.0116 |
| Year 4 | 65.95 | 0.0097 |
| Year 5 | 62.33 | 0.0078 |
2011-2015: Total fuel use of Canadian SmartWay Truck Partners has declined in all provinces from 2011 to 2015 for Class 8b diesel trucks
Total fuel use of Canadian SmartWay Truck Partners has declined in all provinces from 2011 to 2015 for Class 8b diesel trucks
This graph shows the average total fuel consumption in litres for SmartWay Class 8b truck carriers in each Canadian province. The variations for each province can be attributed to geography, climate and operational differences. Given those variations, it is difficult to accurately compare, but trends show that the fuel consumption for SmartWay class 8b truck carriers has been reduced since 2011.
| Province | Total Fuel Use (L) | |
|---|---|---|
| 2011 | 2015 | |
| British Columbia | 3,477,789 L | 2,161,182 L |
| Alberta | 3,583,156 L | 2,616,373 L |
| Saskatchewan/Manitoba | 6,662,193 L | 6,367,258 L |
| Ontario | 5,868,150 L | 5,102,937 L |
| Quebec | 4,818,525 L | 4,198,944 L |
| Atlantic | 8,188,231 L | 7,969,423 L |
2008-2015: Continuous average capacity utilization improvement of class 8b truck carriers during companies’ first five years in SmartWay
.JPG)
This graph shows the progression of average capacity utilization of Canadian class 8B trucks during their first five years in the SmartWay program. Capacity utilization refers to the percentage of volume or weight capacity of a trailer reached by the current payload. The average capacity utilization grew from 82.4% (when the companies joined SmartWay) to 86.4% during their fifth year in the program. Improving capacity utilization allows transportation of the same amount (in volume or in weight) of goods with fewer trips, therefore reducing emissions and fuel costs. This demonstrates how companies have constantly improved their average capacity utilization strategies during their first years with SmartWay.
| Years in SmartWay | Capacity Utilization (%) |
|---|---|
| Year 0 | 82.4% |
| Year 1 | 82.8% |
| Year 2 | 84.4% |
| Year 3 | 85.2% |
| Year 4 | 86.3% |
| Year 5 | 86.4% |
2008-2015: Average idle hours of class 8b truck carriers fluctuates annually during companies’ first five years in SmartWay
.jpg)
This graph shows the average idle hours of class 8b truck carriers during their first five years in the SmartWay program. Since most class 8b trucks are long haul operations, average idle hours are significant and contribute to amount of fuel consumption and thus emissions. There has been a general but small reduction of average idle hours of these truck carriers throughout the first five years since they joined SmartWay. Most notably, within companies’ first year with SmartWay, average idle hours were reduced by 7.3%, suggesting that idling reduction technologies and behaviours may be one of the first improvements made to SmartWay truck carriers.
| Years in SmartWay | Average Idle Hours |
|---|---|
| Year 0 | 765.3 |
| Year 1 | 709.5 |
| Year 2 | 692.3 |
| Year 3 | 708.5 |
| Year 4 | 731.1 |
| Year 5 | 714.4 |
Fleet size increases for SmartWay truck carriers during companies’ first five years with the program
.JPG)
This graph shows the total number of class 8b trucks by trailer body type who have been in the SmartWay program for at least 5 years. Total fleet size increased for companies throughout the first five years in the SmartWay program indicating company expansion. In total, there was a 39% growth rate of total number of trucks over this time.
| Years in SmartWay | Dry van | Reefer | Flatbed | Tanker | Chassis | Total |
|---|---|---|---|---|---|---|
| Year 0 | 6541 | 2449 | 960 | 158 | 570 | 10678 |
| Year 1 | 5910 | 2802 | 1931 | 222 | 2148 | 13013 |
| Year 2 | 7142 | 3768 | 1273 | 233 | 1027 | 13443 |
| Year 3 | 7056 | 3303 | 1121 | 171 | 986 | 12637 |
| Year 4 | 7075 | 3033 | 1538 | 225 | 936 | 12807 |
| Year 5 | 8550 | 3170 | 1421 | 471 | 1266 | 14878 |
2008-2015: Average number of trucks by body type increases over first five years for SmartWay partners
.JPG)
This graph shows the average number of Canadian class 8b trucks per company by their different trailer types. Every trailer body type observed a positive overall growth trend over the first five years since joining SmartWay. Tankers, which represent the smallest portion of 8b trucks, proportionately grew the largest with an average 146% overall increase, while Chassis grew by 84%. This may be from diversification of trailer types within companies after joining SmartWay, or specialized fleets growing faster than the more common dry van fleets. Dry vans, which represent about 55% of all class 8b trucks, on average grew by 8% over the first 5 years.
| Truck Type | Year 0 | Year 5 |
|---|---|---|
| Dry van | 49.2 | 53.1 |
| Reefer | 18.4 | 19.7 |
| Flatbed | 7.2 | 8.8 |
| Tanker | 1.2 | 2.9 |
| Chassis | 4.3 | 7.9 |
2014: The Amount of Long Haul Activity Varies by Fuel Type (All Truck Classes, 2014)
This graph shows Canadian SmartWay partners’ percentages of activity by region that is short haul versus long haul. Across Canada there is a higher percentage of long haul truck activity. Graph 1 helps explain this; since Class 8b trucks represent more than 90% of the Canadian trucks in SmartWay, it is expected that most of the operations across the country would also be long haul. Saskatchewan and Manitoba have the highest percentage of long haul truck activity, 24% more in comparison to BC, who has the smallest percentage. BC’s relatively low rate of long haul activity may be explained by its higher percentage of drayage operations, which as shown in Graph 3, has a larger percentage of short haul activity.
| Region | Short Haul (%) | Long Haul (%) |
|---|---|---|
| BC | 44.6 | 55.4 |
| Alberta | 33.2 | 66.8 |
| Sask/Man | 20.5 | 79.5 |
| Ontario | 35.1 | 64.9 |
| Quebec | 30.5 | 69.5 |
| Atlantic Canada | 33.9 | 66.1 |
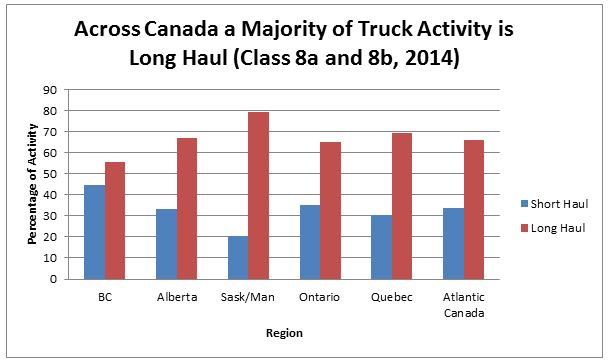
2014: Across Canada a Majority of Truck Activity is Long Haul (Class 8a and 8b, 2014)
Across Canada a Majority of Truck Activity is Long Haul (Class 8a and 8b, 2014)
This graph shows Canadian SmartWay partners’ percentages of activity by region that is short haul versus long haul. Across Canada there is a higher percentage of long haul truck activity. Graph 1 helps explain this; since Class 8b trucks represent more than 90% of the Canadian trucks in SmartWay, it is expected that most of the operations across the country would also be long haul. Saskatchewan and Manitoba have the highest percentage of long haul truck activity, 24% more in comparison to BC, who has the smallest percentage. BC’s relatively low rate of long haul activity may be explained by its higher percentage of drayage operations, which as shown in Graph 3, has a larger percentage of short haul activity.
| Region | Short Haul (%) | Long Haul (%) |
|---|---|---|
| BC | 44.6 | 55.4 |
| Alberta | 33.2 | 66.8 |
| Sask/Man | 20.5 | 79.5 |
| Ontario | 35.1 | 64.9 |
| Quebec | 30.5 | 69.5 |
| Atlantic Canada | 33.9 | 66.1 |
2014: Truck Activity Varies by Operation Type (All Classes, 2014)
Truck Activity Varies by Operation Type (All Classes, 2014)
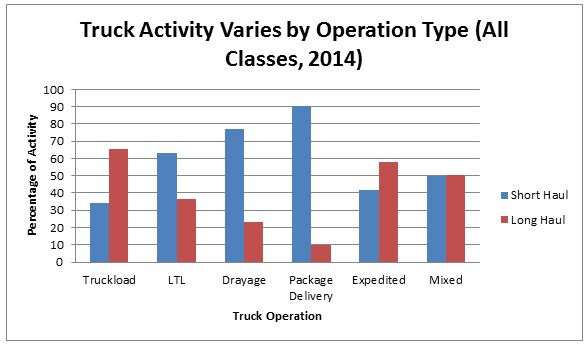
This graph shows SmartWay partners’ percentages of activity by operation that is short haul versus long haul. There is no clear majority amongst the different truck operation categories; Expedited and Truckload operations have a higher percentage of long haul activity while LTL, Drayage, and Package Delivery have a higher percentage of short haul activity. Package Delivery operations have the smallest percentage of long haul activity while Truckload has the smallest percentage of short haul activity. The distributions for these operations are as expected since LTL, Drayage, and Package Delivery operations generally cover shorter distances, while Truckload and Expedited are more geared towards farther destinations, making them long haul operations.
| Truck Operation | Short Haul (%) | Long Haul (%) |
|---|---|---|
| Truckload | 34.3 | 65.7 |
| LTL | 63.4 | 36.6 |
| Drayage | 77.0 | 23 |
| Package Delivery | 90.2 | 9.8 |
| Expedited | 41.9 | 58.1 |
| Mixed | 49.8 | 50.2 |
2014: Long Haul Activity is the Majority of Activity in Both Canada and the US (Class 8b Trucks, 2014)
Long Haul Activity is the Majority of Activity in Both Canada and the US (Class 8b Trucks, 2014)
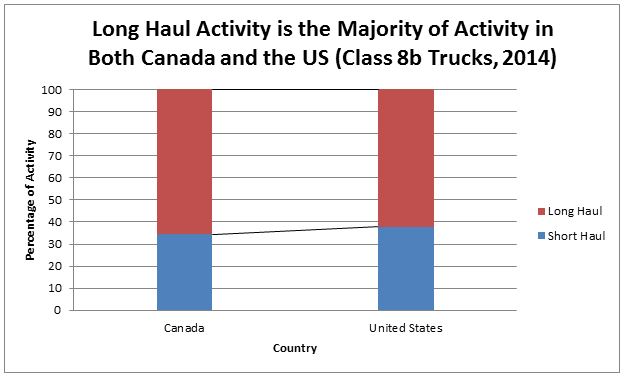
This graph shows Canadian and American SmartWay partners’ percentages of Class 8b activity by country that is short haul versus long haul. There is a slight increase in the percentage of long haul activity in the United States compared to Canada. However, in both countries, long haul activities make up the majority of class 8b truck activity. Again, this is expected as Graph 1 shows that Class 8b truck activity is primarily long haul.
| Country | Short Haul (%) | Long Haul (%) |
|---|---|---|
| Canada | 34.5 | 65.5 |
| United States | 37.9 | 62.1 |
2014: The Amount of Long Haul Activity Varies by Fuel Type (All Truck Classes, 2014)
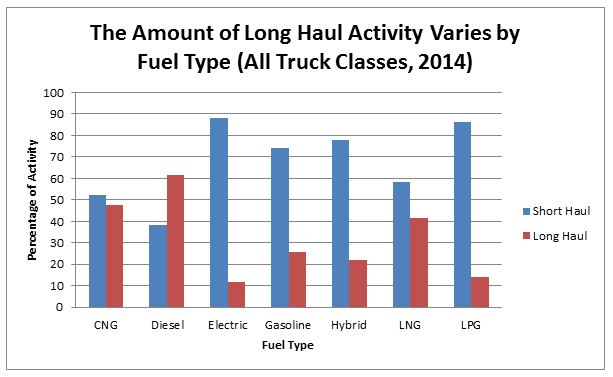
This graph shows SmartWay partners’ percentages of activity by fuel type that is short haul versus long haul. Diesel is the only fuel type in which long haul makes up the majority of truck activity. With other fuel types, short haul operations make up the largest percentage of truck activity. Notably, electric vehicles have the smallest amount of long haul activity, which can be explained, in part, by the lack of infrastructure (i.e. charging stations) available on long haul routes. The same rationale can also explain the smaller percentages of long haul activity found in LPG (propane) and natural gas vehicles. The majority of class 8b trucks use diesel, which is more likely to be used for long haul routes. Larger vehicles, such as class 8b trucks, require larger engine sizes which require higher torque to be produced at lower speeds, making diesel the optimal fuel choice. This illustrates why diesel has a higher long haul percentage than other fuel types.
| Fuel Type | Short Haul (%) | Long Haul (%) |
|---|---|---|
| CNG | 52.3 | 47.7 |
| Diesel | 38.5 | 61.5 |
| Electric | 88.2 | 11.8 |
| Gasoline | 74.2 | 25.8 |
| Hybrid | 77.8 | 22.3 |
| LNG | 58.3 | 41.7 |
| LPG | 86 | 14 |
2014: Regional Differences in Fuel Economy for Canadian SmartWay Truck Partners (Class 8b diesel trucks, 2014)
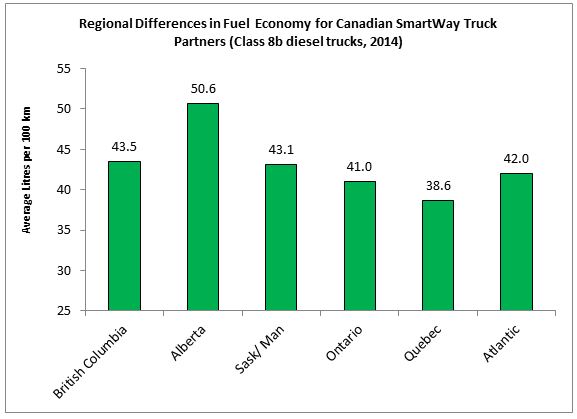
This graph shows average Class 8b diesel fuel economy (litres per 100 km) for SmartWay truck partners across six Canadian regions in 2014. Ontario and Quebec had the lowest relative rate of fuel use by this measure, while the three western regions had the highest rates. While this graph shows differences in fuel use across regions, it does not account for other differences relevant to fuel use such as geography, climate, payload, and operational differences such as fleet and truck type.
| Province | Average L/100km (Actual) |
|---|---|
| British Columbia | 43.5 |
| Alberta | 50.6 |
| Sask/ Man | 43.1 |
| Ontario | 41.0 |
| Quebec | 38.6 |
| Atlantic | 42.0 |
2014: Regional Differences in Average Payload Occur for Canadian SmartWay Truck Partners (Class 8b Diesel Trucks, 2014)
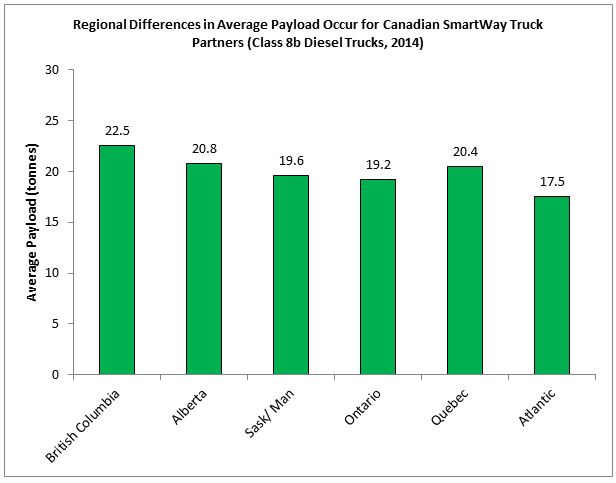
This graph shows the average payload in tonnes for SmartWay Class 8b truck carriers across six Canadian regions in 2014. SmartWay partners from all regions had an average payload between 17.5 and 22.5 tonnes, with those from Alberta, British Columbia, and Quebec having had the highest average payload. Western regions tended to have higher average payloads, but differences across regions are moderate. Regional climate, transportation networks, and operational diffrerences such as fleet type and use of long-combination vehicles can impact the average payload in a given region, and may partially explain the differences shown.
| Province | Average Payload (Metric Tonnes) |
|---|---|
| British Columbia | 22.5 |
| Alberta | 20.8 |
| Sask/ Man | 19.6 |
| Ontario | 19.2 |
| Quebec | 20.4 |
| Atlantic | 17.5 |
2014: Relative Fuel Economy Performance Differs When Accounting for Average Payload (2014, Class 8b diesel trucks)
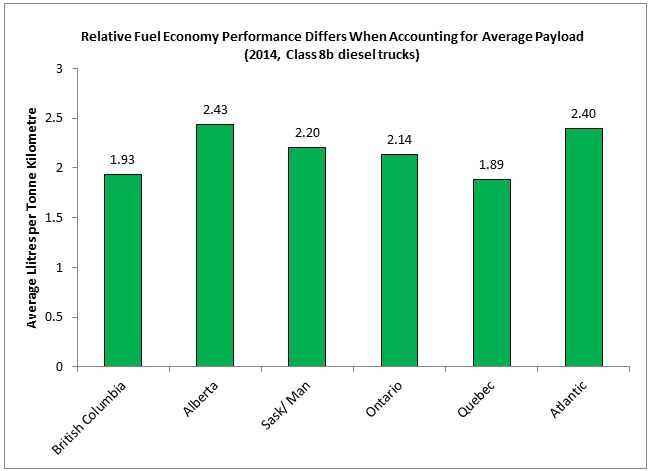
This graph shows the average payload-weighted fuel economy for SmartWay carriers across six Canadian regions in 2014. A tonne-kilometre is the movement of one tonne of freight over a distance of one kilometre. Litres per tonne-kilometre captures the effect of both distance travelled and average payload on fuel consumption. Regional comparisons in fuel economy by this measure are different from what is shown in Graph 1. This can be explained in part by Graph 2, where average payload is shown to differ across regions. For example, Alberta’s fuel economy differed signficantly from that in the Atlantic region in terms of litres per 100 km, but the two regions had a near equal rate of fuel consumption when accounting for payload. This means that as average payload differs across regions, it is important to consider this factor when comparing average regional fuel economy and other performane measures. Differences in geography, climate, transportation networks, and operation type can also have an impact on both average payload and either measure of fuel economy.
| Province | Litres per tonne km |
|---|---|
| British Columbia | 1.93 |
| Alberta | 2.43 |
| Sask/ Man | 2.20 |
| Ontario | 2.14 |
| Quebec | 1.89 |
2014: Average Proportion of Empty Kilometers Varies Across Canadian Regions (Class 8b Diesel Trucks, 2014)
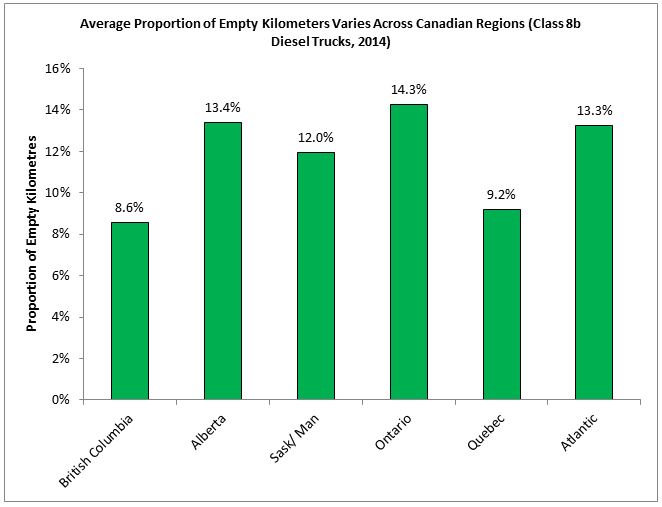
This graph shows the average proportion of empty kilometres to total kilometres for SmartWay truck carriers across six Canadian regions in 2014. Quebec and British Columbia are shown to have had the lowest proportion of empty kilometres. This means that truck partners from these regions do relatively well at limiting trips with empty trailers. However, this graph does not capture operational differences across regions that might lead to this outcome. Some operation types such as tanker fleets are required to operate with a higher proportion of empty kilometres (See archived SmartWay Trends and Statistics: “The Percentage of Empty Kilometres Varies Between Truck Body Types.”
| Province | Proportion of Empty Kilometres |
|---|---|
| British Columbia | 8.6% |
| Alberta | 13.4% |
| Sask/ Man | 12.0% |
| Ontario | 14.3% |
| Quebec | 9.2% |
| Atlantic | 13.3% |
2014: Average Cube Out Percentage Varies Across Regions in Canada (Class 8b Diesel Trucks, 2014)
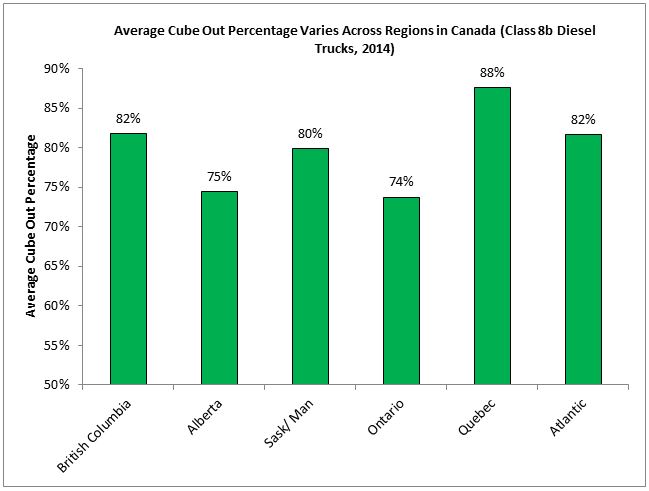
This graph shows the average cube out percentage for SmartWay Class 8b truck carriers across six Canadian regions in 2014. Cube out percentage refers to the proportion of truck loads which reach the volume capacity of a trailer. SmartWay partners from Quebec had the highest average cube out percentage in 2014, while Ontario and Alberta had the lowest. This relates to Graph 4, showing that those regions with a low average proportion of empty kilometres often had a high average cube out percentage. For example, SmartWay partners from Quebec had a relatively low proportion of empty kilometres, and a relatively high average cube out percentage. While this does not hold for all regions, it suggests that measures for trucking efficiency may be relate to each other in some cases.
| Province | Average Cube Out Percentage |
|---|---|
| British Columbia | 82% |
| Alberta | 75% |
| Sask/ Man | 80% |
| Ontario | 74% |
| Quebec | 88% |
| Atlantic | 82% |
2011-2014: SmartWay Class 8b truck carriers are using their trailer space more efficiently
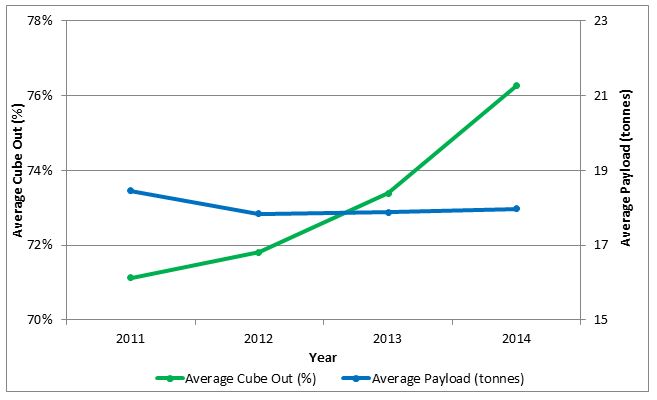
This graph shows the average cube out percentage and the average payload of SmartWay Class 8b truck carrier trailers. Cube out refers to reaching the volume capacity of a trailer. SmartWay Class 8b truck carriers are increasing the average volume of shipments in their trailers while the payload remains relatively unchanged. This means that SmartWay truck carriers are improving their trailer capacity utilization per shipment.
| Year | Average Cube Out (%) | Average Payload (tonnes) |
|---|---|---|
| 2011 | 71.1 | 18.4 |
| 2012 | 71.8 | 17.8 |
| 2013 | 73.4 | 17.9 |
| 2014 | 76.3 | 18.0 |
2011-2014: As the capacity utilization of Class 8b truck trailers increases, empty kilometres declines
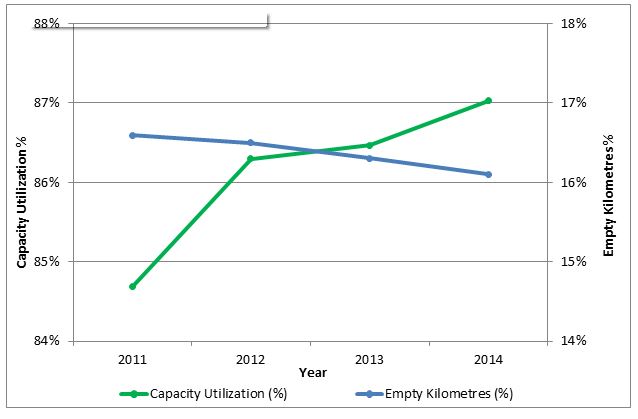
This graph shows the capacity utilization percentage and the percentage of empty kilometres of SmartWay Class 8b truck carriers. SmartWay truck carriers are increasing the capacity utilization of their trailers. An increasing average cube out can help to explain this, as shown in TAB 1. This increase in capacity utilization is also correlated with a decrease in the percentage of empty kilometres.
| Year | Capacity Utilization (%) | Empty Kilometres (%) |
|---|---|---|
| 2011 | 84.7% | 16.6% |
| 2012 | 86.3% | 16.5% |
| 2013 | 86.5% | 16.3% |
| 2014 | 87.0% | 16.1% |
2011-2014: As the capacity utilization of Class 8b truck trailers increases, empty kilometres declines
2011-2014: Canadian SmartWay truck fleets are decreasing their total kilometres while American SmartWay truck fleets are increasing their total kilometres
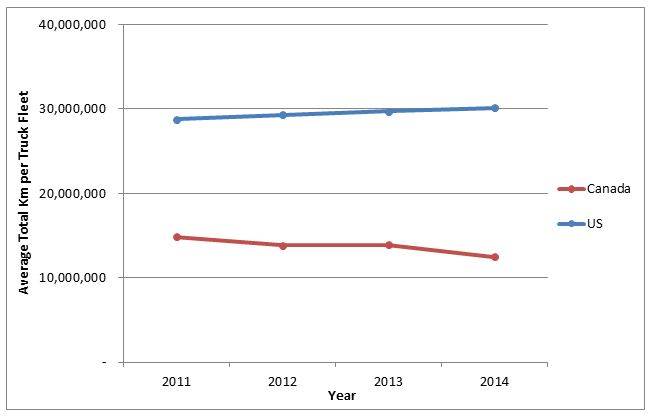
This graph shows the average total kilometres for Canadian SmartWay truck fleets and American SmartWay truck fleets. American SmartWay truck fleets are, on average, much larger than Canadian SmartWay truck fleets, which explains why their total kilometres are higher than Canadian fleets. Total kilometres for Canadian truck fleets are decreasing while total kilometres for American truck fleets are increasing. We would expect this trend to increase as smaller fleets continue to join the SmartWay program in Canada.
| Year | Average Total Km per Truck Fleet in Canada | Average Total Km per Truck Fleet in the US |
|---|---|---|
| 2011 | 14,836,707 | 28,730,725 |
| 2012 | 13,821,602 | 29,265,288 |
| 2013 | 13,924,330 | 29,700,861 |
| 2014 | 12,491,391 | 30,115,541 |
2011-2014: The average total kilometres per Class 8b truck for Canadian SmartWay trucks is declining at a faster rate than American SmartWay trucks
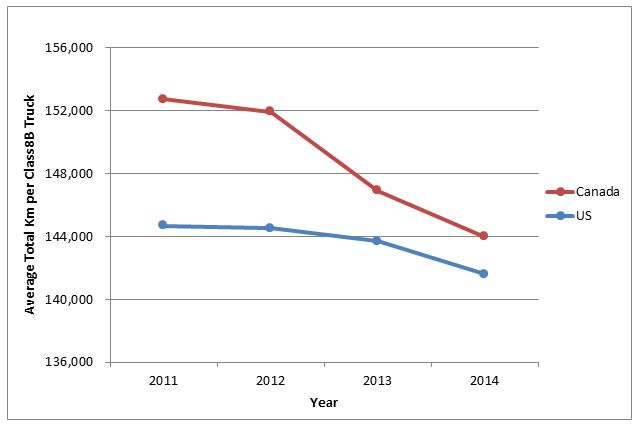
This graph shows the average total kilometres per Class 8b truck for Canadian and American SmartWay truck fleets. Average total kilometres per Class 8b truck for Canadian and American SmartWay truck carriers are declining. The average total kilometres per Class 8b truck for Canadian SmartWay trucks is declining at a faster rate than American SmartWay trucks, however the average total kilometres per Class 8b trucks were higher in Canada to begin with. The average total kilometres per Class 8b trucks for Canadian SmartWay truck fleets is starting to converge with American SmartWay truck fleets. A possible explanation for this is SmartWay truck carriers are increasing their trailer utilization per truck, as shown in TAB 1, and reducing the number of delivery trips.
| Year | Average Total Km per Class 8b Truck in Canada | Average Total Km per Class 8b Truck in the US |
|---|---|---|
| 2011 | 152,726 | 144,680 |
| 2012 | 151,936 | 144,512 |
| 2013 | 146,908 | 143,687 |
| 2014 | 143,994 | 141,607 |
2011-2014: American SmartWay truck carriers replace a greater percentage of their Class 8b trucks each year than Canadian SmartWay truck carriers
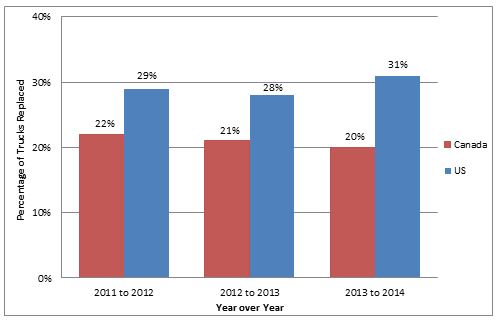
This graph shows the percentage of Class 8b trucks replaced by Canadian versus American SmartWay truck carriers year over year. American SmartWay truck carriers are replacing their Class 8b trucks at a higher rate than Canadian SmartWay truck carriers. The reasons for this are unclear and merit further research.
| Year over Year | Trucks Replaced in Canada (%) | Trucks Replaced in the US (%) |
|---|---|---|
| 2011-2012 | 22% | 29% |
| 2012-2013 | 21% | 28% |
| 2013-2014 | 20% | 31% |
2013: SmartWay shipper companies have lower emissions than SmartWay logistics companies
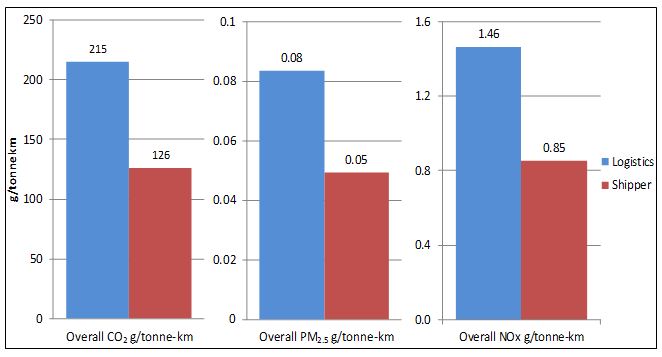
These three graphs show a comparison between the overall transportation emissions produced by SmartWay shipper companies versus SmartWay logistics companies in 2013 (data for 2014 is not yet available). They show that shipper companies emitted less carbon dioxide (CO2), particulate matter (PM2.5), and nitrogen oxides (NOx) than logistics companies.
Long description:
| Emission (g/tonne-km) | Logistics (2013 results) | Shipper (2013 results) |
|---|---|---|
| Overall CO2 g/tonne-km | 215 | 125 |
| Overall PM2.5 g/tonne-km | 0.08 | 0.05 |
| Overall NOx g/tonne-km | 1.46 | 0.85 |
2013: Truck fleets hired by SmartWay shippers have lower emissions than truck fleets hired by SmartWay logistics companies
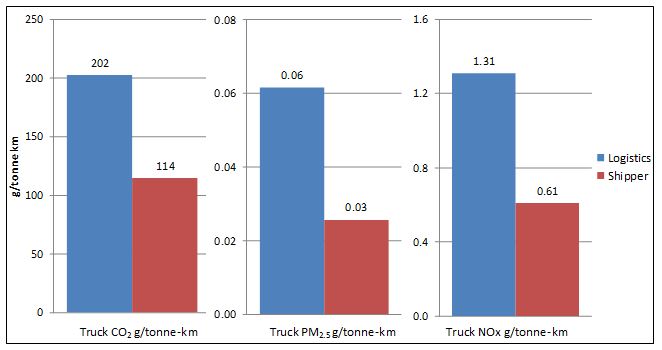
These three graphs show a comparison between the emissions of truck fleets hired by SmartWay shipper companies versus SmartWay logistics companies in 2013 (data for 2014 is not yet available). Truck fleets hired by SmartWay shippers emitted less carbon dioxide (CO2), particulate matter (PM2.5), and nitrogen oxides (NOx), on average, compared to fleets hired by SmartWay logistics companies. The ratio of truck emissions from shippers to that of logistics companies is generally consistent with their overall emissions for 2013, as shown in TAB 1. SmartWay shipper partners hire a greater percentage of SmartWay truck carriers than logistics partners. SmartWay truck carriers are lower emitting and more fuel efficient than non-SmartWay carriers, which helps explain why shipper companies have lower emissions than logistics companies overall (TAB 1).
To learn more about how to reduce your company’s fuel use, contact us:
Telephone: 1-855-322-1564
Email: smartway.canada@nrcan-rncan.gc.ca
Long description:
| Emission (g/tonne-km) | Logistics (2013 results) | Shipper (2013 results) |
|---|---|---|
| Truck CO2 g/tonne-km | 202 | 114 |
| Truck PM2.5 g/tonne-km | 0.06 | 0.03 |
| Truck NOx g/tonne-km | 1.31 | 0.61 |
2011-2013: SmartWay shippers are increasing their use of SmartWay multi-modal carriers
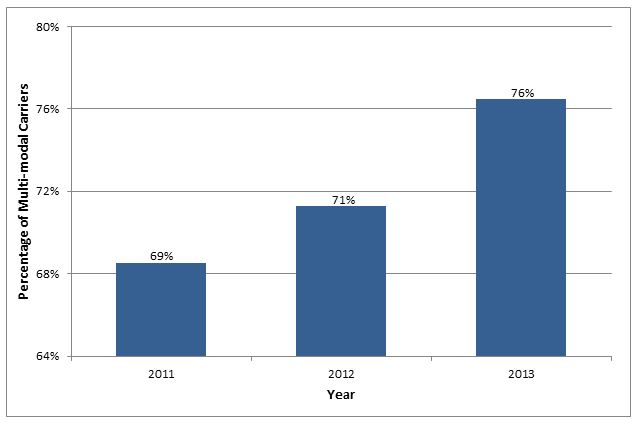
This graph shows SmartWay shippers’ percent use of SmartWay vs non-SmartWay multi-modal carriers for each reporting year. Multi-modal refers to the transportation of goods under a single carrier that is performed with at least two different modes of transportation. Since 2011, shippers have increased their use of SmartWay multi-modal carriers.
Long description:
| Year | Percentage of Multi-modal Carriers |
|---|---|
| 2011 | 69% |
| 2012 | 71% |
| 2013 | 76% |
2011-2013: SmartWay shipper partners are reducing their multi-modal CO2 emissions

This graph shows the multi-modal transport CO2 g/tonne-km emissions rate for shippers emitted in each reporting year available. Referring to TAB 3, there is a correlation between SmartWay shippers increasing their use of SmartWay multi-modal carriers and decreasing their multi-modal CO2 g/tonne-km. On average, SmartWay multi-modal carriers are cleaner and more fuel efficient than non-SmartWay multi-modal carriers.
To learn more about how to reduce your company’s fuel use, contact us:
Telephone: 1-855-322-1564
Email: smartway.canada@nrcan-rncan.gc.ca
Long description:
| Year | Multi-modal CO2 g/tonne-km |
| 2011 | 42.7 |
| 2012 | 36.1 |
| 2013 | 35.1 |
2011-2014: Canadian SmartWay logistics partners have higher average truck CO2 emissions rates than American partners
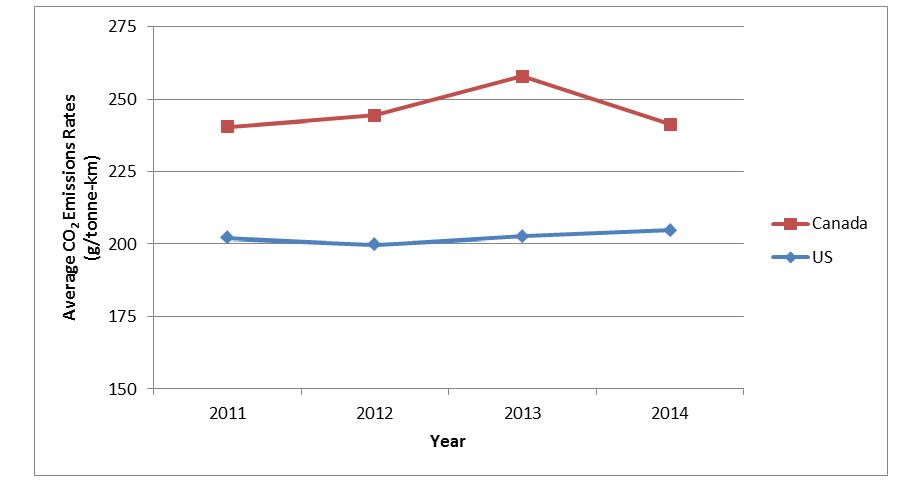
This graph shows the average CO2 emissions rates in grams per tonne-kilometre from truck carriers hired by Canadian and American SmartWay logistics partners. A tonne-kilometre is a unit representing the movement of one tonne of freight over a distance of one kilometer. On average, Canadian logistics partners have higher CO2 emissions rates than American partners. For more details, please refer to the graph under Tab 2.
Long description:
| Year | Average CO2 Emissions Rates (g/tonne-km) |
|
|---|---|---|
| US | Canada | |
| 2011 | 202 | 240 |
| 2012 | 200 | 245 |
| 2013 | 203 | 258 |
| 2014 | 205 | 241 |
2011-2014: American logistics companies are reducing their truck-related CO2 emissions rates by preferentially hiring SmartWay truck carriers over non-SmartWay truck carriers
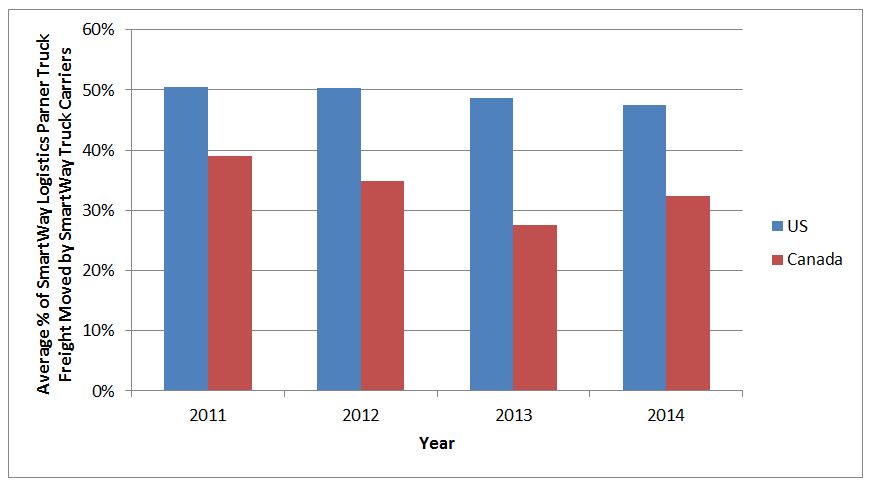
Average CO2 emissions rates, shown under Tab 1, are directly related to the average percentage of truck freight (in tonne-kilometres) moved by SmartWay truck carriers, since SmartWay truck carriers generally have lower emissions rates than non-SmartWay carriers. As indicated above, American logistics partners tend to move more freight with SmartWay truck carriers compared to Canadian logistics partners. Consequently, Canadian logistics partners have higher CO2 emissions rates. Canadian logistics partners can improve their truck operations CO2 emissions performance by shipping more with SmartWay truck carriers and/or recruiting their non-SmartWay truck carriers into the program.
For more information on how SmartWay can help you work with your company’s carriers to improve your performance, please contact us.
Telephone: 1-855-322-1564
Email: nrcan.smartway.rncan@canada.ca
Long description:
| Year | Average % of SmartWay Logistics Partner Truck Freight Moved by SmartWay Truck Carriers |
|
|---|---|---|
| US | Canada | |
| 2011 | 50% | 39% |
| 2012 | 50% | 35% |
| 2013 | 49% | 28% |
| 2014 | 48% | 32% |
2013: Canadian SmartWay logistics partners tend to work with more fuel-efficient truck carriers (those ranked in Bin 1 and Bin 2, which have the best CO2 emissions rates in grams per tonne-kilometre)
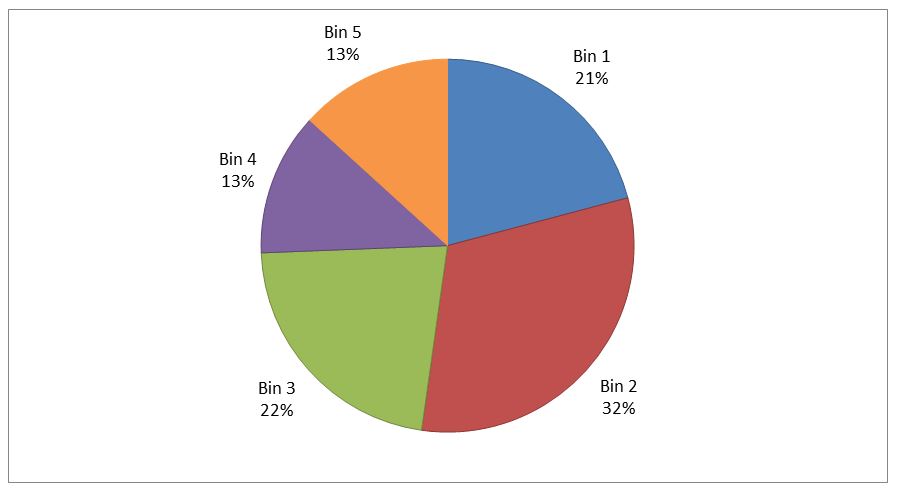
This graph shows the distribution of freight moved on behalf of Canadian SmartWay logistics partners by SmartWay truck carriers, according to the truck carriers’ CO2 emissions rates in grams per tonne-kilometre (g/tonne-km). SmartWay truck carriers are placed in one of five performance bins based on their emissions rates. Each bin represents 20% of the SmartWay truck carriers and Bin 1 represents the best performance. In 2013, over half of all the freight moved by Canadian logistics partners with SmartWay truck carriers was moved with carriers from the top 2 bins. This suggests that Canadian SmartWay logistics partners tend to work with more fuel-efficient truck carriers. Fuel efficiency and CO2 emissions are directly related.
Long description:
| Emissions Performance Category |
% Freight Moved by SmartWay Truck Carriers |
|---|---|
| Bin 1 | 21.1% |
| Bin 2 | 31.7% |
| Bin 3 | 22.4% |
| Bin 4 | 12.5% |
| Bin 5 | 13.4% |
2013: Logistics companies can reduce their emissions by switching modes of freight transportation
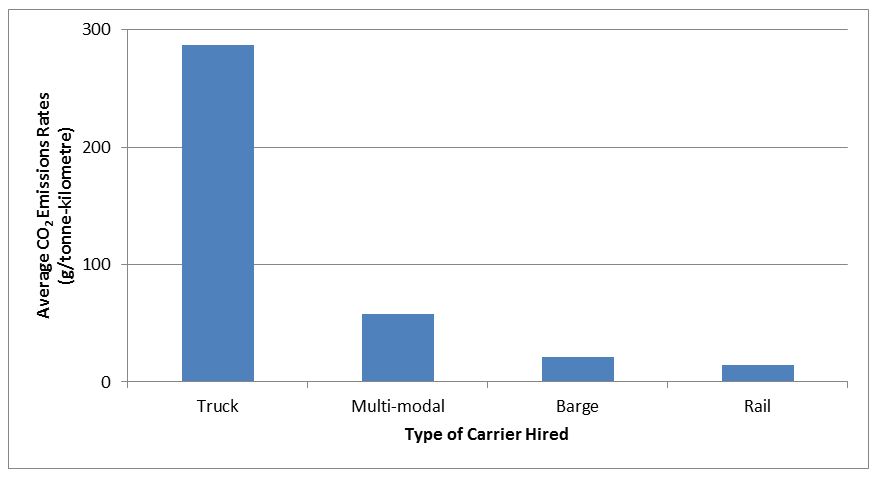
This graph shows average CO2 emissions rates per type of carrier hired by SmartWay logistics partners in 2013. The five types of carriers hired by logistics companies are Truck, Rail, Barge, and Multi-modal. Multi-modal companies include any combination of rail, barge, and truck carriers. Truck is the highest CO2 emitting mode of freight transportation. Switching modes, when possible, from truck to a carrier mode with lower emissions such as rail or barge is one way logistics companies can reduce their emissions.;
Please contact us for more information on how your logistics company can benefit from the SmartWay program.
Telephone: 1-855-322-1564
Email: nrcan.smartway.rncan@canada.ca
Long description:
| Type of Carrier Hired | Average CO2 Emissions Rates (g/tonne-km) |
|---|---|
| Rail | 14 |
| Barge | 21 |
| Multi-modal | 58 |
| Truck | 287 |
2010-2013: The number of logistics companies registered with SmartWay has increased every year
.png)
This graph shows the number of US and Canadian logistics companies registered in the SmartWay Transport Partnership for each of the past four years. Since 2010, the number of logistics partners has been increasing steadily. A logistics company is a company managing, brokering or forwarding freight for shipper clients. SmartWay helps logistics companies to benchmark operations, track fuel consumption and improve environmental performance annually. Please contact us for more information to register your logistics company with SmartWay.
Telephone: 1-855-322-1564
Email: smartway.canada@nrcan-rncan.gc.ca
| Year | Number of Companies |
|---|---|
| 2010 | 450 |
| 2011 | 501 |
| 2012 | 508 |
| 2013 | 522 |
2013: Majority of SmartWay partners hired by logistics companies are truck carriers
.png)
This graph shows the percentage of trucks hired for each truck body type. The most frequent hired truck body type is Truck Load/Dry Van with 43.4%. The second and third most frequent hired truck body type are Mixed and Refrigerated trucks with 28.2% and 15.0% respectively. The ‘other’ category includes Package, Specialized, Tanker and Truck/Rail truck body types. This order is consistent with the number of fleets of each category registered in SmartWay, with TL/Dry Van, Mixed, and Refrigerated being the three most common truck body types.
| Truck Body Type | Percentage Hired |
|---|---|
| TL/Dry Van | 43.4% |
| Mixed | 28.2% |
| Refrigerated | 15.0% |
| LTL/Dry Van | 5.0% |
| Flatbed | 4.4% |
| Dray | 2.2% |
| Other | 1.9% |
2013: Trucks and logistics carriers moved the highest percentage of total tonne kilometres for SmartWay logistics companies
.png)
This graph shows the percentage of total tonne kilometres moved by carrier mode. Trucks and logistics carriers moved the highest percentage of total tonne kilometres, and together represent 64% of the total tonne kilometres. Multi-model carriers rank second with 25%. Although rail and barge companies represent less than 1% of registered SmartWay carriers (see tab 2), the percentage of total tonne kilometres is much higher: 8% and 4% respectively. This corresponds with the higher average payload that can be moved by rail or barges. Additionally, the energy use of rail and barges is much lower than the energy use of trucks.
| Carrier Mode | Percentage Total Tonne KM |
|---|---|
| Truck | 32% |
| Logistics | 32% |
| Multi-modal | 25% |
| Rail | 8% |
| Barge | 4% |
As seen in this graph, the average ages of engines were relatively lower in Canada than in the US in both 2012 and 2013. Newer engines are associated with lower nitrogen oxides (NOx) and particulate matter (PM2.5) emissions (see graph 4).
2013: SmartWay logistics companies hire SmartWay truck load/dry van body types most frequently
.png)
This graph shows the percentage of trucks hired for each truck body type. The most frequent hired truck body type is Truck Load/Dry Van with 43.4%. The second and third most frequent hired truck body type are Mixed and Refrigerated trucks with 28.2% and 15.0% respectively. The ‘other’ category includes Package, Specialized, Tanker and Truck/Rail truck body types. This order is consistent with the number of fleets of each category registered in SmartWay, with TL/Dry Van, Mixed, and Refrigerated being the three most common truck body types.
| Truck Body Type | Percentage Hired |
|---|---|
| TL/Dry Van | 43.4% |
| Mixed | 28.2% |
| Refrigerated | 15.0% |
| LTL/Dry Van | 5.0% |
| Flatbed | 4.4% |
| Dray | 2.2% |
| Other | 1.9% |
2009-2013: Average Payload in Canada and the US for Class 8B Trucks Converge in 2013

This graph shows the average payload per truck in Canada and the US for five consecutive years from 2009 to 2013. In Canada, the line graph plateaus and then declines in the more recent years. In the US, the line plateaus and then slightly increases in the last few years. In 2013, both Canada and the US reached a similar level of average payload, where the line graphs converge.
| Average Payload per Truck | US | CAN |
|---|---|---|
| 2009 | 15.9 | 18.5 |
| 2010 | 17.4 | 19.2 |
| 2011 | 17.4 | 19.2 |
| 2012 | 17.0 | 18.9 |
| 2013 | 17.3 | 17.2 |
2009-2013: Rate of Carbon dioxide (CO2) Emissions in Canada and the US Fluctuate Over Time for Class 8B Trucks
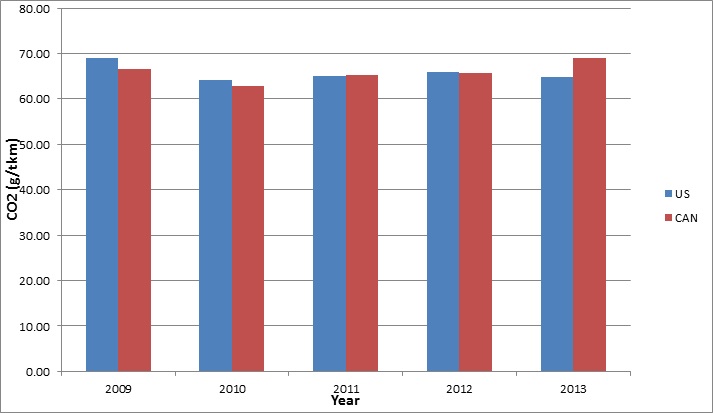
This graph shows the rates of carbon dioxide CO2 (g/tkm) for five consecutive years. CO2 emissions are directly related to fuel consumption. Changes in fuel consumption per tonne-km are correlated with changes in average payload. Therefore, the increase in CO2 emissions in Canada in 2013 reflects the lower average payload seen for the same period (graph 1).
Companies can improve their trucks’ performance by implementing more fuel efficient activities. To learn more about fuel efficient activities, contact us:
Telephone: 1-855-322-1564
Email: smartway.canada@nrcan-rncan.gc.ca
| Year | US | CAN |
|---|---|---|
| 2009 | 69.07 | 66.61 |
| 2010 | 64.10 | 62.94 |
| 2011 | 64.95 | 65.26 |
| 2012 | 65.85 | 65.76 |
| 2013 | 64.93 | 68.94 |
2012-2013: Newer Engine Ages in Canada for Class 8B Trucks
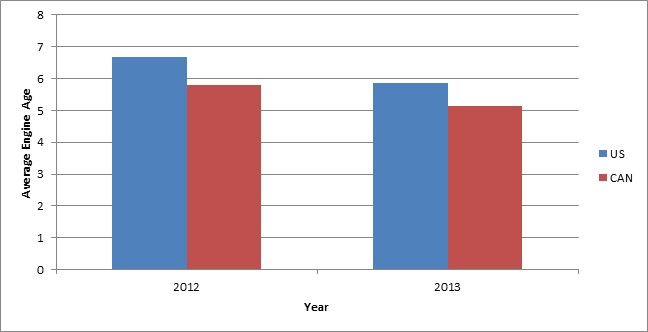
| Country | Average Engine Age in 2012 | Average Engine Age in 2013 |
|---|---|---|
| US | 6.67 | 5.87 |
| CAN | 5.81 | 5.14 |
As seen in this graph, the average ages of engines were relatively lower in Canada than in the US in both 2012 and 2013. Newer engines are associated with lower nitrogen oxides (NOx) and particulate matter (PM2.5) emissions (see graph 4).
2013: Influx of New Vehicles in Canada in 2013 Led to Lower Rates of Nitrogen Oxide (NOx) and Particulate Matter (PM2.5) Emissions
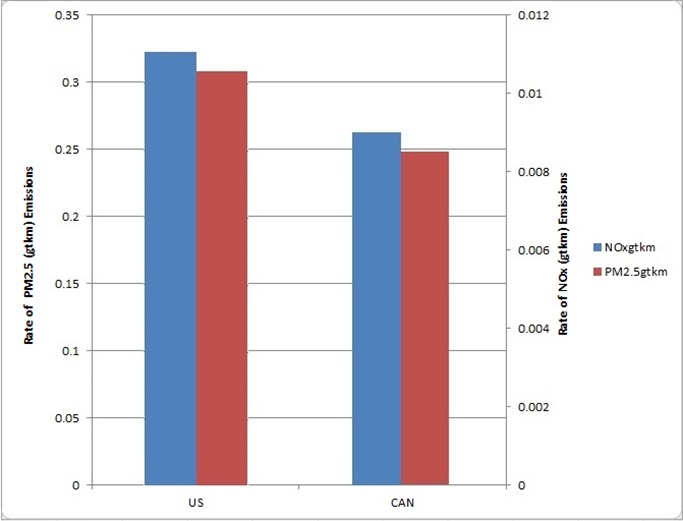
This graph shows the 2013 rates of PM2.5 (g/tkm) and NOx (g/tkm) emissions in the US and Canada for class 8B trucks. Two distinct vertical axes are used to represent the levels of PM2.5 and NOx emissions, allowing for better comparison. The blue bar graph represents the amount of NOx emissions, and can be read off of the vertical axis on the right side. The red bar graph represents the amount of PM2.5 emissions and can be read off of the vertical axis on the left side.
Overall, Canada had relatively lower PM2.5 and NOx emissions in 2013, which suggests that a lower average engine age, as was the case for Canadian trucks is related to lower rates of emissions (Graph 3).
| Emissions (g/tkm) | US | CAN |
|---|---|---|
| NOx | 0.323418 | 0.264967 |
| PM2.5 | 0.010674 | 0.008521 |
2009-2013: SmartWay Truck Carriers are Reducing Their Empty Kilometres
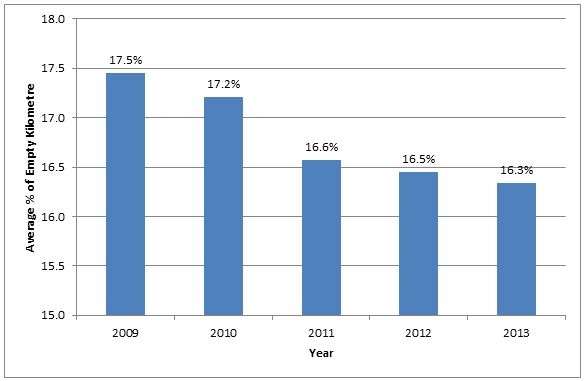
This graph shows the average percentage of empty kilometres out of total kilometres driven for the past five years for SmartWay truck carrier partners. Empty kilometres are kilometres driven without payload. Since 2009, the average percentage of empty kilometres has been declining steadily. This suggests an increasing number of SmartWay partners are improving their route planning and capacity utilization, which reduces energy use while helping their bottom line.
Telephone: 1-855-322-1564
Email: smartway.canada@nrcan-rncan.gc.ca
| Year | Average % of Empty Kilometres |
|---|---|
| 2009 | 17.5% |
| 2010 | 17.2% |
| 2011 | 16.6% |
| 2012 | 16.5% |
| 2013 | 16.3% |
2013: The Percentage of Empty Kilometres Varies between Truck Body Types
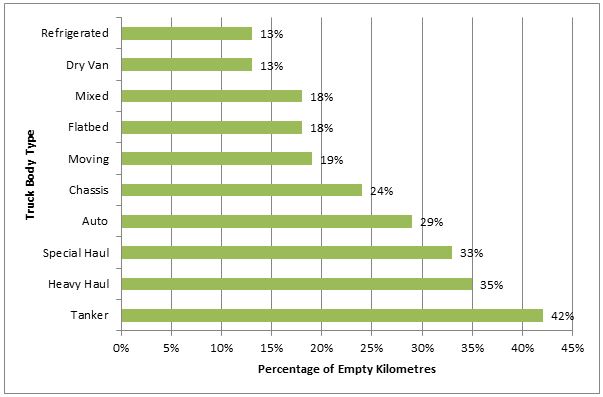
This graph shows the average percentage of empty kilometres for each truck body type. Empty kilometres are kilometres driven without payload. Refrigerated trucks and dry van trucks travel less than 15% of their total kilometres while empty, while body types like heavy haul and tanker travel over 30% of their total kilometres while empty. The higher percentages for these body types reflect the more specialized nature of their operations that makes finding back haul loads more difficult. The order of the distribution of the body types by percentage of empty kilometres is similar to the distribution of body types based on their average payload.
| Truck Body Type | Percentage of Empty Kilometres |
|---|---|
| Refrigerated | 13% |
| Dry Van | 13% |
| Mixed | 18% |
| Flatbed | 18% |
| Moving | 19% |
| Chassis | 24% |
| Auto | 29% |
| Special Haul | 33% |
| Heavy Haul | 35% |
| Tanker | 42% |
2010-2013: Private Fleets have a Higher Percentage of Empty Kilometres
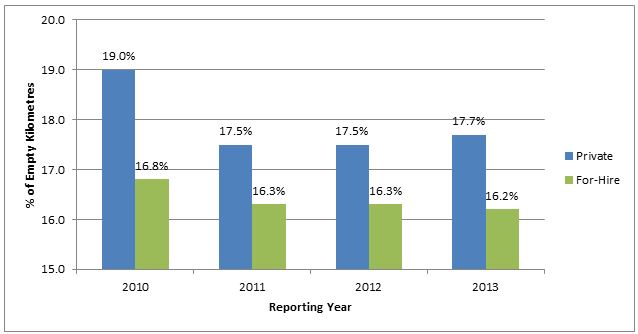
This graph shows the difference between for-hire fleets and private fleets in their average percentage of empty kilometres. Empty kilometres are kilometres driven without payload. For-hire fleets had a lower percentage of empty kilometres than private fleets in each year between 2010 and 2013. One potential reason for this is that private fleets usually move freight for just one company, making it more difficult to find freight for back-haul trips.
| Reporting Year | Percentage of Empty Kilometres for Private Fleets |
Percentage of Empty Kilometres for For-Hire Fleets |
|---|---|---|
| 2010 | 19.0% | 16.8% |
| 2011 | 17.5% | 16.3% |
| 2012 | 17.5% | 16.3% |
| 2013 | 17.7% | 16.2% |
2013: Medium-sized Fleets have the Lowest Percentage of Empty Kilometres
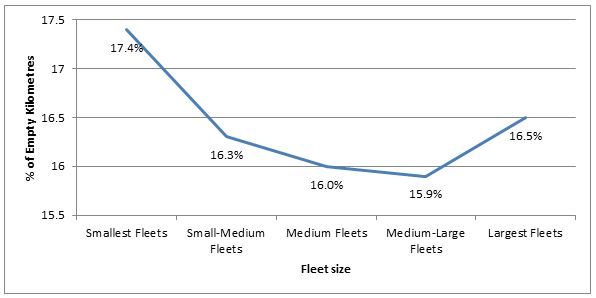
This graph shows the total percentage of empty kilometres travelled for fleets of different sizes. Empty kilometres are kilometres driven without payload. When fleets are divided into five groups of equal size based on the number of trucks in each fleet, it can be seen that the medium-sized fleets have the lowest rate of empty kilometres while the smallest and largest fleets have the highest rate of empty kilometres. This suggests there may be operational challenges facing larger and smaller truck fleets that make reducing their empty kilometres more difficult compared to medium size fleets.
| Fleet size | % of Empty Kilometres |
|---|---|
| Smallest Fleets | 17.4% |
| Small-Medium Fleets | 16.3% |
| Medium Fleets | 16.0% |
| Medium-Large Fleets | 15.9% |
| Largest Fleets | 16.5% |
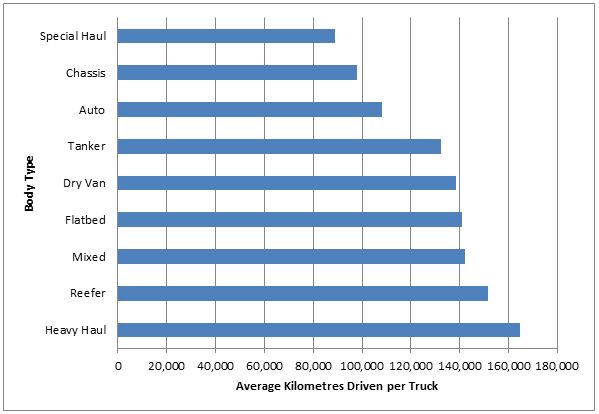
2013: Average Distance Travelled per Truck Varies Between Vehicle Body Types
This graph shows the number of kilometres driven by each type of truck. The truck types are shown in the order of least to greatest number of kilometres travelled per truck. Heavy haul trucks travel the most kilometres per truck, while special haul travel the fewest kilometres per truck.
| Body Type | Average Kilometres Driven per Truck |
|---|---|
| Special Haul | 88,767 |
| Chassis | 97,852 |
| Auto | 108,025 |
| Tanker | 132,387 |
| Dry Van | 138,665 |
| Flatbed | 140,754 |
| Mixed | 141,974 |
| Reefer | 151,558 |
| Heavy Haul | 164,752 |
2013: Average Payload per Truck Body Type
This graph shows the average payload performance for each truck type. Heavy haul trucks are shown to have the highest average payload out of all vehicle body types. A higher average payload is related to a higher average fuel consumption.
| Body Type | Average Kilometres Driven per Truck |
|---|---|
| Dry Van | 14.7 |
| Reefer | 16.1 |
| Auto | 18.7 |
| Mixed | 19.4 |
| Chassis | 19.5 |
| Flatbed | 21.1 |
| Tanker | 24.7 |
| Special Haul | 30.0 |
| Heavy Haul | 35.3 |
2013: Average Payload Affects Fuel Consumption
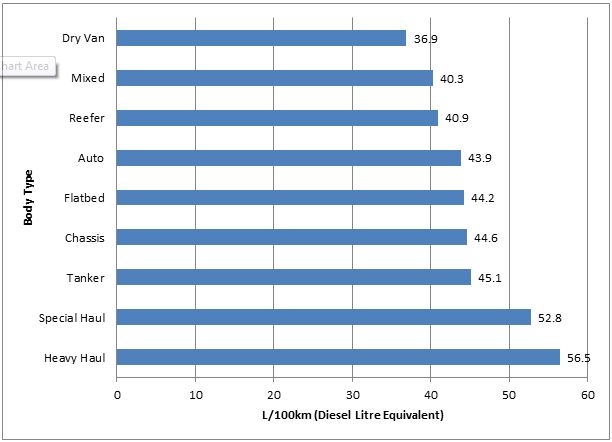
This graph shows the fuel consumption (L/100km) for each truck type. The average payload affects the average fuel consumption for vehicles of all body types. In fact, there is a positive relationship between the two factors: the higher the average payload, the higher the fuel consumption.
This relationship can be seen by comparing this graph to the graph in Tab 2. The order of the trucks listed on the two graphs is very similar.
Natural Resources Canada offers free resources, information, and training that can help trucks of all operations reduce their fuel consumption.
To learn more about the effect of idling on fuel consumption, contact us:
Telephone: 1-855-322-1564
Email: smartway.canada@nrcan-rncan.gc.ca
| Body Type | L/100km (Diesel Litre Equivalent) |
|---|---|
| Dry Van | 36.9 |
| Mixed | 40.3 |
| Reefer | 40.9 |
| Auto | 43.9 |
| Flatbed | 44.2 |
| Chassis | 44.6 |
| Tanker | 45.1 |
| Special Haul | 52.8 |
| Heavy Haul | 56.5 |
2013: Selecting the Correct Fuel Consumption Metric is Important
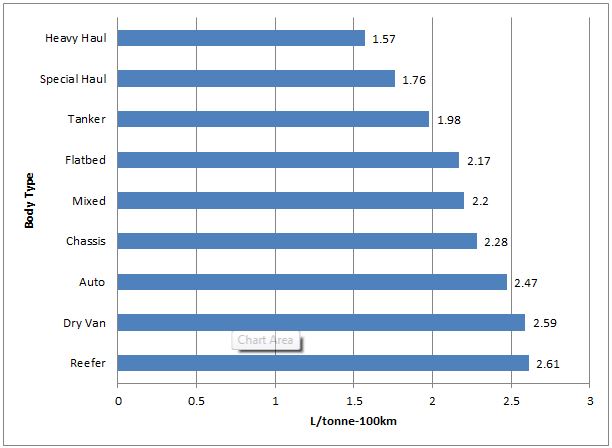
This graph shows the fuel consumption (L/tonne-100km) for each truck type. A tonne-kilometre is the movement of one tonne of freight one kilometre. This change in metric causes the order in which the trucks were listed on the graph in Tab 3, to be flipped in this graph.
The body types with the highest fuel consumption per tonne/100-kilometre, for example, dry van and reefer, tend to have lower average payloads (Tab 2), and better L/100km fuel consumption (Tab 3). This explains why dry van and reefer are listed at the top of the graph in Tab 3. It is important for companies such as SmartWay shipper and logistics partners that hire transportation services to consider which fuel consumption metric is best for them when tracking their carriers’ performance.
| Body Type | L/tonne-100km |
|---|---|
| Heavy Haul | 1.57 |
| Special Haul | 1.76 |
| Tanker | 1.98 |
| Flatbed | 2.17 |
| Mixed | 2.2 |
| Chassis | 2.28 |
| Auto | 2.47 |
| Dry Van | 2.59 |
| Reefer | 2.61 |
2009-2013: For-hire SmartWay truck carriers consume fuel at a lower rate than private/dedicated SmartWay truck carrier fleets
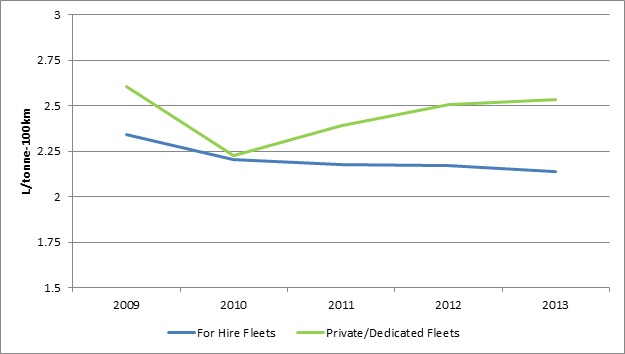
For-hire SmartWay truck carriers, which account for 81% of trucks registered in SmartWay, consume fuel at a lower rate than private and dedicated carriers (companies whose activity is contracted with a specific shipper). Natural Resources Canada offers free resources, information, and training that can help truck carriers reduce their fuel consumption.
To learn more on fuel consumption reporting, contact us:
Telephone: 1-855-322-1564
Email: smartway.canada@nrcan-rncan.gc.ca
| Year | L/t100km -For-Hire | L/t100km - Private |
|---|---|---|
| 2009 | 2.34 | 2.61 |
| 2010 | 2.20 | 2.23 |
| 2011 | 2.18 | 2.39 |
| 2012 | 2.17 | 2.50 |
| 2013 | 2.14 | 2.54 |
2008-2013: Class 8b trucks are idling less
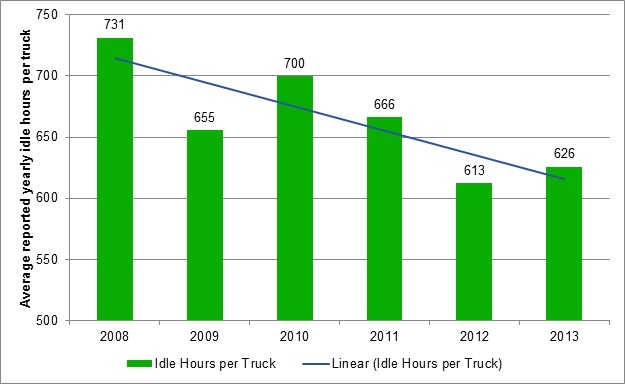
The amount of idling per Class 8b truck has been trending down by about three percent each year over the six years of available program data. Less idling means lower fuel use, lower emissions, and lower fuel costs for the trucking sector.
To learn more about the effect of idling on fuel consumption, contact us:
Telephone: 1-855-322-1564
Email: smartway.canada@nrcan-rncan.gc.ca
| Year | Average Reported Idle Hours per Truck | Trend in Average Reported Idle Hours per Truck |
|---|---|---|
| 2008 | 731 | 714 |
| 2009 | 655 | 695 |
| 2010 | 700 | 675 |
| 2011 | 666 | 655 |
| 2012 | 613 | 636 |
| 2013 | 626 | 616 |
2004-2014: SmartWay-registered trucks are getting newer
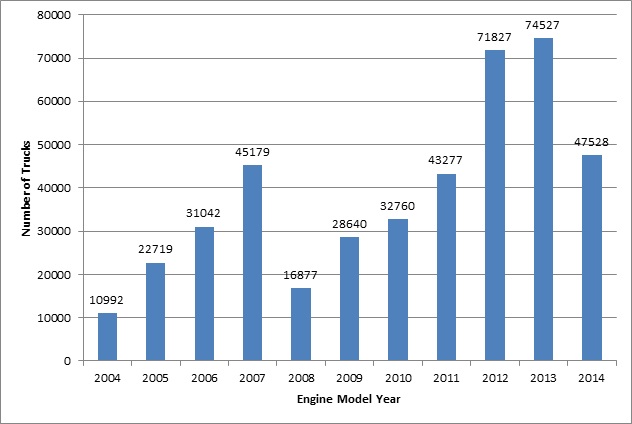
The average age of truck engines in SmartWay is 5.31 years, and 81% of the trucks in SmartWay have an engine model year of 2004 or newer. Engine age is one of the most important factors contributing to nitrogen oxide (NOx) and particulate matter (PM) emissions, and the use of 2007 or newer engine models can significantly reduce a fleet’s NOx and PM emissions.
To learn more about the emissions benefits of newer engines contact us:
Telephone: 1-855-322-1564
Email: smartway.canada@nrcan-rncan.gc.ca
| Engine Model Year | Number of Trucks |
|---|---|
| 2004 | 10992 |
| 2005 | 22719 |
| 2006 | 31042 |
| 2007 | 45179 |
| 2008 | 16877 |
| 2009 | 28640 |
| 2010 | 32760 |
| 2011 | 43277 |
| 2012 | 71827 |
| 2013 | 74527 |
| 2014 | 47528 |
| Total | 482857 |
2010-2012: Shippers are increasing their usage of SmartWay certified Carriers
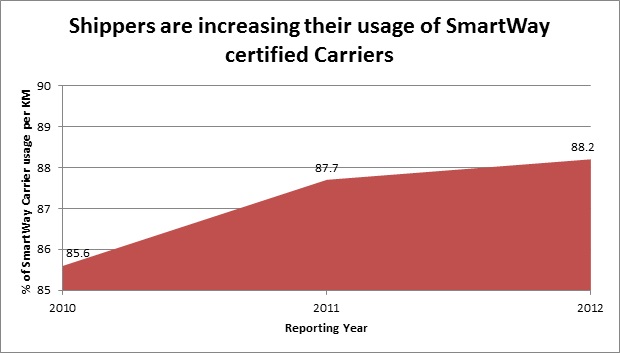
SmartWay shippers are increasingly asking for carriers to be SmartWay certified. In 2012, SmartWay Shippers carried out 88.2% of their activity with SmartWay carriers, a 3% increase from 2010.
While filling out the Shipper Tool, Shipper companies report on their SmartWay-registered carriers as well as their non-SmartWay carriers. As a result, SmartWay shippers are noticing how much they are saving by using SmartWay carriers. Shippers can check out the SmartWay’s Partner List to find companies which are committed to reducing their fuel consumption.
To learn more about SmartWay or to join the partnership, contact us:
Telephone: 1-855-322-1564
Email: smartway.canada@nrcan-rncan.gc.ca
| Reporting Year | % of SmartWay Carrier usage per KM |
|---|---|
| 2010 | 85.6 |
| 2011 | 87.7 |
| 2012 | 88.2 |
2011-2012: SmartWay helps companies lower their emissions
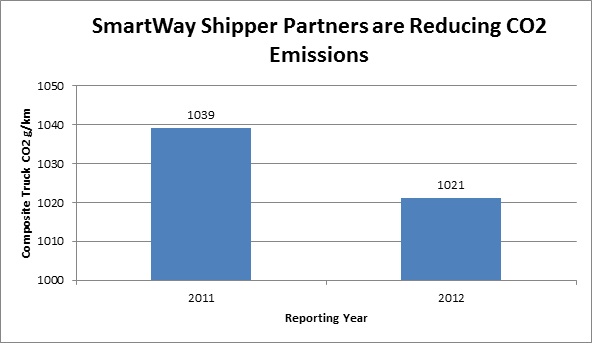
SmartWay Shipper Partners are reducing their CO2 emissions using the SmartWay Transport Partnership. In the last year, SmartWay Shippers reduced their emissions by 2% with strategies such as using SmartWay participation and environmental performance as criteria for selecting carriers. Not only did SmartWay Shippers reduce their emissions, but by using less fuel they also helped reduce the transportation costs of moving their goods.
To learn more about SmartWay or to join the partnership, contact us:
Telephone: 1-855-322-1564
Email: smartway.canada@nrcan-rncan.gc.ca
| Reporting Year | Composite Truck CO2 g/km |
|---|---|
| 2011 | 1039 |
| 2012 | 1021 |
2011-2012: SmartWay Shipper Partners PM2.5 Emissions Reduction over Time
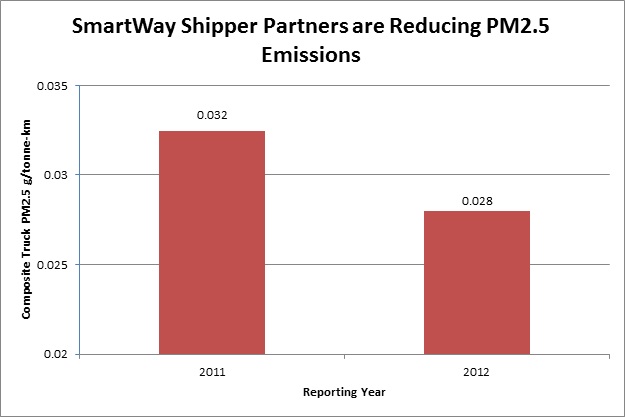
SmartWay Shipper Partners reduced the particulate matter (PM) emissions from their transportation activities by 12.5% last year with the help of the SmartWay Transport Partnership. Strategies such as hiring lower emitting carriers helped these companies reduce their harmful PM emissions to this extent.
To learn more on how to save on fuel with the help of SmartWay, contact us:
Telephone: 1-855-322-1564
Email: smartway.canada@nrcan-rncan.gc.ca
| Reporting Year | Composite Truck PM2.5 g/tonne-km |
|---|---|
| 2011 | 0.032 |
| 2012 | 0.028 |
2012: Business Focus of Logistics Partners
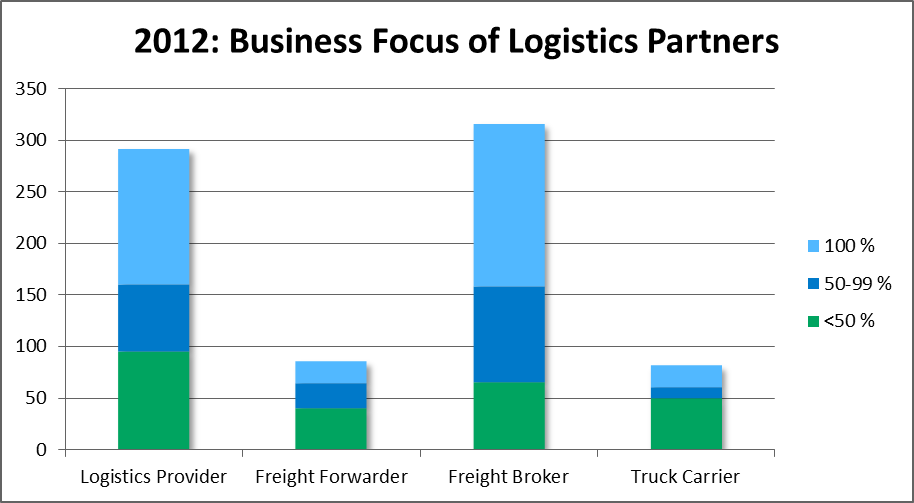
In 2012, Canadian and American SmartWay Logistic companies specialized in four supply chain functions, as third party logistics providers, freight forwarders, freight brokers, or truck carriers. Below are definitions of these four supply chain functions:
- Third-party logistics providers provide multiple, bundled supply chain services such as storage, transportation, material sourcing, etc.;
- Freight brokers buy and sell transportation services, normally working on behalf of a carrier or shipper;
- Freight forwarders deal directly with goods that need to be shipped when organizing and executing the transportation of consolidated shipments; and
- Truck carriers transport goods via on-road vehicles. In SmartWay, truck carriers are considered “logistics partners” if they contract out more than 5% of their goods movement services.
At 61%, freight brokering was the most common business focus of SmartWay Logistics Partners, with 50% of businesses focusing exclusively on brokering.
Logistics companies can check out SmartWay’s Partner List to find thousands of fuel-efficient truck carriers across Canada and the United States that are registered in SmartWay.
To join SmartWay, contact us at:
Telephone: 1-855-322-1564
Email: smartway.canada@nrcan-rncan.gc.ca
| Logistics Provider | Freight Forwarder | Freight Broker | Truck Carrier | |
|---|---|---|---|---|
| <50% | 95 | 40 | 65 | 49 |
| 50-99% | 65 | 24 | 93 | 11 |
| 100% | 132 | 21 | 158 | 21 |
| Total Partner count | 292 | 85 | 316 | 81 |
2012: SmartWay Logistics Partners Predominately Use SmartWay Carriers
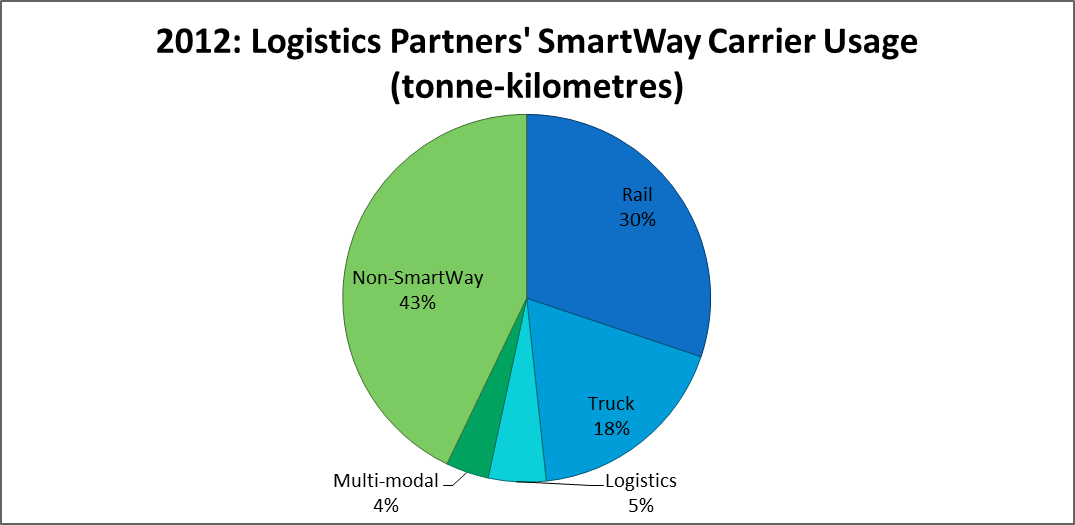
The majority of Canadian and American SmartWay Logistics Partners prefer to use SmartWay carriers for goods movement — 57% of the 1 trillion tonne-kilometres of goods movement in 2012 were carried out with SmartWay carriers. In 2012, SmartWay Logistics Partners predominately used SmartWay Rail and Truck Partners to move freight (on a weight basis).
Using SmartWay carriers is an effective way to work with the best fuel efficient and environmental performers. Logistics companies can check out SmartWay’s Partner List to find companies which are committed to reducing their fuel consumption.
To join SmartWay, contact us at:
Telephone: 1-855-322-1564
Email: smartway.canada@nrcan-rncan.gc.ca
| SmartWay Category | Carrier Percentage |
|---|---|
| Rail | 30% |
| Truck | 18 % |
| Logistics | 5 % |
| Multi-modal | 4% |
| Non-SmartWay | 43% |
2012 Truck Tool: How New Are SmartWay Fleets?

The majority of SmartWay truck carriers operate new and efficient fleets. A new engine contributes greatly to reducing the emissions of harmful pollutants. All engines with model year 2010 or newer are the cleanest and most efficient in terms of emissions reduction.
| Pre-1989 | 542 |
|---|---|
| 1989 | 186 |
| 1990 | 221 |
| 1991 | 269 |
| 1992 | 329 |
| 1993 | 653 |
| 1994 | 1176 |
| 1995 | 2326 |
| 1996 | 2764 |
| 1997 | 4014 |
| 1998 | 5937 |
| 1999 | 9324 |
| 2000 | 12476 |
| 2001 | 10217 |
| 2002 | 9395 |
| 2003 | 11837 |
| 2004 | 15574 |
| 2005 | 28327 |
| 2006 | 38717 |
| 2007 | 53385 |
| 2008 | 17946 |
| 2009 | 32085 |
| 2010 | 41880 |
| 2011 | 42658 |
| 2012 | 76171 |
| 2013 | 51521 |
2012: The Majority of Canadian SmartWay Truck Carriers are Returning Partners
.png)
In 2013, 88% of Canadian Truck Partners participated in the program the year before. Companies who participate in the program for multiple years have access to yearly data to benchmark their operations over time.
SmartWay works with new and returning Partners to become more fuel efficient. Truck carriers interested in becoming part of the SmartWay Transport Partnership may contact SmartWay or complete the 2013 Truck Tool.
| Returning Canadian Partners | New Canadian Partners | |
|---|---|---|
| Number of Partners | 218 (88%) | 30 (12%) |
2012: Most SmartWay Truck Carrier Partners Have fewer than 50 Trucks
(1).png)
Canadian and US SmartWay Truck Partners operate a wide variety of fleets, ranging from small fleets with less than 50 trucks to large fleets of over 1000 trucks. The majority of SmartWay fleets are small, with 49% of SmartWay's fleets consisting of less than 50 trucks.
SmartWay accepts truck carriers of any size, with the common goal of improving fleet efficiency. Truck carriers interested in becoming part of the SmartWay Transport Partnership may contact SmartWay or complete the 2013 Truck Tool.
| Number of Fleets | Number of Trucks | |
|---|---|---|
| 1-50 Trucks | 1270 | 24881 |
| 50-100 Trucks | 471 | 33033 |
| 100-500 Trucks | 670 | 136836 |
| 500-1000 Trucks | 98 | 70397 |
| 1000+ Trucks | 94 | 455167 |
2012: SmartWay Truck Carrier Fleets are Used in a Wide Range of Operations
.png)
SmartWay Partners are well diversified over a variety of operation and body types. Fleets are compared against other fleets in the same category for benchmarking and emissions ranking to ensure Partners are compared against similar fleets. The largest fleet category is the Truck Load/Dry Van (TL/Dry Van) category, but SmartWay has fleets in all categories.
If you would like to know how your fleet's emissions and operations compare to other fleets registered in SmartWay, contact SmartWay or complete the 2013 Truck Tool.
| SmartWay Category | Number of Fleets |
|---|---|
| Truck Load/Dry Van | 858 |
| Mixed | 530 |
| Refrigerated | 474 |
| Flatbed | 174 |
| Less Than Truck Load/Dry Van | 141 |
| Dray | 95 |
| Tanker | 82 |
| Expedited | 60 |
| Specialized | 49 |
| Auto Carrier | 38 |
| Moving | 35 |
| Package | 35 |
| Heavy Haul | 20 |