

Technical Reference
Overview
The ENERGY STAR score for warehouses applies to non-refrigerated warehouses, refrigerated warehouses, distribution centres and self-storage facilities. The objective of the ENERGY STAR score is to provide a fair assessment of the energy performance of a property, relative to its peers, taking into account the climate, weather, and business activities at the property. A statistical analysis of the peer building population is performed to identify the aspects of building activity that are significant drivers of energy use and to normalize for those same factors. The result of this analysis is an equation that predicts the energy use of a property, based on its experienced business activities. The energy use prediction for a building is compared to its actual energy use to yield a 1 to 100 percentile ranking of performance, relative to the national population.
- Property types. The ENERGY STAR score for warehouses applies to four property types: non-refrigerated warehouses, refrigerated warehouses, distribution centres and self-storage facilities. The score applies to individual buildings for non-refrigerated warehouses, refrigerated warehouses and distribution centres. Campus scores can be applied to Canadian self-storage facilities.
- Reference data. The analysis for warehouses in Canada is based on data from the Survey on Commercial and Institutional Energy Use (SCIEU), which was commissioned by Natural Resources Canada (NRCan) and carried out by Statistics Canada, and represents the energy consumption year 2014.
- Adjustments for weather and business activity. The analysis includes adjustments for:
- Ceiling height of the warehouse
- Percent of the building that is heated
- Weather and climate (using heating degree days, retrieved based on postal code)
- Worker density
- Percent of the building that is refrigerated (cold storage)
- Release date. This is the original release of the ENERGY STAR score for warehouses in Canada.
This document presents details on the development of the 1 – 100 ENERGY STAR score for warehouse properties. More information on the overall approach to develop ENERGY STAR scores is covered in our Technical Reference for the ENERGY STAR Score (PDF, 709 KB). The subsequent sections of this document offer specific details on the development of the ENERGY STAR score for warehouses:
- Overview
- Reference data & filters
- Variables analyzed
- Regression equation results
- Energy star score lookup table
- Example calculation
Reference data & filters
The ENERGY STAR score for warehouse properties in Canada applies to non-refrigerated warehouses, refrigerated warehouses, distribution centres and self-storage facilities property types. The reference data used to establish the peer building population is based on data from the Survey on Commercial and Institutional Energy Use (SCIEU), which was commissioned by Natural Resources Canada and carried out by Statistics Canada in late 2015 and early 2016. The energy data for the survey was from the calendar year 2014. The raw collected data file for this survey is not publicly available, but a report providing summary results is available on Natural Resources Canada’s website at Survey of Commercial and Institutional Energy Use (SCIEU) - Buildings 2014 – Data Tables.
To analyze the building energy and operating characteristics in this survey data, four types of filters are applied to define the peer group for comparison and to overcome any technical limitations in the data: Building Type Filters, Program Filters, Data Limitation Filters, and Analytical Filters. A complete description of each of these categories is provided in our Technical Reference for the ENERGY STAR Score (PDF, 709 KB). Figure 1 presents a summary of each filter applied in the development of the ENERGY STAR score for warehouses and the rationale behind the filter. After all filters are applied, the remaining data set has 222 observations. Due to the confidentiality of the survey data, NRCan is not able to identify the number of cases after each filter.
| Condition for Including an Observation in the Analysis | Rationale |
|---|---|
| Defined as category 5 in SCIEU – Warehouse | The SCIEU survey covered the commercial and institutional sector and included buildings of all types. For this model, only the observations identified as primarily warehouses are used. |
| Building must be more than 50% warehouse and less than 50% of another building type | Building Type Filter – To be considered part of the warehouse peer group, the building must have a minimum warehouse space. |
| Must have electricity consumption data | Program Filter – Warehouses that do not use electricity are rare or non-existent and may indicate an omission in energy data. Electricity can be grid-purchased or produced on site. |
| Must not use any “other” fuels for which the consumption is not reported | Data Limitation Filter – The survey asked whether fuels other than purchased electricity, on-site generated electricity from renewable sources, natural gas, light fuel oil, diesel, kerosene, propane, district steam, district hot water or district chilled water were consumed in the facility. Either the type of energy was not defined or in the case of wood, the energy was not easily convertible; therefore, the energy content of these fuels could not be directly compared. In such cases, these observations were removed from the analysis. |
| Must be built in 2013 or earlier | Data Limitation Filter – The survey reported the energy for calendar year 2014. Therefore, if the building was being built in 2014, a full year of energy data would not be available. |
| Building must operate for a minimum of 30 hours per week | Program Filter – Warehouses must operate for ≥ 30 hours a week to be considered a full-time operating warehouse. |
| Must not include energy supplied to other buildings | Data Limitation Filter – The survey asked whether the energy reported at the facility included energy supplied to other buildings such as a multi-building complex or portables. Usage data may not have been included, therefore buildings were removed. |
| The size of the indoor or partially enclosed parking structures must be less than 50% of the gross floor area including indoor and partially enclosed parking structures | Program Filter – If the combined square foot of parking structures exceeds the size of the office building, then the overall structure is classified as parking, not warehouse. This is a standard policy in Portfolio Manager. |
| The size of the vacant space must be less than 50% of the gross floor area | Program Filter – Occupancy needs to be greater than 50% for warehouses to meet ENERGY STAR certification requirements. |
| Must operate at least 10 months per year | Program Filter – Basic requirement to be considered as full-time operation. |
| Source EUI must be greater than or equal to 0.1 GJ/m2 and less than or equal to 4.5 GJ/m2 | Analytical Filter – Values determined to be outliers based on analysis of the data. Outliers are typically clearly outside normal operating parameters for a building of this type. |
| Must have a worker density (workers per 100 m2) that is less than or equal to 6.5 | Analytical Filter – Values determined to be outliers based on analysis of the data. Outliers are typically clearly outside normal operating parameters for a building of this type. |
| Must have a forklift density (forklifts per 100 m2) less than or equal to 1.5 | Analytical Filter – Values determined to be outliers based on analysis of the data. Outliers are typically clearly outside normal operating parameters for a building of this type. |
| Must be at least 464.5 m2 | Analytical Filter – The analysis could not model behaviours for buildings smaller than 464.5 m2 (5,000 ft2). |
| Must have a loading dock density (loading docks per 100 m2) less than or equal to 0.75 | Analytical Filter – Values determined to be outliers based on analysis of the data. Outliers are typically clearly outside normal operating parameters for a building of this type. |
| Must have a ceiling height (clear height) greater than or equal to 2 m and less than or equal to 20 m | Analytical Filter – Values determined to be outliers based on analysis of the data. Outliers are typically clearly outside normal operating parameters for a building of this type. |
| Percent cold storage plus percent cooled must be less than or equal to 110% | Analytical Filter – Values determined to be outliers based on analysis of the data. Outliers are typically clearly outside normal operating parameters for a building of this type. |
| Percent cold storage plus percent heated must be less than or equal to 110% | Analytical Filter – Values determined to be outliers based on analysis of the data. Outliers are typically clearly outside normal operating parameters for a building of this type. |
Of the filters applied to the reference data, some result in constraints on calculating a score in Portfolio Manager, and others do not. Building Type and Program Filters are used to limit the reference data to include only properties that are eligible to receive a score in Portfolio Manager, and are therefore related to eligibility requirements. In contrast, Data Limitation Filters account for limitations in the data available during the analysis, but do not apply in Portfolio Manager. Analytical Filters are used to eliminate outlier data points or different subsets of data, and may or may not affect eligibility. In some cases, a subset of the data has a different behaviour from the rest of the properties (e.g. warehouses that are smaller than 464.5 m2 do not behave the same way as larger buildings), in which case an Analytical Filter is used to determine eligibility in Portfolio Manager. In other cases, Analytical Filters exclude a small number of outliers with extreme values that skew the analysis, but do not affect eligibility requirements. A full description of the criteria you must meet to obtain a score in Portfolio Manager is available at www.energystar.gov/EligibilityCriteria.
Another consideration related to the filters and eligibility criteria described above is how Portfolio Manager treats properties that are situated on a campus. The main unit for benchmarking in Portfolio Manager is the property, which may be used to describe either a single building or a campus of buildings. The applicability of the ENERGY STAR score depends on the type of property. For the warehouse subtype of self-storage properties, the score is based on the entire property, whether it is a single building or a campus of buildings. Self-storage facilities may have multiple buildings that are all integral to the primary activity, such as numerous outdoor storage buildings with one central office at the gatehouse. For the remaining warehouse subtypes of non-refrigerated warehouses, refrigerated warehouses, and distribution centres, the score is based on individual buildings because the primary function of the warehouse is contained within a single building and the properties included in the reference data are single buildings. In cases where multiple non-refrigerated warehouses, refrigerated warehouses, or distribution centres are situated together (e.g. a warehouse campus), each individual building can receive its own ENERGY STAR score, but the campus cannot earn a score.
Variables analyzed
To normalize for differences in business activity, we performed a statistical analysis to understand what aspects of building activity are significant with respect to energy use. The filtered reference data set, described in the previous section, was analyzed using a weighted ordinary least squares regression, which evaluated energy use relative to business activity (e.g. number of workers, operating hours per week, floor area, and climate). This linear regression yielded an equation that is used to compute energy use (also called the dependent variable) based on a series of characteristics that describe the business activities (also called independent variables). This section details the variables used in the statistical analysis for warehouse in Canada.
Dependent Variables
The dependent variable is what we try to predict with the regression equation. For the warehouse analysis, the dependent variable is energy consumption, expressed in source energy use intensity (source EUI). This is equal to the total source energy use of the property divided by the gross floor area. The regression analyzes the key drivers of source EUI—those factors that explain the variation in source energy use per square metre in warehouses. The units for source EUI in the Canadian model are annual gigajoules per square metre (GJ/m2).
Independent Variables
The reference survey contains numerous property operation questions that NRCan identified as potentially important for warehouses. Based on a review of the available variables in the reference data, in accordance with the criteria for inclusion in Portfolio Manager,Footnote 1 NRCan initially analyzed the following variables in the regression analysis:
- Gross floor area (m2)
- Cooling degree days (CDD)
- Heating degree days (HDD)
- Percentage of floor space that is cooled
- Percentage of floor space that is heated
- Weekly hours of operation
- Number of workers during the main shift
- Percent of building that is refrigerated (walk-in or otherwise)
- Length of open refrigerated cases
- Length of closed refrigerated cases
- Length of open freezer cases
- Length of closed freezer cases
- Months in operation in 2014
- Number of commercial appliances (freezers, refrigerators, dishwashers, ovens, microwaves, washers, etc.)
- Number of computers
- Number of floors
- Number of elevators and escalators
- Number of printers, photocopiers, fax machines and multi-functional devices
- Number of televisions/electronic displays/LCDs
- Number of forklifts
- Number of loading docks
- Length of conveyor belts
- Percent of warehouse dedicated to assembly
- Clear height
- Year of construction
NRCan, with the advice of the Environmental Protection Agency (EPA), performed an extensive review on all of these operational characteristics individually and in combination with each other (e.g. heating degree days times percent heated). As part of the analysis, some variables were reformatted to reflect the physical relationships of building components. For example, the number of workers on the main shift can be evaluated in a density format. The number of workers per square metre (as opposed to the gross number of workers) could be expected to be related to the energy use per square metre. Also, based on analytical results and residual plots, variables were examined using different transformations (such as the natural logarithm, abbreviated as Ln). The analysis consists of multiple regression formulations. These analyses are structured to find the combination of statistically significant operating characteristics that explained the greatest amount of variance in the dependent variable: source EUI.
The final regression equation includes the following variables:
- Warehouse ceiling height, or clear height (m)
- Number of heating degree days times percent of the building that is heated (PercHeat x HDD)
- Number of workers per 100 m2 during main shift (worker density)
- Percent Cold Storage (sum of refrigerated area / total area)
- Presence of percent cold storage greater than or equal to 20%, times the number of heating degree days (IsRfgHDD20)
These variables are used together to compute the predicted source EUI for warehouses. The predicted source EUI is the mean EUI for a hypothetical population of buildings that share the same values for each of these characteristics. That is, the mean energy for buildings that operate like your building.
Clear Height Analysis
Analyses revealed that, on average, warehouses with higher ceilings have higher source EUI values. This relationship was statistically significant, and the final regression includes an adjustment for clear height. The inclusion of the clear height adjustment allows warehouses with very high ceilings—and thus more volume to heat or cool—to score fairly compared to those with lower ceilings.
Climate (HDD and CDD) Analysis
The analysis looked at the heating degree days, cooling degree days, percent of the building that is heated, and percent of the building that is cooled.
There was a strong positive correlation between the EUI as the number of heating degree days increased, and as the percent heated increased. Combining these two terms created a significance that was larger than its component parts, improving the regression results.
When analyzing percent cooled and cooling degree days, it was noted that few warehouses had large percentages of their area that was cooled. The majority of the observations had less than 40% of their floor space cooled, and the percent cooled was usually close to the percent of non-warehouse space, such as office space. This implies that warehouses were generally cooling their administrative or business areas and leaving warehouse space uncooled. As well, those that did have high percentages of their floor area cooled had similar EUI values to those with low-percent cooling, leading to the conclusion that percent cooled and cooling degree days are not significant.
Worker Density Analysis:
Worker density is a key variable in the warehouse model, as it was found to best represent levels of activity in the warehouse. While other variables such as forklift density, loading dock density or conveyor belt length are expected to contribute to higher EUI, it was determined that worker density best predicts the EUI and explains variance in the other variables. When the impact of worker density is considered in the model, the impacts of forklift density, loading dock density and conveyor belt length are insignificant.
Cold Storage:
Data provided in the SCIEU 2014 survey included:
- Percent volume warehouse refrigerated – The percentage of the warehouse volume that is refrigerated below a specified setpoint.
- Percent of the building that is warehouse – Provided directly in the survey by area.
- Percent of the building that is walk-in refrigeration – Calculated from the total area of the building that has walk-in refrigerators or freezers.
The variables above were tested both individually and used together to generate a new percent cold storage variable. The percent cold storage variable consists of any spaces in the warehouse considered to be “refrigerated,” including walk-in fridges, freezers and other refrigerated space. The percent cold storage was provided directly in the U.S. CBECS survey for U.S. score development. In the U.S., higher percent cold storage was correlated with higher EUIs and was statistically significant. Therefore, NRCan generated a similar variable to test significance in Canada.
The percent cold storage was generated as follows: the sum of the percent volume refrigerated (regardless of temperature setpoint) times the percent warehouse minus the percent walk-in, added to the percent area walk-in (see abbreviated formula below).
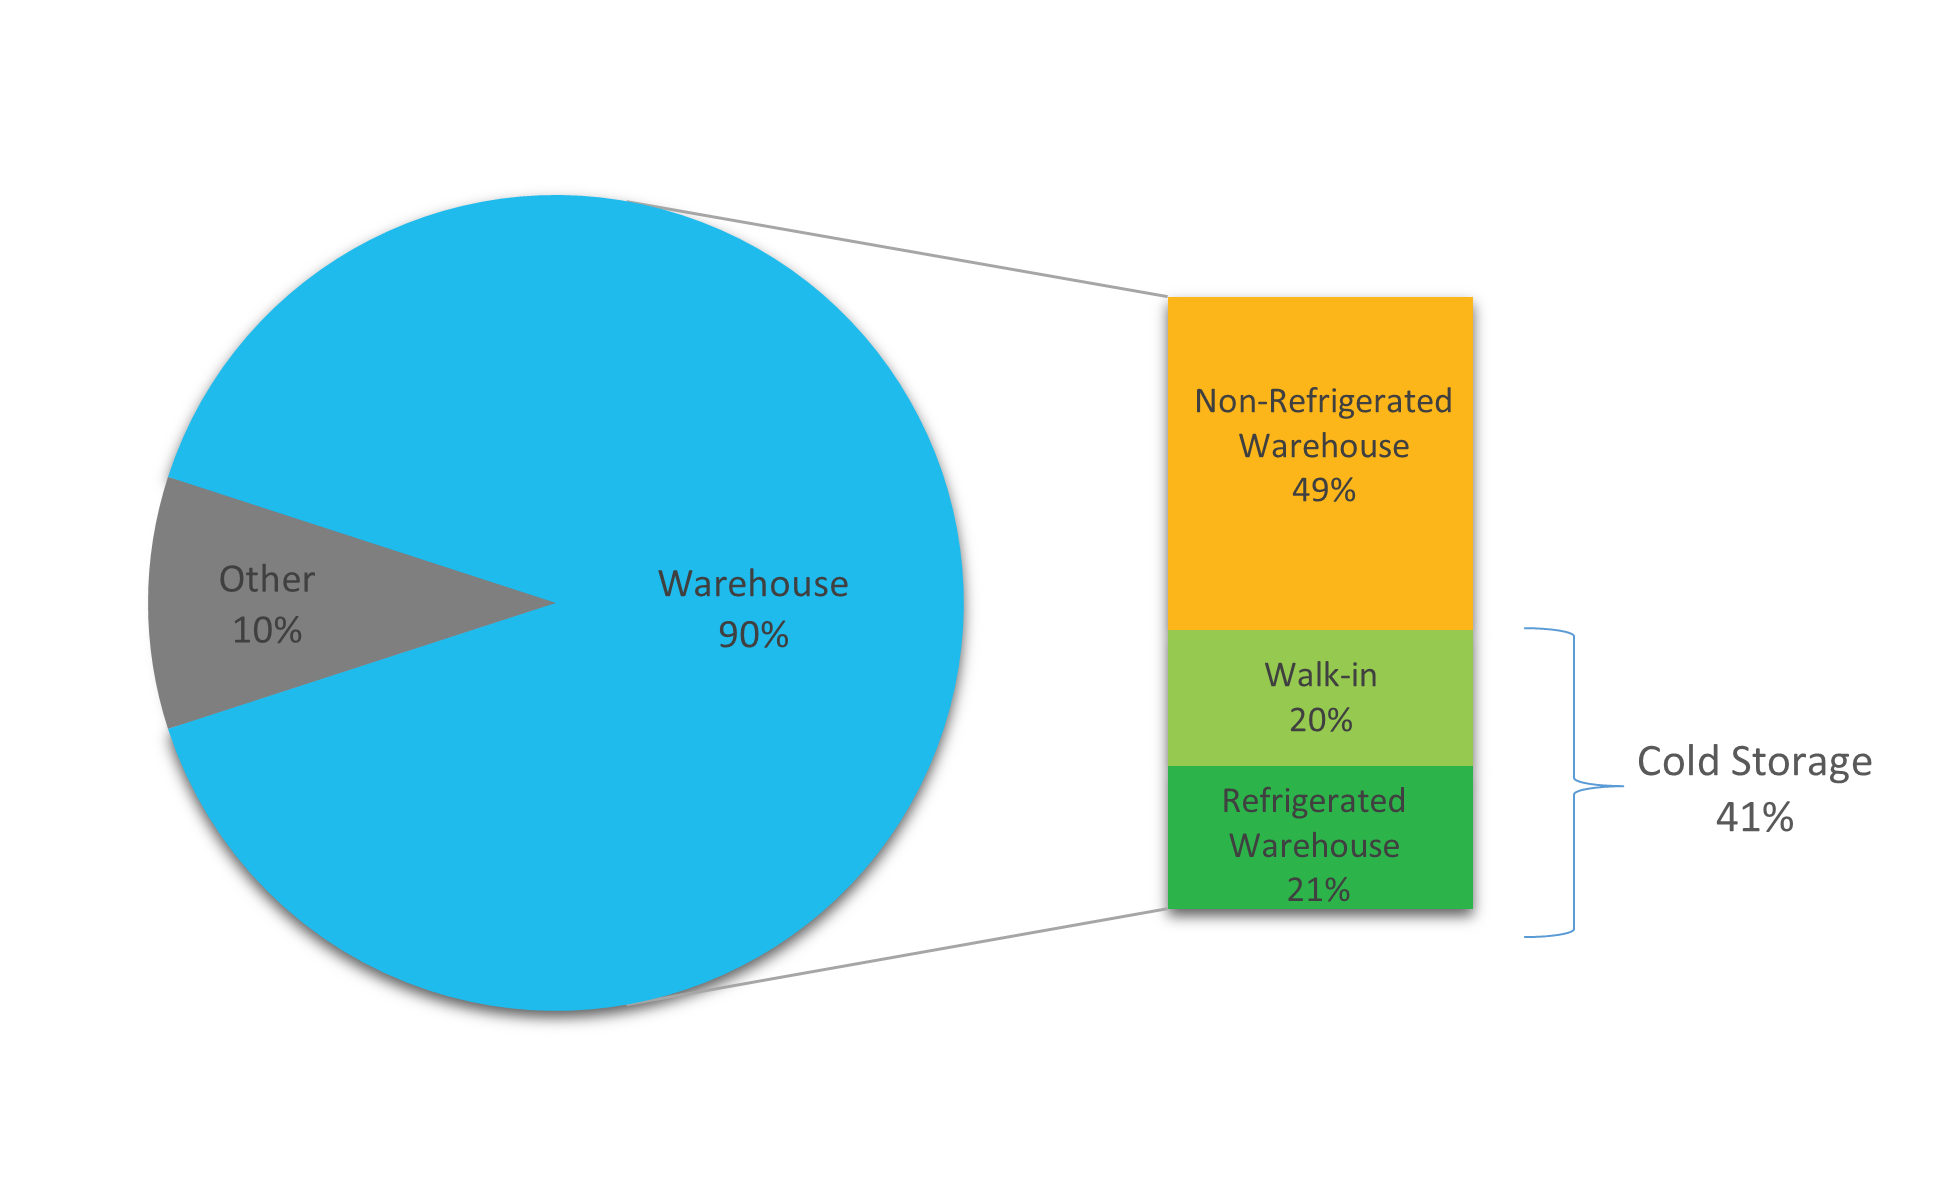
Percentage Cold Storage
= [Percent Volume Refrigerated × (Percent Warehouse - Percent Walk ̵in)] + Percent Area Walk ̵in
As an example, if the survey provided the following data:
- Percent volume warehouse refrigerated – 30%
- Percent of building that is warehouse – 90%
- Percent of building that is walk-in – 20%
The percent cold storage would be equal to 41%.
Percent Cold Storage = [30% × (90% - 20%)] + 20%
Percent Cold Storage = 41%
The volume refrigerated data collected referred to the warehouse only, and was normalized by multiplying it by the percentage of the building that is warehouse to get a true building percent volume refrigerated. In this calculation, the percent area walk-in is subtracted from the equation since it is already normalized to the buildings, and not omitting it would result in the area being counted twice. It was found that the normalized volume refrigerated is proportional to the normalized area refrigerated, so the volume is flattened in order to interact with area walk-in. The now normalized percent area refrigeration was added to the normalized building walk-in area to provide the percent cold storage.
The model includes another interactive term to account for refrigeration, noted as IsRfgHDD20 in the tables below. It is equal to the presence of percent cold storage greater than or equal to 20% (1 for yes, 0 for no), times the number of heating degree days. If the percent cold storage is less than 20%, then this term is equal to zero. If the percent cold storage is great than 20%, the IsRfgHDD20 term captured a relationship evident in the data, which showed that buildings with large percentages of refrigeration had a higher EUI as HDD increases. Through an iterative analysis, it was found that this point was around 20% of the building’s floor area.
Testing
Finally, NRCan further analyzed the regression equation using actual data that has been entered in Portfolio Manager. This provided another set of buildings to examine, in addition to the SCIEU data, to see the ENERGY STAR scores and distributions, and to assess the impacts and adjustments. This analysis on a separate data set provided a second level of verification to ensure that there was a good distribution of scores. This analysis also provided confirmation that there are minimal biases with respect to the key operational characteristics such as worker density or percent heated. It also confirmed that there was no regional bias or bias for the type of energy used for heating.
It is important to reiterate that the final regression equation is based on the nationally representative reference data from SCIEU 2014, not on data previously entered into Portfolio Manager.
Regression equation results
The final regression is a weighted ordinary least squares regression across the filtered data set of 222 observations. The dependent variable is source EUI. Each independent variable is centered relative to the weighted mean value, presented in Figure 2. The final equation is presented in Figure 3. All variables in the regression equation are significant at the 95% confidence level or better, as shown by their respective significance levels.
The regression equation has a coefficient of determination (R2) value of 0.402, indicating that this equation explains 40.2% of the variance in source EUI for office buildings. Because the final equation is structured with energy per unit area as the dependent variable, the explanatory power of the area is not included in the R2 value, and thus this value appears artificially low. Recomputing the R2 value in units of source energyFootnote 2 demonstrates that the equation actually explains 89.5% of the variation in total source energy of warehouses. This is an excellent result for a statistically based energy model.
Detailed information on the ordinary least squares regression approach is available in our Technical Reference for the ENERGY STAR Score (PDF, 709 KB).
| Variable | Minimum | Median | Maximum | Mean |
|---|---|---|---|---|
| Source energy per square metre (GJ/m2) | 0.111 | 0.952 | 4.483 | 1.088 |
| Clear height | 3.000 | 5.000 | 14.000 | 5.737 |
| PercHeat x HDD | 0 | 4257 | 6542 | 3749 |
| Worker density | 7.000E-03 | 0.7340 | 4.083 | 0.883 |
| IsRfgHDD20 | 0 | 0 | 7053 | 391.7 |
| Percent cold storage | 0 | 0 | 0.9800 | 0.052 |
Figure 3 – Final Regression Results
| Dependent variable | Source energy use intensity (GJ/m2) | |
|---|---|---|
| Number of observations in analysis | 222 | |
| R2 value | 0.402 | |
| Adjusted R2 value | 0.388 | |
| F statistic | 29 | |
| Significance (p-level) | < 0.0001 | |
| Dependent variable | Unstandardized Coefficients | Standard Error | T Value | Significance (p-level) |
|---|---|---|---|---|
| Constant | 1.088 | 0.03066 | 35.49 | <.0001 |
| Clear height | 4.18E-02 | 1.85E-02 | 2.25 | 0.0252 |
| PercHeat x HDD | 9.76E-05 | 1.89E-05 | 5.16 | <.0001 |
| Worker density | 0.2090 | 0.04797 | 4.35 | <.0001 |
| IsRfgHDD20 | 1.13E-04 | 3.79E-05 | 2.98 | 0.0032 |
| Percent cold storage | 0.7670 | 0.3160 | 2.43 | 0.0016 |
Notes:
|
||||
Energy star score lookup table
The final regression equation (presented in Figure 3) yields a prediction of source EUI based on a building’s operating characteristics. Some buildings in the SCIEU data sample use more energy than predicted by the regression equation, while others use less. The actual source EUI of each reference data observation is divided by its predicted source EUI to calculate an energy efficiency ratio:
An efficiency ratio lower than one indicates that a building uses less energy than predicted, and consequently is more efficient. A higher efficiency ratio indicates the opposite.
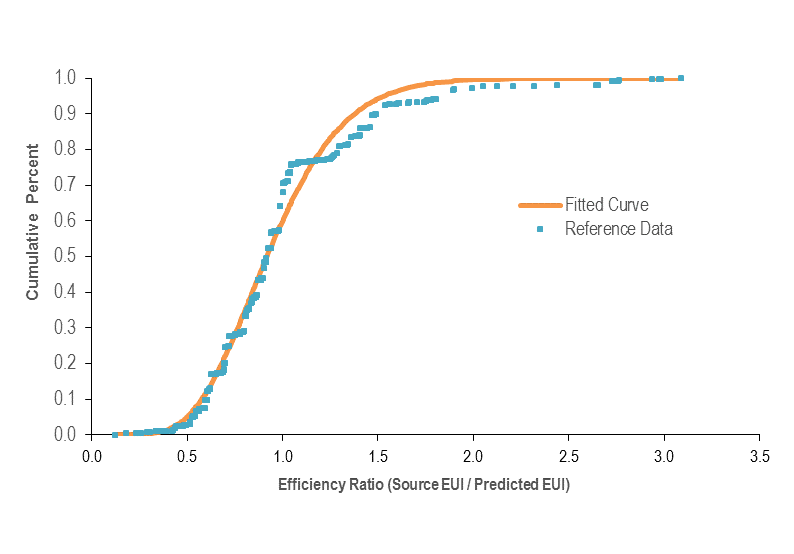
The efficiency ratios are sorted from smallest to largest, and the cumulative percent of the population at each ratio is computed using the individual observation weights from the reference data set. Figure 4 presents a plot of this cumulative distribution. A smooth curve (shown in orange) is fitted to the data using a two-parameter gamma distribution. The fit is performed in order to minimize the sum of squared differences between each building’s actual percent rank in the population and each building’s percent rank with the gamma solution. The final fit for the gamma curve yielded a shape parameter (alpha) of 8.5852 and a scale parameter (beta) of 0.1113. For this fit, the sum of the squared error is 0.3596.
Figure 4 – Distribution for Warehouses
The final gamma shape and scale parameters are used to calculate the efficiency ratio at each percentile (1 to 100) along the curve. For example, the ratio on the gamma curve at 1% corresponds to a score of 99; only 1% of the population has a ratio this small or smaller. The ratio on the gamma curve at the value of 25% corresponds to the ratio for a score of 75; only 25% of the population has a ratio this small or smaller. The complete score lookup table is presented in Figure 5.
Figure 5 – ENERGY STAR Score Lookup Table for Warehouses
| ENERGY STAR Score | Cumulative Percent | Energy Efficiency Ratio | |
|---|---|---|---|
| > = | < | ||
| 100 | 0% | 0.0000 | 0.3623 |
| 99 | 1% | 0.3623 | 0.4099 |
| 98 | 2% | 0.4099 | 0.4423 |
| 97 | 3% | 0.4423 | 0.4678 |
| 96 | 4% | 0.4678 | 0.4894 |
| 95 | 5% | 0.4894 | 0.5083 |
| 94 | 6% | 0.5083 | 0.5252 |
| 93 | 7% | 0.5252 | 0.5407 |
| 92 | 8% | 0.5407 | 0.5551 |
| 91 | 9% | 0.5551 | 0.5686 |
| 90 | 10% | 0.5686 | 0.5814 |
| 89 | 11% | 0.5814 | 0.5935 |
| 88 | 12% | 0.5935 | 0.6050 |
| 87 | 13% | 0.6050 | 0.6162 |
| 86 | 14% | 0.6162 | 0.6269 |
| 85 | 15% | 0.6269 | 0.6373 |
| 84 | 16% | 0.6373 | 0.6473 |
| 83 | 17% | 0.6473 | 0.6571 |
| 82 | 18% | 0.6571 | 0.6667 |
| 81 | 19% | 0.6667 | 0.6760 |
| 80 | 20% | 0.6760 | 0.6852 |
| 79 | 21% | 0.6852 | 0.6942 |
| 78 | 22% | 0.6942 | 0.7030 |
| 77 | 23% | 0.7030 | 0.7117 |
| 76 | 24% | 0.7117 | 0.7203 |
| 75 | 25% | 0.7203 | 0.7287 |
| 74 | 26% | 0.7287 | 0.7371 |
| 73 | 27% | 0.7371 | 0.7453 |
| 72 | 28% | 0.7453 | 0.7535 |
| 71 | 29% | 0.7535 | 0.7616 |
| 70 | 30% | 0.7616 | 0.7697 |
| 69 | 31% | 0.7697 | 0.7776 |
| 68 | 32% | 0.7776 | 0.7856 |
| 67 | 33% | 0.7856 | 0.7935 |
| 66 | 34% | 0.7935 | 0.8014 |
| 65 | 35% | 0.8014 | 0.8092 |
| 64 | 36% | 0.8092 | 0.8170 |
| 63 | 37% | 0.8170 | 0.8248 |
| 62 | 38% | 0.8248 | 0.8326 |
| 61 | 39% | 0.8326 | 0.8403 |
| 60 | 40% | 0.8403 | 0.8481 |
| 59 | 41% | 0.8481 | 0.8559 |
| 58 | 42% | 0.8559 | 0.8637 |
| 57 | 43% | 0.8637 | 0.8714 |
| 56 | 44% | 0.8714 | 0.8793 |
| 55 | 45% | 0.8793 | 0.8871 |
| 54 | 46% | 0.8871 | 0.8949 |
| 53 | 47% | 0.8949 | 0.9028 |
| 52 | 48% | 0.9028 | 0.9108 |
| 51 | 49% | 0.9108 | 0.9187 |
| ENERGY STAR Score | Cumulative Percent | Energy Efficiency Ratio | |
|---|---|---|---|
| >= | < | ||
| 50 | 50% | 0.9187 | 0.9267 |
| 49 | 51% | 0.9267 | 0.9348 |
| 48 | 52% | 0.9348 | 0.9429 |
| 47 | 53% | 0.9429 | 0.9511 |
| 46 | 54% | 0.9511 | 0.9594 |
| 45 | 55% | 0.9594 | 0.9677 |
| 44 | 56% | 0.9677 | 0.9761 |
| 43 | 57% | 0.9761 | 0.9846 |
| 42 | 58% | 0.9846 | 0.9932 |
| 41 | 59% | 0.9932 | 1.0019 |
| 40 | 60% | 1.0019 | 1.0106 |
| 39 | 61% | 1.0106 | 1.0196 |
| 38 | 62% | 1.0196 | 1.0286 |
| 37 | 63% | 1.0286 | 1.0378 |
| 36 | 64% | 1.0378 | 1.0471 |
| 35 | 65% | 1.0471 | 1.0565 |
| 34 | 66% | 1.0565 | 1.0662 |
| 33 | 67% | 1.0662 | 1.0760 |
| 32 | 68% | 1.0760 | 1.0860 |
| 31 | 69% | 1.0860 | 1.0962 |
| 30 | 70% | 1.0962 | 1.1066 |
| 29 | 71% | 1.1066 | 1.1172 |
| 28 | 72% | 1.1172 | 1.1281 |
| 27 | 73% | 1.1281 | 1.1393 |
| 26 | 74% | 1.1393 | 1.1508 |
| 25 | 75% | 1.1508 | 1.1626 |
| 24 | 76% | 1.1626 | 1.1748 |
| 23 | 77% | 1.1748 | 1.1873 |
| 22 | 78% | 1.1873 | 1.2003 |
| 21 | 79% | 1.2003 | 1.2138 |
| 20 | 80% | 1.2138 | 1.2277 |
| 19 | 81% | 1.2277 | 1.2422 |
| 18 | 82% | 1.2422 | 1.2574 |
| 17 | 83% | 1.2574 | 1.2732 |
| 16 | 84% | 1.2732 | 1.2899 |
| 15 | 85% | 1.2899 | 1.3075 |
| 14 | 86% | 1.3075 | 1.3261 |
| 13 | 87% | 1.3261 | 1.3459 |
| 12 | 88% | 1.3459 | 1.3671 |
| 11 | 89% | 1.3671 | 1.3900 |
| 10 | 90% | 1.3900 | 1.4149 |
| 9 | 91% | 1.4149 | 1.4423 |
| 8 | 92% | 1.4423 | 1.4728 |
| 7 | 93% | 1.4728 | 1.5074 |
| 6 | 94% | 1.5074 | 1.5475 |
| 5 | 95% | 1.5475 | 1.5954 |
| 4 | 96% | 1.5954 | 1.6556 |
| 3 | 97% | 1.6556 | 1.7378 |
| 2 | 98% | 1.7378 | 1.8725 |
| 1 | 99% | 1.8725 | >1.8725 |
Example calculation
As detailed in our Technical Reference for the ENERGY STAR Score (PDF, 709 KB), there are five steps to compute a score. The following is a specific example for the score for warehouses:
1 User enters building data into Portfolio Manager
- 12 months of energy use information for all energy types (annual values, entered in monthly metre entries)
- Physical building information (size, location, etc.) and use details describing building activity (hours, etc.)
| Energy Data | Value |
|---|---|
| Electricity | 4,500,000 kWh |
| Natural gas | 312,257 m3 |
| Property Use Details | Value |
|---|---|
| Gross floor area (m2) | 35,000 |
| HDD (provided by Portfolio Manager, based on postal code) | 2700 |
| Percent that can be heated | 10% |
| Percent used for cold storage | 90% |
| Clear height (m) | 7 |
| Number of workers on main shiftFootnote 3 | 100 |
2 Portfolio Manager computes the actual source EUI
- Total energy consumption for each fuel is converted from billing units into site energy and source energy.
- Source energy values are added across all fuel types.
- Source energy is divided by gross floor area to determine actual source EUI.
| Fuel | Billing Units | Site GJ Multiplier | Site GJ | Source Multiplier | Source GJ |
|---|---|---|---|---|---|
| Electricity | 4,500,000 kWh | 0.0036 | 16,199 | 1.83 | 29,644.2 |
| Natural gas | 312,257 m3 | 0.03843 | 12,000 | 1.06 | 12,720 |
| Total Source Energy (GJ) | 42,364 | ||||
| Source EUI (GJ/m2) | 1.2104 | ||||
3 Portfolio Manager computes the predicted source EUI
- Using the property use details from Step 1, Portfolio Manager computes each building variable value in the regression equation (determining the density as necessary).
- The centering values are subtracted to compute the centered variable for each operating parameter.
- The centered variables are multiplied by the coefficients from the warehouse regression equation to obtain a predicted source EUI.
| Variable | Actual Building Value | Reference Centering Value | Building Centered Variable | Coefficient | Coefficient x Centered Variable |
|---|---|---|---|---|---|
| Constant | - | - | - | 1.088 | 1.088 |
| Clear height | 7.000 | 5.737 | 1.263 | 4.18E-02 | 0.0527 |
| PercHeat x HDD | 270.0 | 3749 | -3479 | 9.76E-05 | -0.340 |
| Worker density* | 0.2857 | 0.883 | -0.5973 | 0.2088 | -0.125 |
| IsRfg20HDD | 2,700 | 391.7 | 2,308 | 1.130E-04 | 0.261 |
| Percent cold storage | 0.900 | 5.200E-02 | 0.8480 | 0.7670 | 0.650 |
| Predicted Source EUI (GJ/m2) | 1.587 | ||||
| *Workers per 100 m2 | |||||
4 Portfolio Manager computes the energy efficiency ratio
- The ratio equals the actual source EUI (Step 2) divided by the predicted source EUI (Step 3).
- Ratio = 1.2104 / 1.587 = 0.7627
5 Portfolio Manager uses the efficiency ratio to assign a score via a lookup table
- The ratio from Step 4 is used to identify the score from the lookup table.
- A ratio of 0.7627 is greater than 0.7616 and less than 0.7697.
- The ENERGY STAR score is 70.