

Technical Reference
Overview
The ENERGY STAR score for Multifamily Housing applies to commercial housing with a common entrance and interior hallways. The objective of the ENERGY STAR score is to fairly assess how a property’s energy use measures up against similar properties considering the climate, weather and business activities. A statistical analysis of the peer population is performed to identify the aspects of property activity that are significant drivers of energy use and to normalize for those same factors. The result of this analysis is an equation that predicts the energy use of a property, based on its business activities. This prediction is compared to the property’s actual energy use to yield a 1 to 100 percentile ranking in relation to the national population of properties.
- Property types. The ENERGY STAR score for Multifamily Housing in Canada applies to commercial housing with a common entrance and interior hallways. Commercial housing is defined as having at least 4 storeys above ground, or, a horizontal footprint of at least 600m2 measured between exterior walls and interior firewalls. The score applies to the entire Multifamily Housing, whether it is a single building or a campus of buildings.
- Reference data. The analysis for multifamily housing in Canada is based on data from the Survey of Energy Consumption of Multi-Unit Residential Buildings (SECMURBs), which was commissioned by Natural Resources Canada (NRCan) and represents the energy use for the year 2018.
- Adjustments for weather and business activity. The analysis includes adjustments for:
- Number of units
- Number of bedrooms
- Percentage of units located in Mid-Rise and High-Rise buildings
- Percent of the building that is heated
- Percent of the building that is cooled
- Weather and Climate (using heating degree days, retrieved based on postal code)
- Release date. This is the original release of the ENERGY STAR score for multifamily housing in Canada.
This document details the development of the 1 – 100 ENERGY STAR score for multifamily housing properties. For more information on the methodology used to develop ENERGY STAR scores, go to the Technical Reference for the ENERGY STAR Score (PDF, 709 KB).
The following sections explain how the ENERGY STAR score for multifamily housing is developed:
- Overview
- Reference data & filters
- Survey weights
- Variables analysed
- Regression equation results
- Energy star score lookup table
- Example calculation
Reference data & filters
The reference data used to form the peer property population relies on Survey of Energy Consumption of Multi-Unit Residential Buildings (SECMURBs), which was commissioned by Natural Resources Canada (NRCan) and represents the energy use for the year 2018. The raw collected data file for this survey is not publicly available, but a report providing summary results is available on Natural Resources Canada’s website at: Survey of Energy Consumption of Multi-Unit Residential Buildings (SECMURBs) 2018 – Data Tables
Four types of filters are applied to analyse the building energy and operating characteristics in the survey. They are set to define the peer population for comparison and to overcome any technical limitations. Those filters are: Building Type Filters, Program Filters, Data Limitation Filters, and Analytical Filters.
A complete description of each category is given in the Technical Reference for the ENERGY STAR Score (PDF, 709 KB). Figure 1 summarizes each filter used to develop the ENERGY STAR score for the multifamily housing model and the rationale that supports the filter. After all filters are applied, the remaining data set has 219 observations. Due to the confidentiality of the survey data, NRCan is not able to identify the number of cases after each filter.
| Condition for Including an Observation in the Analysis | Rationale |
|---|---|
| Buildings must be more than 50% multifamily housing and less than 50% of another building type | Building Type Filter – To be considered part of the multifamily housing peer population, the building must have a minimum multifamily housing space. |
| The building must be either four storeys above ground or have a horizontal footprint of 600 m2 | Program Filter – Requirement to be considered a commercial multifamily housing building. |
| Must have complete data for whole property energy use and operating characteristics | Program Filter – Complete data is necessary for analysis |
| Must be greater than 50% occupied by tenants | Program Filter – Must be majority occupied to be considered part of the multifamily housing peer population. |
| Must have electricity consumption data | Program Filter – Multifamily housing that do not use electricity are rare or non-existent and may indicate an omission in energy data. Electricity can be grid-purchased or produced on site. |
| Consumption data must be for energy year 2018 | Data Limitation Filter – Multifamily housing with consumption data whose start and end date do not align or extend significantly outside of consumption year 2018 are not comparable to the peer population |
| Must not use any “other” fuels for which the consumption is not reported | Data Limitation Filter – Energy types defined as “other” could not be compared directly. In such cases, these observations were removed from the analysis. |
| The percent of the building that is heated must be greater than 50% | Program Filter – Multifamily housing must be at least 50% heated to be considered multifamily housing in Canada. |
| The size of the indoor or partially enclosed parking structures must be less than 50% of the gross floor area including indoor and partially enclosed parking structures | Program Filter – If the combined square foot of parking structures exceeds the size of the multifamily housing, then the overall structure is classified as parking, not multifamily housing. This is a standard policy in Portfolio Manager. |
| The count of bedrooms in the multifamily housing must be greater than or equal to the count of residential units | Program Filter – Requirement to be considered multifamily housing. Less bedrooms than units is likely due to missing data. |
| The multifamily housing must contain at least 2 residential units | Program Filter – Requirement to be considered multifamily housing. |
| The average gross floor per apartment must not exceed 4,000 ft2 (371.6 m2) | Analytical Filter – Values determined to be statistical outliers. |
| Must have a source EUI less than or equal to 2.5 GJ/m2 and greater than or equal to 0.3 GJ/m2 | Analytical Filter – Values determined to be statistical outliers. |
| Must have a residential unit density less than or equal to 3 units per 100 m2 | Analytical Filter – Values determined to be statistical outliers. |
| Must have a bedroom density less than or equal to 4 bedrooms per 100 m2 | Analytical Filter – Values determined to be statistical outliers. |
Of the filters applied to the reference data, some result in constraints on calculating a score in Portfolio Manager, and others do not. Building Type and Program Filters are used to limit the reference data to include only properties that are intended to receive a score in Portfolio Manager, and are therefore related to eligibility requirements. In contrast, Data Limitation Filters account for limitations in the data available during the analysis, but do not apply in Portfolio Manager. Analytical Filters are used to eliminate outlier data points or different subsets of data, and may or may not affect eligibility. In some cases, a subset of the data has a different behaviour from the rest of the properties in which case an Analytical Filter is used to determine eligibility in Portfolio Manager. In other cases, Analytical Filters exclude a small number of outliers with extreme values that skew the analysis, but do not affect eligibility requirements. A full description of the criteria you must meet to obtain a score in Portfolio Manager is available at Benchmarking - Frequently Asked Questions
Related to the filters and eligibility criteria described above, another consideration is how Portfolio Manager treats properties situated on a campus. The main unit for benchmarking in Portfolio Manager is the property, which may be used to describe either a single building or campus of buildings. The applicability of the ENERGY STAR score depends on the type of property. For multifamily housing, the score applies to the entire property, whether it is a single building or a campus of buildings. Multifamily housing may have multiple buildings that are all integral to the primary activity. One building may be leasing office and laundry, another, the actual residential units. In these cases, the campus can get an ENERGY STAR score as long as the energy for all the buildings is metred and reported. For cases where all the activities are contained within one building, that multifamily housing building can get an ENERGY STAR score.
Survey weights
A comprehensive national listing of multifamily buildings was not available to create a nationally representative survey, so an area probability sample was used in eight census metropolitan areas (CMAs). The eight CMAs sampled are: Vancouver, Calgary, Winnipeg, Toronto, Ottawa-Gatineau, Hamilton, Montreal, and Halifax. As such, the sample weights represent the estimated number of multifamily properties located within these CMAs.
Variables analysed
To normalize for differences in business activity, NRCan performed a statistical analysis to understand what aspects of building activity are significant with respect to energy use. The filtered reference data set, described in the previous section, was analysed using a weighted ordinary least squares regression, which evaluated energy use relative to business activity (e.g. number of workers, operating hours per week, floor area, and climate). This linear regression gives an equation used to compute energy use (also called the dependent variable) based on a series of characteristics that describe the business activities (also called independent variables). This section details the variables used in the statistical analysis for multifamily housing in Canada.
Dependent Variables
The dependent variable is what NRCan tries to predict with the regression equation. For the multifamily housing analysis, the dependent variable is energy use, expressed in source energy use intensity (source EUI). This is equal to the total source energy use of the property divided by the gross floor area. The regression analyses the key drivers of source EUI—those factors that explain the variation in source energy use per square metre in multifamily housing. The units for source EUI in the Canadian model are annual gigajoules per square metre (GJ/m2).
Independent Variables
The reference survey contains numerous property operation questions that NRCan identified as likely to be important for multifamily housing. Based on a review of the variables found in the reference data, and following the criteria for inclusion in Portfolio Manager,Footnote 1 NRCan initially analysed the following variables in the regression analysis:
- Gross floor area (m2)
- Cooling degree days (CDD)
- Heating degree days (HDD)
- Percentage of floor space that is cooled
- Percentage of floor space that is heated
- Number of residential units
- Number of bedrooms
- Residence population type
- Residential unit ownership type
- Percent common area
- Number of dishwasher hookups
- Presence of laundry
- Location of laundry services (In unit versus common area)
- Number of laundry hookups
- Presence of fitness room
- Presence of party room
- Presence of charging stations for electric vehicles
- Presence of hot tubs, whirlpools and Jacuzzi tubs
NRCan, with the advice of the Environmental Protection Agency (EPA) and its contractor, performed an extensive review on all of these operational characteristics individually and in combination with each other (e.g. heating degree-days times percent heated). As part of the analysis, some variables were reformatted to reflect the physical relationships of building components. For example, the number of residential units can be evaluated in a density format: units per 100m2. The unit density (as opposed to the gross number of units) is more closely related to the energy use intensity. In addition, using analytical results and residual plots, variables were assessed using different transformations (such as the natural logarithm, abbreviated as Ln). Overall, the analysis consists of multiple regression formulations, structured to find the combination of statistically significant operating characteristics that explained the greatest amount of variance in the dependent variable: source EUI.
The final regression equation includes the following variables:
- Number of bedrooms per 100m2, with a ceiling at 2.3 (Bedroom Density)
- Number of residential units per 100m2 (Unit Density)
- The percentage of residential units in a mid-rise or high-rise setting
- The percentage of the building that is cooled times the number of Cooling Degree Days (Percent Cooled x CDD)
- The percentage of the building that is heated times the number of Heating Degree Days (Percent Heated x HDD)
These variables are used together to compute the predicted source EUI for multifamily housing. The predicted source EUI is the mean EUI for a hypothetical population of buildings that share the same values for each of these characteristics. It is the mean energy for buildings that operate like your building. There were several variables for which NRCan did not have adequate data to make a determination regarding inclusion in the model.
Analysis of High, Mid, and Low-Rise Buildings
Analysis of building heights in multifamily housing showed a trend towards shorter buildings consuming less energy than taller buildings. To further analyse this trend, buildings were placed into three height bins: low-rise (1-4 storeys), mid-rise (5-9 storeys), and high-rise (10 or more storeys). It was noted that between low-rise and mid or high-rise, there was a large difference in energy use intensity (EUI) with the low-rise bin consuming less energy per square metre than taller buildings. Among other operational differences, this is attributed to low-rise buildings having less common space (hallways, amenities, etc.), which has a higher energy intensity than simple residential units. This aligns with trends present in Portfolio Manager data, as well as trends observed by the EPA in their multifamily datasets.
In our analysis, each property was 100% low-rise, mid-rise or high-rise. However, in Portfolio Manager, it is possible for a community to have buildings of different heights. Therefore, the percent mid-high rise variable is determined as the percentage of the property’s units that are in a mid or high-rise building. For instance, if a property consists of two buildings—one mid-rise building with 60 units and one low-rise building with 40 units—the mid-high rise variable value will be 0.6 (mid-high rise = 60/(60+40) = 0.6).
Laundry
The presence of laundry was analysed to see if it contributed to increased energy use in multifamily buildings. Unfortunately, a conclusion could not be made, as there was little variability in the survey data. 95% of properties had either laundry facilities in a common area, or had the necessary hookups for tenants to install laundry in their own unit. Because so few buildings without laundry responded, it was not possible to determine a statistically significant difference between the population with laundry, and the population without laundry.
Climate Variables
Climate is one characteristic that was examined closely. NRCan analysed the relationship between EUI and both Cooling Degree Days (CDD) and Heating Degree Days (HDD). While HDD was found to be consistently significant in the models, analysis showed that CDD also contributed to increased energy use, although to a lesser extent compared to HDD. Due to the limited variance of CDD within a single sample year, and the complex relationship between HDD and CDD in different climate regions in Canada, NRCan had concerns that the impact of cooling was not being fully represented in the model. To adjust, NRCan used a combination of analysis techniques, including linear regression of EUI and Percent Cooled x CDD in the survey data, review of engineering models, and comparisons to Portfolio Manager data, to determine an appropriate factor to account for cooling energy. From the analysis, the rate of increase of source energy to Percent Cooled x CDD was determined. Applying this adjustment resulted in a more comprehensive model with both cooling and heating terms that is better adapted to changing climate trends.
Testing
NRCan further analysed the regression equation using actual data entered in Portfolio Manager. In addition to the survey data, this analysis provided another set of buildings to examine the ENERGY STAR scores and distributions to assess the impacts and adjustments. It also confirmed that there are minimal biases when it comes to fundamental operational characteristics, such as Unit Density or Percent Heated x HDD, and that there was no regional bias or bias for the type of energy used for heating.
It is important to reiterate that the final regression equation is based on the nationally representative reference data from the survey, not on data previously entered into Portfolio Manager.
Regression equation results
The final regression is a weighted ordinary least squares regression across the filtered data set of 219 observations. The dependent variable is source EUI. Each independent variable is centred relative to the weighted mean value, presented in Figure 2. The final equation is presented in Figure 3. All variables in the regression equation are considered significant at a 85% confidence level or better, as shown by their respective significance levels.
The regression equation has a coefficient of determination (R2) value of 0.1545, indicating that this equation explains 15.45% of the variance in source EUI for multifamily housing. Because the final equation is structured with energy per unit area as the dependent variable, the explanatory power of the area is not included in the R2 value, and thus this value appears artificially low. Recomputing the R2 value in units of source energyFootnote 2 demonstrates that the equation actually explains 87.75% of the variation in total source energy of multifamily housing. It is an excellent result for a statistically based energy model.
For detailed information on the ordinary least squares regression approach, go to the Technical Reference for the ENERGY STAR Score (PDF, 709 KB).
| Variable | Minimum | Median | Maximum | Mean |
|---|---|---|---|---|
| Source energy per square metre (GJ/m2) | 0.3387 | 1.0493 | 2.4342 | 1.0956 |
| Bedroom Density* | 0.5893 | 1.766 | 2.300 | 1.726 |
| Unit Density | 0.4071 | 1.140 | 2.298 | 1.228 |
| Percent Units in Mid-Rise or High-Rise | 0 | 1.000 | 1.000 | 0.7346 |
| Percent Cooled x CDD | 0 | 0 | 496.0 | 113.1 |
| Percent Heated x HDD | 2,016 | 3,828 | 5,456 | 3,804 |
*Bedroom Density has a ceiling at 2.3 beds per 100 m2
Figure 3 – Final Regression Results
| Dependent variable | Source energy use intensity (GJ/m2) |
|---|---|
| Number of observations in analysis | 219 |
| R2 value | 0.1545 |
| Adjusted R2 value | 0.1548 |
| F statistic | 10.96 |
| Significance (p-level) | < 0.0001 |
| Dependent variable | Unstandardized Coefficients | Standard Error | T Value | Significance (p-level) |
|---|---|---|---|---|
| Constant | 1.095 | 2.462E-02 | 45.1 | <.0001 |
| Bedroom Density* | 0.1134 | 7.924E-02 | 1.45 | 0.1482 |
| Unit Density | 0.2424 | 7.576E-02 | 3.24 | 0.0014 |
| Percent Units in Mid-Rise or High-Rise | 0.2179 | 5.879E-02 | 3.76 | 0.0002 |
| Percent Cooled x CDD** | 2.000E-04 | n/a | n/a | n/a |
| Percent Heated x HDD | 4.800E-05 | 2.939E-05 | 1.66 | 0.0990 |
Notes:
|
||||
Energy star score lookup table
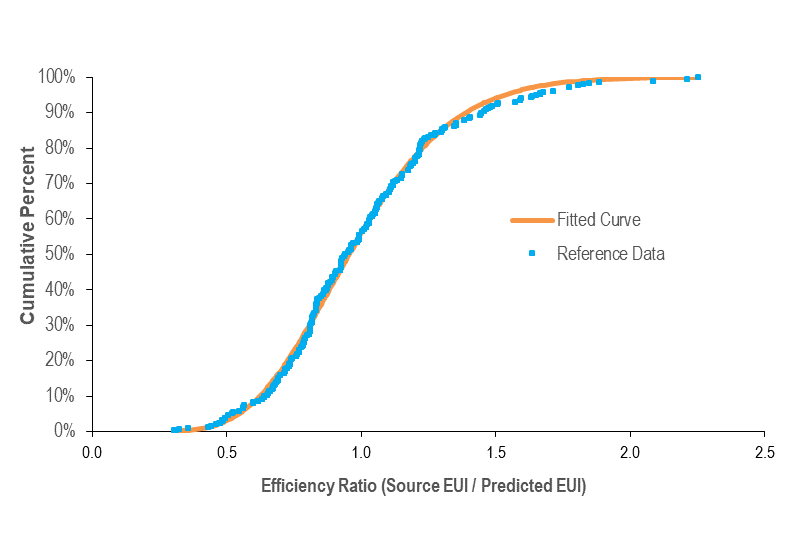
The final regression equation (presented in Figure 3) gives a prediction of source EUI based on a building’s operating characteristics. Some buildings in the SCIEU data sample use more energy than predicted by the regression equation, while others use less. The actual source EUI of each reference data observation is divided by its predicted source EUI to calculate an energy efficiency ratio:
An efficiency ratio lower than one indicates that a building uses less energy than predicted and consequently is more efficient. A higher efficiency ratio indicates the opposite.
The efficiency ratios are sorted from smallest to largest, and the cumulative percent of the population at each ratio is computed using the individual observation weights from the reference data set. Figure 4 presents a plot of this cumulative distribution. A smooth curve (shown in orange) is fitted to the data using a two-parameter gamma distribution. The fit is performed in order to minimize the sum of squared differences between each building’s actual percent rank in the population and each building’s percent rank with the gamma solution. The final fit for the gamma curve gives a shape parameter (alpha) of 10.46 and a scale parameter (beta) of 0.0943. The sum of the squared error for this fit is 0.0499.
Figure 4 – Distribution for Multifamily Housing
The final gamma shape and scale parameters are used to calculate the efficiency ratio at each percentile (1 to 100) along the curve. For example, the ratio on the gamma curve at 1% corresponds to a score of 99; only 1% of the population registers such a small or even smaller ratio. The ratio on the gamma curve at the value of 25% corresponds to the ratio for a score of 75; only 25% of the population registers such a small or even smaller ratio. Figure 5 shows the complete score lookup table.
Figure 5 – ENERGY STAR Score Lookup Table for Multifamily Housing
| ENERGY STAR Score | Cumulative Percent | Energy Efficiency Ratio | |
|---|---|---|---|
| > = | < | ||
| 100 | 0% | 0.0000 | 0.4173 |
| 99 | 1% | 0.4173 | 0.4651 |
| 98 | 2% | 0.4651 | 0.4974 |
| 97 | 3% | 0.4974 | 0.5227 |
| 96 | 4% | 0.5227 | 0.5439 |
| 95 | 5% | 0.5439 | 0.5625 |
| 94 | 6% | 0.5625 | 0.5791 |
| 93 | 7% | 0.5791 | 0.5943 |
| 92 | 8% | 0.5943 | 0.6083 |
| 91 | 9% | 0.6083 | 0.6214 |
| 90 | 10% | 0.6214 | 0.6338 |
| 89 | 11% | 0.6338 | 0.6456 |
| 88 | 12% | 0.6456 | 0.6568 |
| 87 | 13% | 0.6568 | 0.6675 |
| 86 | 14% | 0.6675 | 0.6779 |
| 85 | 15% | 0.6779 | 0.6879 |
| 84 | 16% | 0.6879 | 0.6976 |
| 83 | 17% | 0.6976 | 0.7070 |
| 82 | 18% | 0.7070 | 0.7162 |
| 81 | 19% | 0.7162 | 0.7252 |
| 80 | 20% | 0.7252 | 0.7339 |
| 79 | 21% | 0.7339 | 0.7425 |
| 78 | 22% | 0.7425 | 0.7510 |
| 77 | 23% | 0.7510 | 0.7593 |
| 76 | 24% | 0.7593 | 0.7675 |
| 75 | 25% | 0.7675 | 0.7756 |
| 74 | 26% | 0.7756 | 0.7835 |
| 73 | 27% | 0.7835 | 0.7914 |
| 72 | 28% | 0.7914 | 0.7992 |
| 71 | 29% | 0.7992 | 0.8069 |
| 70 | 30% | 0.8069 | 0.8146 |
| 69 | 31% | 0.8146 | 0.8221 |
| 68 | 32% | 0.8221 | 0.8297 |
| 67 | 33% | 0.8297 | 0.8372 |
| 66 | 34% | 0.8372 | 0.8446 |
| 65 | 35% | 0.8446 | 0.8521 |
| 64 | 36% | 0.8521 | 0.8595 |
| 63 | 37% | 0.8595 | 0.8668 |
| 62 | 38% | 0.8668 | 0.8742 |
| 61 | 39% | 0.8742 | 0.8815 |
| 60 | 40% | 0.8815 | 0.8889 |
| 59 | 41% | 0.8889 | 0.8962 |
| 58 | 42% | 0.8962 | 0.9035 |
| 57 | 43% | 0.9035 | 0.9109 |
| 56 | 44% | 0.9109 | 0.9182 |
| 55 | 45% | 0.9182 | 0.9256 |
| 54 | 46% | 0.9256 | 0.9330 |
| 53 | 47% | 0.9330 | 0.9404 |
| 52 | 48% | 0.9404 | 0.9479 |
| 51 | 49% | 0.9479 | 0.9554 |
| ENERGY STAR Score | Cumulative Percent | Energy Efficiency Ratio | |
|---|---|---|---|
| >= | < | ||
| 50 | 50% | 0.9554 | 0.9629 |
| 49 | 51% | 0.9629 | 0.9704 |
| 48 | 52% | 0.9704 | 0.9781 |
| 47 | 53% | 0.9781 | 0.9857 |
| 46 | 54% | 0.9857 | 0.9935 |
| 45 | 55% | 0.9935 | 1.0013 |
| 44 | 56% | 1.0013 | 1.0091 |
| 43 | 57% | 1.0091 | 1.0171 |
| 42 | 58% | 1.0171 | 1.0251 |
| 41 | 59% | 1.0251 | 1.0332 |
| 40 | 60% | 1.0332 | 1.0414 |
| 39 | 61% | 1.0414 | 1.0497 |
| 38 | 62% | 1.0497 | 1.0582 |
| 37 | 63% | 1.0582 | 1.0667 |
| 36 | 64% | 1.0667 | 1.0754 |
| 35 | 65% | 1.0754 | 1.0842 |
| 34 | 66% | 1.0842 | 1.0932 |
| 33 | 67% | 1.0932 | 1.1023 |
| 32 | 68% | 1.1023 | 1.1116 |
| 31 | 69% | 1.1116 | 1.1210 |
| 30 | 70% | 1.1210 | 1.1307 |
| 29 | 71% | 1.1307 | 1.1406 |
| 28 | 72% | 1.1406 | 1.1507 |
| 27 | 73% | 1.1507 | 1.1611 |
| 26 | 74% | 1.1611 | 1.1717 |
| 25 | 75% | 1.1717 | 1.1827 |
| 24 | 76% | 1.1827 | 1.1939 |
| 23 | 77% | 1.1939 | 1.2055 |
| 22 | 78% | 1.2055 | 1.2175 |
| 21 | 79% | 1.2175 | 1.2299 |
| 20 | 80% | 1.2299 | 1.2428 |
| 19 | 81% | 1.2428 | 1.2562 |
| 18 | 82% | 1.2562 | 1.2702 |
| 17 | 83% | 1.2702 | 1.2848 |
| 16 | 84% | 1.2848 | 1.3001 |
| 15 | 85% | 1.3001 | 1.3163 |
| 14 | 86% | 1.3163 | 1.3334 |
| 13 | 87% | 1.3334 | 1.3516 |
| 12 | 88% | 1.3516 | 1.3711 |
| 11 | 89% | 1.3711 | 1.3921 |
| 10 | 90% | 1.3921 | 1.4149 |
| 9 | 91% | 1.4149 | 1.4399 |
| 8 | 92% | 1.4399 | 1.4678 |
| 7 | 93% | 1.4678 | 1.4994 |
| 6 | 94% | 1.4994 | 1.5359 |
| 5 | 95% | 1.5359 | 1.5795 |
| 4 | 96% | 1.5795 | 1.6343 |
| 3 | 97% | 1.6343 | 1.7088 |
| 2 | 98% | 1.7088 | 1.8307 |
| 1 | 99% | 1.8307 | >1.8307 |
Example calculation
According to the Technical Reference for the ENERGY STAR Score (PDF, 709 KB), there are five steps to compute a score for multifamily housing. The following is an example:
1 User enters building data into Portfolio Manager
- 12 months of energy use information for all energy types (annual values, entered in monthly meter entries)
- Physical building information (size, location, etc.) and use details describing building activity (hours, etc.)
| Energy Data | Value |
|---|---|
| Electricity | 300,000 kWh |
| Natural gas | 218,141 m3 |
| Property Use Details | Value |
|---|---|
| Gross floor area (m2) | 9,000 |
| Total Number of Units | 180 |
| Total Number of Bedrooms | 250 |
| Units – Low Rise | 20 |
| Units – Mid Rise | 0 |
| Units – High Rise | 160 |
| Percent That Can Be Heated | 100% |
| Percent That Can Be Cooled | 100% |
| HDD (provided by Portfolio Manager, based on postal code) | 5,751 |
| CDD (provided by Portfolio Manager, based on postal code) | 117 |
2 Portfolio Manager computes the actual source EUI
- Total energy consumption for each fuel is converted from billing units into site energy and source energy.
- Source energy values are added across all fuel types.
- Source energy is divided by gross floor area to determine actual source EUI.
| Fuel | Billing Units | Site GJ Multiplier | Site GJ | Source Multiplier | Source GJ |
|---|---|---|---|---|---|
| Electricity | 300,000 kWh | 3.600E-03 | 1,080 | 1.83 | 1,976.4 |
| Natural gas | 218,141 m3 | 3.843E-02 | 8,383 | 1.06 | 8,885.9 |
| Total Source Energy (GJ) | 10,862 | ||||
| Source EUI (GJ/m2) | 1.1207 | ||||
3 Portfolio Manager computes the predicted source EUI
- Using the property use details from Step 1, Portfolio Manager computes each building variable value in the regression equation (determining the density as necessary).
- The centering values are subtracted to compute the centered variable for each operating parameter.
- The centered variables are multiplied by the coefficients from the multifamily housing regression equation to obtain a predicted source EUI.
| Variable | Actual Building Value | Reference Centering Value | Building Centered Variable | Coefficient | Coefficient x Centered Variable |
|---|---|---|---|---|---|
| Constant | - | - | - | 1.100 | 1.100 |
| Bedroom Density* | 2.300 | 1.726 | 0.574 | 0.1130 | 6.52E-02 |
| Unit Density | 2.000 | 1.228 | 0.772 | 0.2420 | 0.187 |
| Percent Units in Mid-Rise or High-Rise | 0.8900 | 0.7346 | 0.1554 | 0.2180 | 3.39E-02 |
| Percent Cooled x CDD | 117.0 | 113.1 | 3.909 | 2.000E-04 | 7.82E-04 |
| Percent Heated x HDD | 5,751 | 3,804 | 1,947 | 4.800E-05 | 9.35E-02 |
| Predicted Source EUI (GJ/m2) | 1.476 | ||||
4 Portfolio Manager computes the energy efficiency ratio
- The ratio equals the actual source EUI (Step 2) divided by the predicted source EUI (Step 3).
- Ratio = 1.1207 / 1.476 = 0.7593
5 Portfolio Manager uses the efficiency ratio to assign a score via a lookup table
- The ratio from Step 4 is used to identify the score from the lookup table.
- A ratio of 0.7593 is greater or equal than 0.7593 and less than 0.7675.
- The ENERGY STAR score is 76.