

Technical Reference
Overview
The ENERGY STAR score for Mailing Centers/Post Offices applies to post offices, as well as private establishments that offer mailing services and supplies. The objective of the ENERGY STAR score is to fairly assess how a property’s energy use measures up against similar properties considering the climate, weather, and business activities. A statistical analysis of the peer population is performed to identify the aspects of property activity that are significant drivers of energy use and to normalize for those same factors. The result of this analysis is an equation that predicts the energy use of a property, based on its business activities. This prediction is compared to the property’s actual energy use to yield a 1 to 100 percentile ranking in relation to the national population of properties.
- Property types. The ENERGY STAR score for Mailing Centers/Post Offices in Canada applies to post offices and other mail buildings. The score applies to individual buildings and not entire campuses of mail establishments.
- Reference data. The analysis for Mailing Centers/Post Offices in Canada is based on data provided by Canada Post Corporation representing the energy year 2021.
- Adjustments for weather and business activity. The analysis includes adjustments for:
- Building size
- Number of workers on the main shift
- Hours of operation per week
- Number of letters and packages per year
- Percent of the building that is heated and cooled
- Weather and Climate (using heating degree days and cooling degree days, retrieved based on postal code)
- Release date. August 2023 is the original release date of the ENERGY STAR score for Mailing Centers/Post Offices in Canada.
This document details the development of the 1 – 100 ENERGY STAR score for Mailing Centers/Post Offices properties. For more information on the methodology used to develop ENERGY STAR scores, go to the Technical Reference for the ENERGY STAR Score (PDF, 709 KB).
The following sections explain how the ENERGY STAR score for Mailing Centers/Post Offices is developed:
- Overview
- Reference data & filters
- Variables analyzed
- Regression equation results
- Energy star score lookup table
- Example calculation
Reference data & filters
The reference data used to form the peer property population relies on data provided by Canada Post Corporation (CPC), representing mail depots owned and operated by the CPC. The energy data for the survey was from the calendar year 2021. The raw collected data file for this survey is not publicly available.
Four types of filters are applied to analyze the building energy and operating characteristics in the survey. They are set to define the peer population for comparison and to overcome any technical limitations. Those filters are: Building Type Filters, Program Filters, Data Limitation Filters, and Analytical Filters.
A complete description of each category is given in the Technical Reference for the ENERGY STAR Score (PDF, 709 KB). Figure 1 summarizes each filter used to develop the ENERGY STAR score for Mailing Centers/Post Offices model and the rationale that supports the filter. After all filters are applied, the remaining data set has 222 observations. Due to the confidentiality of the survey data, NRCan is not able to identify the number of cases after each filter.
| Condition for Including an Observation in the Analysis | Rationale |
|---|---|
| Identified as a ‘Depot’ by Canada Post | Building Type Filter – In order to be considered a Mailing Center/Post Office, buildings must meet the definition of Depot. |
| Building must not be a mechanized sortation facility (Plant) | Building Type Filter - Mechanized facilities are distinct from other depots due to significant amounts of automation. |
| Building must have 52 weeks of mail volume information | Program Filter – Basic requirement to be considered as full-time operation. |
| Building must be ‘In service’ for the 2021 calendar year | Program Filter – Basic requirement to be considered as full-time operation. |
| The building must have at least one worker | Program Filter – Requirement to be considered a Mailing Center/Post Office. |
| The building must have a Source EUI greater than or equal to 0.5 GJ/m2 | Analytical Filter – Values determined to be statistical outliers. |
| The building must have a worker density greater than or equal to 0.1 workers per 100m2 | Analytical Filter – Values determined to be statistical outliers. |
| The building must have an annual density of mail products less than or equal to 900,000 products per 100m2 | Analytical Filter – Values determined to be statistical outliers. |
Of the filters applied to the reference data, some result in constraints on calculating a score in Portfolio Manager, and others do not. Building Type and Program Filters are used to limit the reference data to include only properties that are intended to receive a score in Portfolio Manager and are therefore related to eligibility requirements. In contrast, Data Limitation Filters account for limitations in the data available during the analysis, but do not apply in Portfolio Manager. Analytical Filters are used to eliminate outlier data points or different subsets of data and may or may not affect eligibility. In some cases, a subset of the data has a different behaviour from the rest of the properties (e.g., Mailing Centers/Post Offices with more than 900,000 mail products per 100m2 behave differently than less busy locations), in which case an Analytical Filter is used to determine eligibility in Portfolio Manager. In other cases, Analytical Filters exclude a small number of outliers with extreme values that skew the analysis but do not affect eligibility requirements. A full description of the criteria you must meet to obtain a score in Portfolio Manager is available at Benchmarking - Frequently Asked Questions.
Related to the filters and eligibility criteria described above, another consideration is how Portfolio Manager treats properties situated on a campus. The main unit for benchmarking in Portfolio Manager is the property, which may be used to describe either a single building or campus of buildings. The applicability of the ENERGY STAR score depends on the type of property. For Mailing Centers/Post Offices, the score is based on individual establishments and is not available for a campus of buildings.
Variables analyzed
To normalize for differences in business activity, NRCan performed a statistical analysis to understand what aspects of building activity are significant with respect to energy use. The filtered reference data set, described in the previous section, was analyzed using a weighted ordinary least squares regression, which evaluated energy use relative to business activity (e.g., number of workers, operating hours per week, floor area, and climate). This linear regression gives an equation used to compute energy use (also called the dependent variable) based on a series of characteristics that describe the business activities (also called independent variables). This section details the variables used in the statistical analysis for Mailing Centers/Post Offices in Canada.
Dependent Variables
The dependent variable is what NRCan tries to predict with the regression equation. For the Mailing Centers/Post Offices analysis, the dependent variable is energy use, expressed in source energy use intensity (source EUI). This is equal to the total source energy use of the property divided by the gross floor area. The regression analyzes the key drivers of source EUI—those factors that explain the variation in source energy use per square metre in Mailing Centers/Post Offices. The units for source EUI in the Canadian model are annual gigajoules per square metre (GJ/m2).
Independent Variables
The reference survey contains numerous property operation questions that NRCan identified as likely to be important for Mailing Centers/Post Offices. Based on a review of the variables found in the reference data, and following the criteria for inclusion in Portfolio Manager,Footnote 1 NRCan initially analyzed the following variables in the regression analysis:
- Gross floor area (m2)
- Cooling degree days (CDD)
- Heating degree days (HDD)
- Percentage of floor space that is cooled
- Percentage of floor space that is heated
- Weekly hours of operation
- Number of workers during the main shift
- Mix of mail product types (e.g., percent of mail that is letter mail, parcels, packages etc.)
- Number of letters and packages per year
- Delivery method (e.g., foot delivery, van delivery etc.)
- Number of delivery routes
NRCan, with the advice of the Environmental Protection Agency (EPA) and their contractor, performed an extensive review on all these operational characteristics individually and in combination with each other (e.g., heating degree days times percent heated). As part of the analysis, some variables were reformatted to reflect the physical relationships of building components. For example, the number of letters and packages per year can be evaluated in a density format: annual quantity of mail products per 100m2. The mail density (as opposed to the gross sum of mail) is more closely related to the energy use intensity. In addition, using analytical results and residual plots, variables were assessed using different transformations (such as the natural logarithm, abbreviated as Ln). Overall, the analysis consists of multiple regression formulations, structured to find the combination of statistically significant operating characteristics that explained the greatest amount of variance in the dependent variable: source EUI.
The final regression equation includes the following variables:
- Gross floor area, capped at 2500m2 (GFA Cap)
- Weekly operating hours (Hours)
- Annual quantity of mail products per 100m2 (Mail Density)
- The percentage of the building that is cooled times the number of Cooling Degree Days
(Percent Cooled x CDD) - The percentage of the building that is heated times the number of Heating Degree Days
(Percent Heated x HDD) - Number of workers per 100m2 (Worker Density)
These variables are used together to compute the predicted source EUI for Mailing Centers/Post Offices. The predicted source EUI is the mean EUI for a hypothetical population of buildings that share the same values for each of these characteristics. It is the mean energy for buildings that operate like your building.
Mail Density
Mail density is an important term used to capture the intensity of activity within the building. Annual mail volumes were chosen to account for seasonal differences such as mail volume around holidays. The different types of mail (such as letter, packet, package, etc.) were analysed to ensure that certain mail types did not contribute to more or less energy consumption.
Gross Floor Area
In the dataset, there existed a strong trend towards larger buildings using less energy per meter square when considering climate and business activity. The effect was present in buildings up to 2500 m2, after which increasing size did not have an impact on energy intensity. Therefore, the final regression equation includes a gross floor area term, which is capped at a maximum value of 2500 m2. This means that buildings over 2500 m2 will receive the same adjustment as those with an area of 2500 m2.
Cooling Degree Days
Due to the limited variance of CDD within a single sample year, and the complex relationship between HDD and CDD in different climate regions in Canada, NRCan had concerns that the impact of cooling was not being fully represented in the model. To adjust, NRCan used a combination of analysis techniques, including linear regression of EUI and Percent Cooled x CDD in the survey data, review of engineering models, and comparisons to Portfolio Manager data, to determine an appropriate factor to account for cooling energy. From the analysis, the rate of increase of source energy to Percent Cooled x CDD was determined. Applying this adjustment resulted in a more comprehensive model with both cooling and heating terms that is better adapted to changing climate trends.
Testing
NRCan further analyzed the regression equation using actual data entered in Portfolio Manager. In addition to the regression dataset, this analysis provided another set of buildings to examine the ENERGY STAR scores and distributions to assess the impacts and adjustments. It also confirmed that there are minimal biases when it comes to fundamental operational characteristics, and that there was no regional bias or bias for the type of energy used for heating.
It is important to reiterate that the final regression equation is based on the nationally representative reference data from CPC, not on other user data previously entered into Portfolio Manager. While the reference data is from public post office data, the corresponding score is also applicable to private buildings with mail delivery.
Regression equation results
The final regression is a weighted ordinary least squares regression across the filtered data set of 222 observations. The dependent variable is source EUI. Each independent variable is centred relative to the weighted mean value, presented in Figure 2. The final equation is presented in Figure 3. All variables in the regression equation are considered significant at a 90% confidence level or better, as shown by their respective significance levels.
The regression equation has a coefficient of determination (R2) value of 0.3196, indicating that this equation explains 31.96% of the variance in source EUI for office buildings. Because the final equation is structured with energy per unit area as the dependent variable, the explanatory power of the area is not included in the R2 value, and thus this value appears artificially low. Recomputing the R2 value in units of source energyFootnote 2 demonstrates that the equation actually explains 80.4% of the variation in total source energy of Mailing Centers/Post Offices. It is a good result for a statistically based energy model.
For detailed information on the ordinary least squares regression approach, go to the Technical Reference for the ENERGY STAR Score (PDF, 709 KB).
| Variable | Minimum | Median | Maximum | Mean |
|---|---|---|---|---|
| Source energy per square metre (GJ/m2) | 0.5762 | 1.464 | 3.074 | 1.482 |
| GFA Cap* | 265.5 | 1417 | 2,500 | 1518 |
| Hours | 35.00 | 77.50 | 148.0 | 81.46 |
| Mail Density | 41,754 | 261,705 | 863,010 | 324,589 |
| Percent Cooled x CDD | 15.00 | 252.0 | 638.0 | 262.7 |
| Percent Heated x HDD | 2751 | 3912 | 7312 | 4058 |
| Worker Density | 0.2923 | 1.914 | 11.06 | 2.307 |
| *GFA Cap is capped at 2500 | ||||
Figure 3 – Final Regression Results
| Dependent variable | Source energy use intensity (GJ/m2) |
|---|---|
| Number of observations in analysis | 222 |
| R2 value | 0.3196 |
| Adjusted R2 value | 0.3039 |
| F statistic | 20.30 |
| Significance (p-level) | < 0.0001 |
| Dependent variable | Unstandardized Coefficients | Standard Error | T Value | Significance (p-level) |
|---|---|---|---|---|
| Constant | 1.482 | 2.471E-02 | 60.00 | <.0001 |
| GFA Cap* | -1.977E-04 | 4.266E-05 | -4.634 | <.0001 |
| Hours | 3.109E-03 | 9.456E-04 | 3.287 | 0.0012 |
| Mail Density | 2.479E-07 | 1.419E-07 | 1.748 | 0.0819 |
| Percent Cooled x CDD | 2.000E-04 | n/a | n/a | n/a |
| Percent Heated x HDD | 2.455E-04 | 3.183E-05 | 7.713 | <.0001 |
| Worker Density | 4.491E-02 | 1.710E-02 | 2.627 | 0.0092 |
Notes:
|
||||
Energy star score lookup table
The final regression equation (presented in Figure 3) gives a prediction of source EUI based on a building’s operating characteristics. Some buildings in the SCIEU data sample use more energy than predicted by the regression equation, while others use less. The actual source EUI of each reference data observation is divided by its predicted source EUI to calculate an energy efficiency ratio:
An efficiency ratio lower than one indicates that a building uses less energy than predicted, and consequently is more efficient. A higher efficiency ratio indicates the opposite.
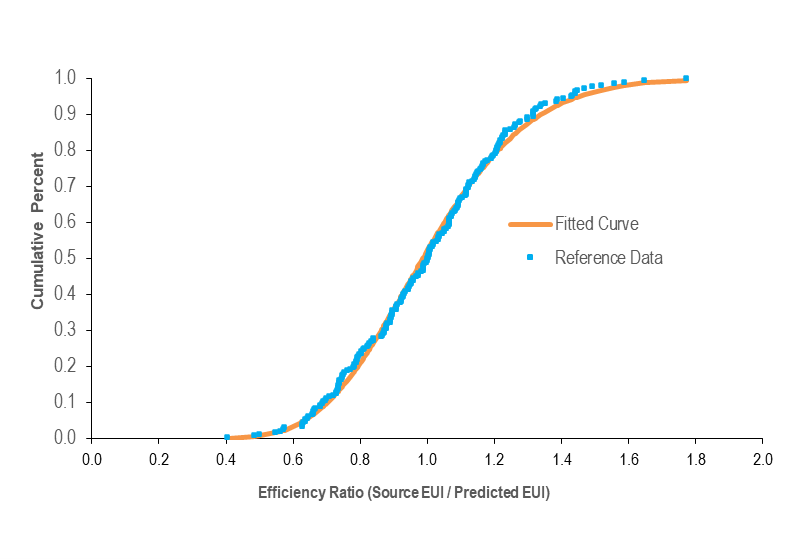
The efficiency ratios are sorted from smallest to largest, and the cumulative percent of the population at each ratio is computed using the individual observation weights from the reference data set. Figure 4 presents a plot of this cumulative distribution. A smooth curve (shown in orange) is fitted to the data using a two-parameter gamma distribution. The fit is performed to minimize the sum of squared differences between each building’s actual percent rank in the population and each building’s percent rank with the gamma solution. The final fit for the gamma curve gives a shape parameter (alpha) of 16.10 and a scale parameter (beta) of 0.06259. The sum of the squared error for this fit is 0.03073.
Figure 4 – Distribution for Mailing Centers/Post Offices
The final gamma shape and scale parameters are used to calculate the efficiency ratio at each percentile (1 to 100) along the curve. For example, the ratio on the gamma curve at 1% corresponds to a score of 99; only 1% of the population registers such a small or even smaller ratio. The ratio on the gamma curve at the value of 25% corresponds to the ratio for a score of 75; only 25% of the population registers such a small or even smaller ratio. Figure 5 shows the complete score lookup table.
Figure 5 – ENERGY STAR Score Lookup Table for Mailing Centers/Post Offices
| ENERGY STAR Score | Cumulative Percent | Energy Efficiency Ratio | |
|---|---|---|---|
| > = | < | ||
| 100 | 0% | 0.0000 | 0.5163 |
| 99 | 1% | 0.5163 | 0.5610 |
| 98 | 2% | 0.5610 | 0.5907 |
| 97 | 3% | 0.5907 | 0.6137 |
| 96 | 4% | 0.6137 | 0.6329 |
| 95 | 5% | 0.6329 | 0.6496 |
| 94 | 6% | 0.6496 | 0.6644 |
| 93 | 7% | 0.6644 | 0.6779 |
| 92 | 8% | 0.6779 | 0.6904 |
| 91 | 9% | 0.6904 | 0.7020 |
| 90 | 10% | 0.7020 | 0.7129 |
| 89 | 11% | 0.7129 | 0.7232 |
| 88 | 12% | 0.7232 | 0.7330 |
| 87 | 13% | 0.7330 | 0.7424 |
| 86 | 14% | 0.7424 | 0.7514 |
| 85 | 15% | 0.7514 | 0.7601 |
| 84 | 16% | 0.7601 | 0.7685 |
| 83 | 17% | 0.7685 | 0.7767 |
| 82 | 18% | 0.7767 | 0.7846 |
| 81 | 19% | 0.7846 | 0.7923 |
| 80 | 20% | 0.7923 | 0.7999 |
| 79 | 21% | 0.7999 | 0.8073 |
| 78 | 22% | 0.8073 | 0.8145 |
| 77 | 23% | 0.8145 | 0.8217 |
| 76 | 24% | 0.8217 | 0.8287 |
| 75 | 25% | 0.8287 | 0.8355 |
| 74 | 26% | 0.8355 | 0.8423 |
| 73 | 27% | 0.8423 | 0.8490 |
| 72 | 28% | 0.8490 | 0.8557 |
| 71 | 29% | 0.8557 | 0.8622 |
| 70 | 30% | 0.8622 | 0.8687 |
| 69 | 31% | 0.8687 | 0.8751 |
| 68 | 32% | 0.8751 | 0.8815 |
| 67 | 33% | 0.8815 | 0.8878 |
| 66 | 34% | 0.8878 | 0.8941 |
| 65 | 35% | 0.8941 | 0.9004 |
| 64 | 36% | 0.9004 | 0.9066 |
| 63 | 37% | 0.9066 | 0.9128 |
| 62 | 38% | 0.9128 | 0.9190 |
| 61 | 39% | 0.9190 | 0.9251 |
| 60 | 40% | 0.9251 | 0.9313 |
| 59 | 41% | 0.9313 | 0.9374 |
| 58 | 42% | 0.9374 | 0.9435 |
| 57 | 43% | 0.9435 | 0.9497 |
| 56 | 44% | 0.9497 | 0.9558 |
| 55 | 45% | 0.9558 | 0.9619 |
| 54 | 46% | 0.9619 | 0.9681 |
| 53 | 47% | 0.9681 | 0.9742 |
| 52 | 48% | 0.9742 | 0.9804 |
| 51 | 49% | 0.9804 | 0.9866 |
| ENERGY STAR Score | Cumulative Percent | Energy Efficiency Ratio | |
|---|---|---|---|
| >= | < | ||
| 50 | 50% | 0.9866 | 0.9929 |
| 49 | 51% | 0.9929 | 0.9991 |
| 48 | 52% | 0.9991 | 1.0054 |
| 47 | 53% | 1.0054 | 1.0118 |
| 46 | 54% | 1.0118 | 1.0181 |
| 45 | 55% | 1.0181 | 1.0246 |
| 44 | 56% | 1.0246 | 1.0310 |
| 43 | 57% | 1.0310 | 1.0376 |
| 42 | 58% | 1.0376 | 1.0442 |
| 41 | 59% | 1.0442 | 1.0508 |
| 40 | 60% | 1.0508 | 1.0576 |
| 39 | 61% | 1.0576 | 1.0644 |
| 38 | 62% | 1.0644 | 1.0713 |
| 37 | 63% | 1.0713 | 1.0783 |
| 36 | 64% | 1.0783 | 1.0853 |
| 35 | 65% | 1.0853 | 1.0925 |
| 34 | 66% | 1.0925 | 1.0998 |
| 33 | 67% | 1.0998 | 1.1073 |
| 32 | 68% | 1.1073 | 1.1148 |
| 31 | 69% | 1.1148 | 1.1225 |
| 30 | 70% | 1.1225 | 1.1304 |
| 29 | 71% | 1.1304 | 1.1384 |
| 28 | 72% | 1.1384 | 1.1466 |
| 27 | 73% | 1.1466 | 1.1550 |
| 26 | 74% | 1.1550 | 1.1636 |
| 25 | 75% | 1.1636 | 1.1724 |
| 24 | 76% | 1.1724 | 1.1815 |
| 23 | 77% | 1.1815 | 1.1908 |
| 22 | 78% | 1.1908 | 1.2004 |
| 21 | 79% | 1.2004 | 1.2104 |
| 20 | 80% | 1.2104 | 1.2207 |
| 19 | 81% | 1.2207 | 1.2315 |
| 18 | 82% | 1.2315 | 1.2427 |
| 17 | 83% | 1.2427 | 1.2543 |
| 16 | 84% | 1.2543 | 1.2666 |
| 15 | 85% | 1.2666 | 1.2795 |
| 14 | 86% | 1.2795 | 1.2931 |
| 13 | 87% | 1.2931 | 1.3075 |
| 12 | 88% | 1.3075 | 1.3230 |
| 11 | 89% | 1.3230 | 1.3396 |
| 10 | 90% | 1.3396 | 1.3577 |
| 9 | 91% | 1.3577 | 1.3775 |
| 8 | 92% | 1.3775 | 1.3994 |
| 7 | 93% | 1.3994 | 1.4242 |
| 6 | 94% | 1.4242 | 1.4529 |
| 5 | 95% | 1.4529 | 1.4870 |
| 4 | 96% | 1.4870 | 1.5296 |
| 3 | 97% | 1.5296 | 1.5875 |
| 2 | 98% | 1.5875 | 1.6816 |
| 1 | 99% | 1.6816 | >1.6816 |
Example calculation
According to the Technical Reference for the ENERGY STAR Score (PDF, 709 KB), there are five steps to compute a score for Mailing Centers/Post Offices. The following is an example:
1 User enters building data into Portfolio Manager
- 12 months of energy use information for all energy types (annual values, entered in monthly meter entries)
- Physical building information (size, location, etc.) and use details describing building activity (hours, etc.)
| Energy Data | Value |
|---|---|
| Electricity | 135,000 kWh |
| Natural gas | 12,000 m3 |
| Property Use Details | Value |
|---|---|
| Gross floor area (m2) | 1,000 |
| Weekly operating hours | 55 |
| Number of Workers on Main Shift | 60 |
| Number of letters and packages per year | 8,000,000 |
| Delivery Facility | Yes |
| Percent That Can Be Heated | 100% |
| Percent That Can Be Cooled | 100% |
| HDD (provided by Portfolio Manager, based on postal code) | 3,500 |
| CDD (provided by Portfolio Manager, based on postal code) | 300 |
2 Portfolio Manager computes the actual source EUI
- Total energy consumption for each fuel is converted from billing units into site energy and source energy.
- Source energy values are added across all fuel types.
- Source energy is divided by gross floor area to determine actual source EUI.
| Fuel | Billing Units | Site GJ Multiplier | Site GJ | Source Multiplier | Source GJ |
|---|---|---|---|---|---|
| Electricity | 135,000 kWh | 3.600E-03 | 486.0 | 1.830 | 889.4 |
| Natural gas | 12,000 m3 | 3.843E-02 | 461.2 | 1.060 | 488.9 |
| Total Source Energy (GJ) | 1,378 | ||||
| Source EUI (GJ/m2) | 1.378 | ||||
3 Portfolio Manager computes the predicted source EUI
- Using the property use details from Step 1, Portfolio Manager computes each building variable value in the regression equation (determining the density as necessary).
- The centering values are subtracted to compute the centered variable for each operating parameter.
- The centered variables are multiplied by the coefficients from the warehouse regression equation to obtain a predicted source EUI.
| Variable | Actual Building Value | Reference Centering Value | Building Centered Variable | Coefficient | Coefficient x Centered Variable | |
|---|---|---|---|---|---|---|
| Constant | - | - | - | 1.482 | 1.482 | |
| GFA Cap* | 1000 | 1518 | -518.0 | -1.977E-04 | 0.1024 | |
| Hours | 55 | 81.46 | -26.46 | 3.109E-03 | -8.226E-02 | |
| Mail Density | 800000 | 324589 | 475411 | 2.479E-07 | 0.1179 | |
| Percent Cooled x CDD | 300 | 262.7 | 37.30 | 2.000E-04 | 7.460E-03 | |
| Percent Heated x HDD | 3500 | 4058 | -558.0 | 2.455E-04 | -0.1370 | |
| Worker Density | 6 | 2.307 | 3.693 | 4.491E-02 | 0.1659 | |
| Predicted Source EUI (GJ/m2) | 1.656 | |||||
| *GFA capped at 2500 | ||||||
4 Portfolio Manager computes the energy efficiency ratio
- The ratio equals the actual source EUI (Step 2) divided by the predicted source EUI (Step 3).
- Ratio = 1.378 / 1.656 = 0.8321
5 Portfolio Manager uses the efficiency ratio to assign a score via a lookup table
- The ratio from Step 4 is used to identify the score from the lookup table.
- A ratio of 0.8321 is greater than 0.8287 and less than 0.8355.
- The ENERGY STAR score is 75.