

Technical Reference
Overview
The ENERGY STAR Score for Kindergarten through grade 12 (K-12) schools applies to both primary and secondary schools. This score is not applicable to college, cégep, or university classroom facilities and laboratories; vocational, technical or trade schools; or preschool or day care buildings. The objective of the ENERGY STAR score is to provide an unbiased fair assessment of the energy performance of a property, relative to its peers, taking into account the climate, weather, and business activities at the property. A statistical analysis of the peer building population is performed to identify the aspects of building activity that are significant drivers of energy use and then to normalize for those factors. The result of this analysis is an equation that predicts the energy use of a property based on its business activities. The energy use prediction for a building is compared to its actual energy use to yield a 1 to 100 percentile ranking of performance, relative to the national population.
- Property Types. The ENERGY STAR score for schools applies to primary and secondary schools, from kindergarten to grade 12. The score applies to an entire school whether it is a single building or a campus of buildings. Individual buildings that are part of larger K-12 campuses cannot receive their own score.
- Reference data. The analysis for schools in Canada is based on data from the Survey on Commercial and Institutional Energy Use (SCIEU), which was commissioned by Natural Resources Canada (NRCan) and carried out by Statistics Canada and represents the energy consumption year 2014.
- Adjustments for weather and business. The analysis includes adjustments for:
- Number of workers on the main shift
- Percentage of space dedicated to food preparation
- Weather and climate (using heating degree days and cooling degree days, retrieved based on postal code)
- Percentage of building that is cooled
- Release Date. This is the second release of the ENERGY STAR score for K-12 schools in Canada. The ENERGY STAR score for schools is updated periodically as more recent data becomes available:
- Most recent update: March 2019
- Original release: July 2013
This document presents details on the development of the 1 - 100 ENERGY STAR score for K-12 school properties. More information on the overall approach to develop ENERGY STAR scores is covered in our Technical Reference for the ENERGY STAR Score (PDF, 709 KB). The subsequent sections of this document offer specific details on the development of the ENERGY STAR score for K-12 schools:
- Overview
- Reference Data & Filters
- Variables Analyzed
- Regression Equation Results
- Energy star Score Lookup Table
- Example Calculation
Reference Data & Filters
The ENERGY STAR score for K-12 schools in Canada applies to primary and secondary schools, from kindergarten to grade 12. The reference data used to establish the peer building population is based on data from the Survey on Commercial and Institutional Energy Use (SCIEU), which was commissioned by Natural Resources Canada and carried out by Statistics Canada in late 2015 and early 2016. The consumption data for the survey was from the calendar year 2014. The raw collected data file for this survey is not publicly available, but a report providing summary results is available on Natural Resources Canada’s website, at Portfolio Manager.
To analyze the building energy and operating characteristics in this survey data, four types of filters are applied to define the peer group for comparison and to overcome any technical limitations in the data: Building Type Filters, Program Filters, Data Limitation Filters, and Analytical Filters. A complete description of each of these categories is provided in our Technical Reference for the ENERGY STAR Score (PDF, 709 KB). Figure 1 presents a summary of each filter applied in the development of the ENERGY STAR score for K-12 schools and the rationale behind the filter. After all filters are applied, the remaining data set has 277 observations. Due to the confidentiality of the survey data, we are not able to identify the number of cases after each filter.
| Condition for Including an Observation in the Analysis | Rationale |
|---|---|
| Defined as category 3 in SCIEU – Kindergarten to Grade 12 Schools | The SCIEU survey covered the commercial and institutional sector and included buildings of all types. For this model, only the observations identified as primarily K-12 schools are used. |
| Must have electricity consumption data | Program Filter – K-12 schools that do not use electric energy are rare or non-existent and may indicate an omission in energy data. Electricity can be grid-purchased or produced on site. |
| Building must be at least 50% K-12 School | Building Type Filter – To be considered part of the K-12 school peer group, the facility must have a minimum K-12 school space. |
| Excludes educational buildings that are “Other Only” | Building Type Filter – Buildings that consist of only ‘Other’ school type do not meet the definition of a school. |
| Building area must be at least 92.9 m2 | Program Filter – The analysis could not model behaviours for buildings smaller than 92.9 m2 (1,000 ft2). |
| Must operate at least 30 hours per week | Program Filter – Basic requirement to be considered as full-time operation. |
| Must operate at least 8 months per year | Program Filter – Basic requirement to be considered as full-time operation. |
| Must have at least 1 employee and 2 students | Program Filter – Basic requirement for a functioning school. It must be occupied. |
| Must be built in 2013 or earlier | Data Limitation Filter – The survey reported the consumption for calendar year 2014. Therefore, if the building was being built in 2014, a full year of consumption data would not be available. |
| Must not include energy supplied to other buildings | Data Limitation Filter – The survey asked whether the energy reported at the facility included energy supplied to other buildings such as a multi-building complex or portables. Usage data may not have been included, therefore these observations were removed. |
| Must not use any “other” fuels for which the consumption is not reported | Data Limitation Filter – The survey asked whether fuels other than purchased electricity, on-site generated electricity from renewable sources, natural gas, light fuel oil, diesel, kerosene, propane, district steam, district hot water or district chilled water were consumed in the facility. Either the type of energy was not defined, or in the case of wood, the energy was not easily convertible; therefore, the energy content of these fuels could not be directly compared. In these occurrences, these observations were removed from the analysis. |
| Must have at least 50% heated floor space | Analytical Filter – Observations less than or equal to 50% were not deemed realistic for the Canadian climate, which generally exceeds 2,000 HDD. |
| Must have Source EUI that is less than or equal to 3.2 GJ/m2 | Analytical Filter – Values determined to be outliers based on analysis of the data. Outliers are typically clearly outside normal operating parameters for a building of this type. |
| Must have a worker density (workers per 100 m2) that is less than or equal to 2.9 | Analytical Filter – Values determined to be outliers based on analysis of the data. Outliers are typically clearly outside normal operating parameters for a building of this type. |
| Must have a student seating capacity density (students per 100 m2) that is greater than or equal to 2.2 and less than or equal to 30 | Analytical Filter – Values determined to be outliers based on analysis of the data. Outliers are typically clearly outside normal operating parameters for a building of this type. |
Of the filters applied to the reference data, some are also eligibility requirements for calculating a score in Portfolio Manager. Building Type and Program Filters are used to limit the reference data to include only properties that are eligible to receive a score in Portfolio Manager, and are therefore related to eligibility requirements. In contrast, Data Limitation Filters account for limitations in the data availability, but do not apply in Portfolio Manager. Analytical Filters are used to eliminate outlier data points or different subsets of data, and may or may not affect eligibility. In some cases, a subset of the data has a different behaviour from the rest of the properties (e.g. office buildings smaller than 465 m2 do not behave the same way as larger buildings), in which case an Analytical Filter is used to determine eligibility in Portfolio Manager. In other cases, Analytical Filters exclude a small number of outliers with extreme values that skew the analysis, but do not affect eligibility requirements. A full description of the criteria you must meet to get a score in Portfolio Manager is available at Benchmarking - Frequently Asked Questions.
Related to the filters and eligibility criteria described above, another consideration is how Portfolio Manager treats properties that are situated on a campus. The main unit for benchmarking in Portfolio Manager is the property, which may be used to describe either a single building or a campus of buildings. The applicability of the ENERGY STAR score depends on the type of property. The ENERGY STAR score applies to an entire K-12 school, whether it is a single building or a campus of buildings. Schools may have multiple buildings that are all integral to the primary activity. One building might contain classes, a second, the gymnasium, and another might be a portable. In this case, the campus can get an ENERGY STAR score as long as the energy for all the buildings is metered and reported. For cases where all the activities are contained within one building, that school can get a building ENERGY STAR score.
Variables Analyzed
To normalize for differences in business activity, we performed a statistical analysis to understand what aspects of building activity are significant with respect to energy use. The filtered reference data set, described in the previous section, was analyzed using a weighted ordinary least squares regression, which evaluated energy use relative to business activity (e.g. operating hours per week, number of workers, floor area, and climate). This linear regression yielded an equation that is used to compute energy use (also called the dependent variable) based on a series of characteristics that describe the business activities (also called independent variables). This section details the variables used in the statistical analysis for K-12 schools in Canada.
Dependent Variable
The dependent variable is what we try to predict with the regression equation. For the K-12 school analysis, the dependent variable is energy consumption expressed in source energy use intensity (source EUI). This is equal to the total source energy use of the property divided by the gross floor area, including portables supplied by the main building. The regression analyzes the key drivers of source EUI—those factors that explain the variation in source energy use per square metre in K-12 schools. The units for source EUI in the Canadian model are gigajoules per square metre (GJ/m2).
Independent Variables
The SCIEU data contains numerous questions on building property operation which NRCan identified as potentially important for K-12 schools. Based on a review of the available variables in the SCIEU data, in accordance with the criteria for inclusion in Portfolio Manager,Footnote 1 NRCan initially analyzed the following variables in the regression analysis:
- Gross building area (m2)
- Heating degree days (HDD)
- Cooling degree days (CDD)
- Percentage of heated floor space
- Percentage of cooled floor space
- Floor space dedicated to food preparation
- Percentage of space dedicated to food preparation
- Presence of a gymnasium (Y/N)
- Floor space dedicated to gymnasium (m2)
- Presence of portable classroom(s) (Y/N)
- Presence of an indoor pool (Y/N)
- Weekend/After hours operation
- Weekly hours of operation
- Number of months in operation in 2014
- Number of workers on the main shift
- Number of registered students
- Number of occupants in the building
- Presence of a daycare (Y/N)
- Number of vending machines
- Whether the school is only a primary school
- Whether the school is a secondary school (a.k.a. high school)
NRCan, with the advice of the Environmental Protection Agency (EPA), performed an extensive review on all of these operational characteristics. In addition to reviewing each characteristic individually, characteristics were reviewed in combination with each other (e.g. Heating Degree Days times Percent Heated). As part of the analysis, some variables were reformatted to reflect the physical relationships of building components. For example, the number of workers on the main shift can be evaluated in a density format. The number of workers per square metre (as opposed to the gross number of workers) could be expected to be correlated with the energy use per square metre. Also, based on analytical results and residual plots, variables were examined using different transformations (such as the natural logarithm, abbreviated as Ln). The analysis consists of multiple regression formulations. These analyses were structured to find the combination of statistically significant operating characteristics that explained the greatest amount of variance in the dependent variable: source EUI.
The final regression equation includes the following variables:
- Worker Density
- Percentage of Area Used for Food Preparation
- Heating Degree Days (HDD)
- Cooling Degree Days times Percent Cooled
These variables are used together to compute the predicted source EUI for K-12 schools. The predicted source EUI is the mean EUI for a hypothetical population of buildings that share the same values for each of these characteristics. That is, the mean energy for buildings that operate like your building.
Secondary School Variable
In the previous model based on 2009 data, identifying as Secondary School (as opposed to a Primary School) contributed to a higher EUI, and was statistically significant in the model. In the current model based on 2014 data, the relationship between Secondary Schools and higher EUI is much less pronounced, and the relationship is not statistically significant. Analysis indicates that between 2009 and 2014, the difference in the energy intensity between Primary Schools and Secondary Schools narrowed; Primary Schools increased in energy intensity while Secondary Schools remained similar to 2009 values.
Worker, Student, and Computer Density Analysis
All three variables were analyzed to determine their suitability as predictors for building EUI, and all three showed a positive correlation. However, worker density was chosen as the predictor due to its strong correlation and ability to explain variances in student density and computer density.
Testing
Finally, NRCan further analyzed the regression equation using actual schools that have been entered in Portfolio Manager. This provided another set of buildings to examine, in addition to the SCIEU data, to see the average ENERGY STAR scores and distributions, and to assess the corresponding impacts and adjustments. This analysis on a separate data set provided a second level of verification to ensure that there was a homogenous distribution of scores with regard to region or to the type of energy used for heating.
It is important to reiterate that the final regression equation is based on the nationally representative reference data, not on data previously entered into Portfolio Manager.
Regression equation results
The final regression is a weighted ordinary least squares regression across the filtered data set of 277 observations. The dependent variable is source EUI. Each independent variable is centred relative to the mean value, presented in Figure 2. The final equation is presented in Figure 3. All variables in the regression equation are significant at the 90% confidence level or better.
The regression equation has a coefficient of determination (R2) value of 0.245, indicating that this equation explains 24.51% of the variance in source EUI for K-12 school buildings. Because the final equation is structured with energy per unit area as the dependent variable, the explanatory power of the area is not included in the R2 value, and thus this value appears artificially low. Re-computing the R2 value in units of source energyFootnote 2 demonstrates that the equation actually explains 93.7% of the variation in total source energy of K-12 schools. This is a good result for a statistically based energy model.
Detailed information on the ordinary least squares regression approach is available in our Technical Reference for the ENERGY STAR Score (PDF, 709 KB).
| Variable | Minimum | Median | Maximum | Mean |
|---|---|---|---|---|
| Source Energy per Square Metre (GJ/m2) | 0.352 | 1.061 | 3.055 | 1.110 |
| Worker Density | 0.202 | 0.854 | 2.803 | 0.904 |
| Percentage of Area Used for Food Preparation | 0 | 0 | 0.1370 | 0.003 |
| Heating Degree Days (HDD) | 2,718 | 4,616 | 7,053 | 4,735 |
| Cooling Degree Days times Percent Cooled | 0 | 26.31 | 344.1 | 72.40 |
Figure 3 – Final Regression Results
| Dependent variable | Source Energy Intensity (GJ/m2) | |||
|---|---|---|---|---|
| Number of observations in analysis | 277 | |||
| R2 value | 0.245 | |||
| Adjusted R2 value | 0.234 | |||
| F statistic | 22.07 | |||
| Significance (p-level) | <0.0001 | |||
| Dependent variable | Unstandardized Coefficients | Standard Error | T Value | Significance (p-level) |
|---|---|---|---|---|
| Constant | 1.110 | 0.0209 | 52.99 | <.0001 |
| Worker Density | 0.0969 | 0.05134 | 1.89 | 0.0601 |
| Percentage of Area Used for Food Preparation | 8.555 | 1.813 | 4.72 | <.0001 |
| Heating Degree Days (HDD) | 1.866E-04 | 2.252E-05 | 8.26 | <.0001 |
Cooling Degree Days times Percent Cooled |
5.984E-04 | 2.297E-04 | 2.6 | 0.0097 |
Notes:
|
||||
Energy Star Score Lookup Table
The final regression equation (presented in Figure 3) yields a prediction of source EUI based on a building’s operating characteristics. Some buildings in the SCIEU data sample use more energy than predicted by the regression equation, while others use less. The actual source EUI of each reference data observation is divided by its predicted source EUI to calculate an energy efficiency ratio:
A lower efficiency ratio indicates that a building uses less energy than predicted, and consequently is more efficient. A higher efficiency ratio indicates the opposite.
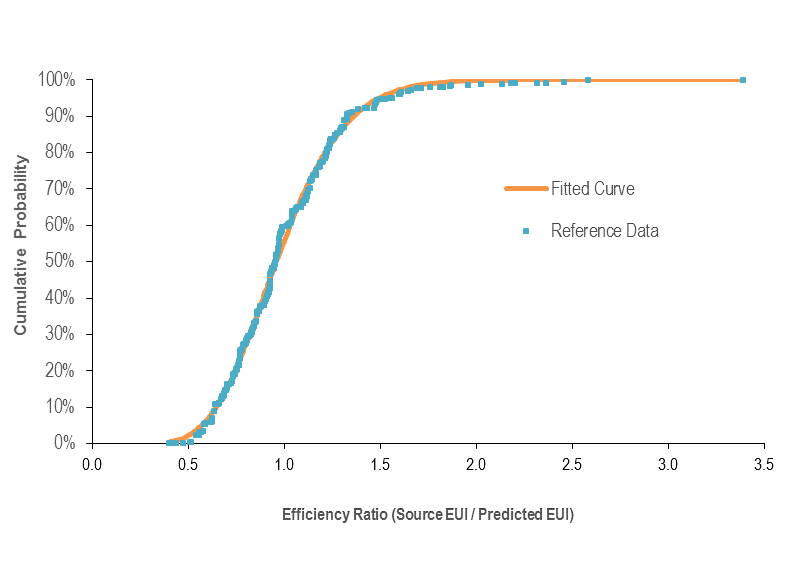
The efficiency ratios are sorted from smallest to largest, and the cumulative percent of the population at each ratio is computed using the individual observation weights from the reference data set. Figure 4 presents a plot of this cumulative distribution. A smooth curve (shown in orange) is fitted to the data using a two-parameter gamma distribution. The fit is performed in order to minimize the sum of squared differences between each building’s actual percent rank in the population and each building’s percent rank with the gamma solution. The final fit for the gamma curve yielded a shape parameter (alpha) of 11.8577 and a scale parameter (beta) of 0.08307. For this fit, the sum of the squared error is 0.0624.
Figure 4 – Distribution for K-12 Schools
The final gamma shape and scale parameters are used to calculate the efficiency ratio at each percentile (1 to 100) along the curve. For example, the ratio on the gamma curve at 1% corresponds to a score of 99; only 1% of the population has a ratio this small or smaller. The ratio on the gamma curve at the value of 25% corresponds to the ratio for a score of 75; only 25% of the population has a ratio this small or smaller. The complete score lookup table is presented in Figure 5.
Figure 5 – ENERGY STAR Score Lookup Table for K-12 Schools
| ENERGY STAR Score | Cumulative Percent | Energy Efficiency Ratio | |
|---|---|---|---|
| > = | < | ||
| 100 | 0% | 0.0000 | 0.4431 |
| 99 | 1% | 0.4431 | 0.4898 |
| 98 | 2% | 0.4898 | 0.5211 |
| 97 | 3% | 0.5211 | 0.5457 |
| 96 | 4% | 0.5457 | 0.5662 |
| 95 | 5% | 0.5662 | 0.5841 |
| 94 | 6% | 0.5841 | 0.6001 |
| 93 | 7% | 0.6001 | 0.6147 |
| 92 | 8% | 0.6147 | 0.6282 |
| 91 | 9% | 0.6282 | 0.6408 |
| 90 | 10% | 0.6408 | 0.6526 |
| 89 | 11% | 0.6526 | 0.6639 |
| 88 | 12% | 0.6639 | 0.6746 |
| 87 | 13% | 0.6746 | 0.6848 |
| 86 | 14% | 0.6848 | 0.6947 |
| 85 | 15% | 0.6947 | 0.7043 |
| 84 | 16% | 0.7043 | 0.7135 |
| 83 | 17% | 0.7135 | 0.7225 |
| 82 | 18% | 0.7225 | 0.7313 |
| 81 | 19% | 0.7313 | 0.7398 |
| 80 | 20% | 0.7398 | 0.7482 |
| 79 | 21% | 0.7482 | 0.7563 |
| 78 | 22% | 0.7563 | 0.7644 |
| 77 | 23% | 0.7644 | 0.7723 |
| 76 | 24% | 0.7723 | 0.7800 |
| 75 | 25% | 0.7800 | 0.7877 |
| 74 | 26% | 0.7877 | 0.7952 |
| 73 | 27% | 0.7952 | 0.8027 |
| 72 | 28% | 0.8027 | 0.8101 |
| 71 | 29% | 0.8101 | 0.8174 |
| 70 | 30% | 0.8174 | 0.8246 |
| 69 | 31% | 0.8246 | 0.8318 |
| 68 | 32% | 0.8318 | 0.8390 |
| 67 | 33% | 0.8390 | 0.8460 |
| 66 | 34% | 0.8460 | 0.8531 |
| 65 | 35% | 0.8531 | 0.8601 |
| 64 | 36% | 0.8601 | 0.8671 |
| 63 | 37% | 0.8671 | 0.8740 |
| 62 | 38% | 0.8740 | 0.8810 |
| 61 | 39% | 0.8810 | 0.8879 |
| 60 | 40% | 0.8879 | 0.8948 |
| 59 | 41% | 0.8949 | 0.9017 |
| 58 | 42% | 0.9017 | 0.9087 |
| 57 | 43% | 0.9087 | 0.9156 |
| 56 | 44% | 0.9156 | 0.9225 |
| 55 | 45% | 0.9225 | 0.9294 |
| 54 | 46% | 0.9294 | 0.9364 |
| 53 | 47% | 0.9364 | 0.9434 |
| 52 | 48% | 0.9434 | 0.9504 |
| 51 | 49% | 0.9504 | 0.9574 |
| ENERGY STAR Score | Cumulative Percent | Energy Efficiency Ratio | |
|---|---|---|---|
| >= | < | ||
| 50 | 50% | 0.9574 | 0.9645 |
| 49 | 51% | 0.9645 | 0.9716 |
| 48 | 52% | 0.9716 | 0.9788 |
| 47 | 53% | 0.9788 | 0.9860 |
| 46 | 54% | 0.9860 | 0.9932 |
| 45 | 55% | 0.9932 | 1.0005 |
| 44 | 56% | 1.0005 | 1.0079 |
| 43 | 57% | 1.0079 | 1.0154 |
| 42 | 58% | 1.0154 | 1.0229 |
| 41 | 59% | 1.0229 | 1.0305 |
| 40 | 60% | 1.0305 | 1.0382 |
| 39 | 61% | 1.0382 | 1.0460 |
| 38 | 62% | 1.0460 | 1.0539 |
| 37 | 63% | 1.0539 | 1.0619 |
| 36 | 64% | 1.0619 | 1.0700 |
| 35 | 65% | 1.0700 | 1.0782 |
| 34 | 66% | 1.0782 | 1.0866 |
| 33 | 67% | 1.0866 | 1.0951 |
| 32 | 68% | 1.0951 | 1.1038 |
| 31 | 69% | 1.1038 | 1.1126 |
| 30 | 70% | 1.1126 | 1.1217 |
| 29 | 71% | 1.1217 | 1.1309 |
| 28 | 72% | 1.1309 | 1.1404 |
| 27 | 73% | 1.1404 | 1.1500 |
| 26 | 74% | 1.1500 | 1.1599 |
| 25 | 75% | 1.1599 | 1.1701 |
| 24 | 76% | 1.1701 | 1.1806 |
| 23 | 77% | 1.1806 | 1.1914 |
| 22 | 78% | 1.1914 | 1.2026 |
| 21 | 79% | 1.2026 | 1.2142 |
| 20 | 80% | 1.2142 | 1.2261 |
| 19 | 81% | 1.2261 | 1.2386 |
| 18 | 82% | 1.2386 | 1.2516 |
| 17 | 83% | 1.2516 | 1.2652 |
| 16 | 84% | 1.2652 | 1.2794 |
| 15 | 85% | 1.2794 | 1.2944 |
| 14 | 86% | 1.2944 | 1.3103 |
| 13 | 87% | 1.3103 | 1.3272 |
| 12 | 88% | 1.3272 | 1.3452 |
| 11 | 89% | 1.3452 | 1.3647 |
| 10 | 90% | 1.3647 | 1.3858 |
| 9 | 91% | 1.3858 | 1.4090 |
| 8 | 92% | 1.4090 | 1.4348 |
| 7 | 93% | 1.4348 | 1.4640 |
| 6 | 94% | 1.4640 | 1.4978 |
| 5 | 95% | 1.4978 | 1.5380 |
| 4 | 96% | 1.5380 | 1.5885 |
| 3 | 97% | 1.5885 | 1.6572 |
| 2 | 98% | 1.6572 | 1.7693 |
| 1 | 99% | 1.7693 | >1.7693 |
Example Calculation
As detailed in the Technical Reference for the ENERGY STAR Score (PDF, 709 KB), there are five steps to compute a score. The following is a specific example for the score for K-12 schools:
1 User enters building data into Portfolio Manager
- 12 months of energy use information for all energy types (annual values, provided from monthly meter readings)
- Physical building information (size, location, etc.) and use details describing building activity (hours, etc.)
| Energy Data | Value |
|---|---|
| Electricity | 780,000 kWh |
| Natural gas | 12,000 m3 |
| Property Use Details | Value |
|---|---|
| Gross Floor Area (m2) | 7,000 |
| Gross Floor Area Used for Food Preparation (m2) | 80 |
| Number of Workers on Main ShiftFootnote 3 | 75 |
| Percent that Can Be Cooled | 90 |
| HDD (provided by Portfolio Manager, based on postal code) | 3,601 |
| CDD (provided by Portfolio Manager, based on postal code) | 322 |
2 Portfolio Manager computes the actual source EUI
- Total energy consumption for each fuel is converted from billing units into site energy and source energy
- Source energy values are added across all fuel types
- Source energy is divided by gross floor area to determine actual source EUI
| Fuel | Billing Units | Site GJ Multiplier | Site GJ | Source Multiplier | Source GJ |
|---|---|---|---|---|---|
| Electricity | 780,000 kWh | 0.0036 | 2,808 | 1.83 | 5,138.64 |
| Natural gas | 12,000 m3 | 0.03843 | 461.16 | 1.06 | 488.82 |
| Total Source Energy (GJ) | 5,627.51 | ||||
| Actual Source EUI (GJ/m2) | 0.804 | ||||
3 Portfolio Manager computes the predicted source EUI
- Using the property use details from Step 1, Portfolio Manager computes each building variable value in the regression equation (determining the density as necessary).
- The centering values are subtracted to compute the centred variable for each operating parameter.
- The centred variables are multiplied by the coefficients from the K-12 school regression equation to obtain a predicted source EUI.
| Variable | Actual Building Value | Reference Centering Value | Building Centred Variable | Coefficient | Coefficient x Centred Variable |
|---|---|---|---|---|---|
| Constant | - | - | - | 1.11 | 1.110 |
| Cooling Degree Days x Percent Cooled | 289.8 | 72.40 | 217.40 | 5.984E-04 | 0.1301 |
| Heating Degree Days | 3,601 | 4,735 | -1,134 | 1.859E-04 | -0.2108 |
| Worker Density | 1.0714 | 0.9040 | 0.1674 | 0.0969 | 0.01623 |
| Percent Food Preparation | 0.0114 | 0.003 | 0.0084 | 8.555 | 0.07186 |
| Predicted Source EUI (GJ/m2) | 1.117 | ||||
4 Portfolio Manager computes the energy efficiency ratio
- The ratio equals the actual source EUI (Step 2) divided by the predicted source EUI (Step 3).
- Ratio = 0.804 / 1.117= 0.7198.
5 Portfolio Manager uses the efficiency ratio to assign a score via a lookup table
- The ratio from Step 4 is used to identify the score from the lookup table.
- A ratio of 0.7198 is greater than 0.7135 and less than 0.7225.
- The ENERGY STAR score is 83.