
Statement outlining results, risks and significant changes in operations, personnel and programs
1. Introduction
This quarterly financial report should be read in conjunction with the Main Estimates and any Supplementary Estimates approved in a given year by the date of this report. It has been prepared by management as required by section 65.1 of the Financial Administration Act and in the form and manner prescribed by Treasury Board (TB). This quarterly financial report has not been subject to an external audit or review.
1.1 Authority, Mandate and Programs
Natural Resources Canada (NRCan) works to improve the quality of life of Canadians by ensuring that our natural resources are developed sustainably, providing a source of jobs, prosperity, and opportunity, while preserving our environment and respecting our communities and Indigenous peoples.
Further details on NRCan’s authority, mandate and programs can be found in Part II of the Main Estimates.
1.2 Basis of Presentation
This quarterly financial report has been prepared by management using an expenditure basis of accounting. The accompanying Statement of Authorities includes NRCan’s spending authorities granted by Parliament, and those used by NRCan are consistent with the Main Estimates and Supplementary Estimates (A) and (B) for the 2024-2025 fiscal year, as well as budget adjustments approved by TB up to December 31, 2024. This quarterly report has been prepared using a special purpose financial reporting framework designed to meet financial information needs with respect to the use of spending authorities.
The authority of Parliament is required before money can be spent by the Government. Approvals are given in the form of annually approved limits through appropriation acts, or through legislation in the form of statutory spending authority for specific purposes.
NRCan uses the full accrual method of accounting to prepare and present its annual unaudited departmental financial statements that are part of the departmental results reporting process; however, the spending authorities voted by Parliament remain on an expenditure basis.
2. Highlights of Fiscal Quarter and Fiscal Year-to-Date Results
This Departmental Quarterly Financial Report reflects the results as of December 31, 2024, which include Main Estimates, Supplementary Estimates (A) and (B) for which full supply was released, as well as TB approved adjustments. The details presented in this report focus on and compare the third quarter results of 2024-2025 with those of 2023-2024.
2.1 Authorities
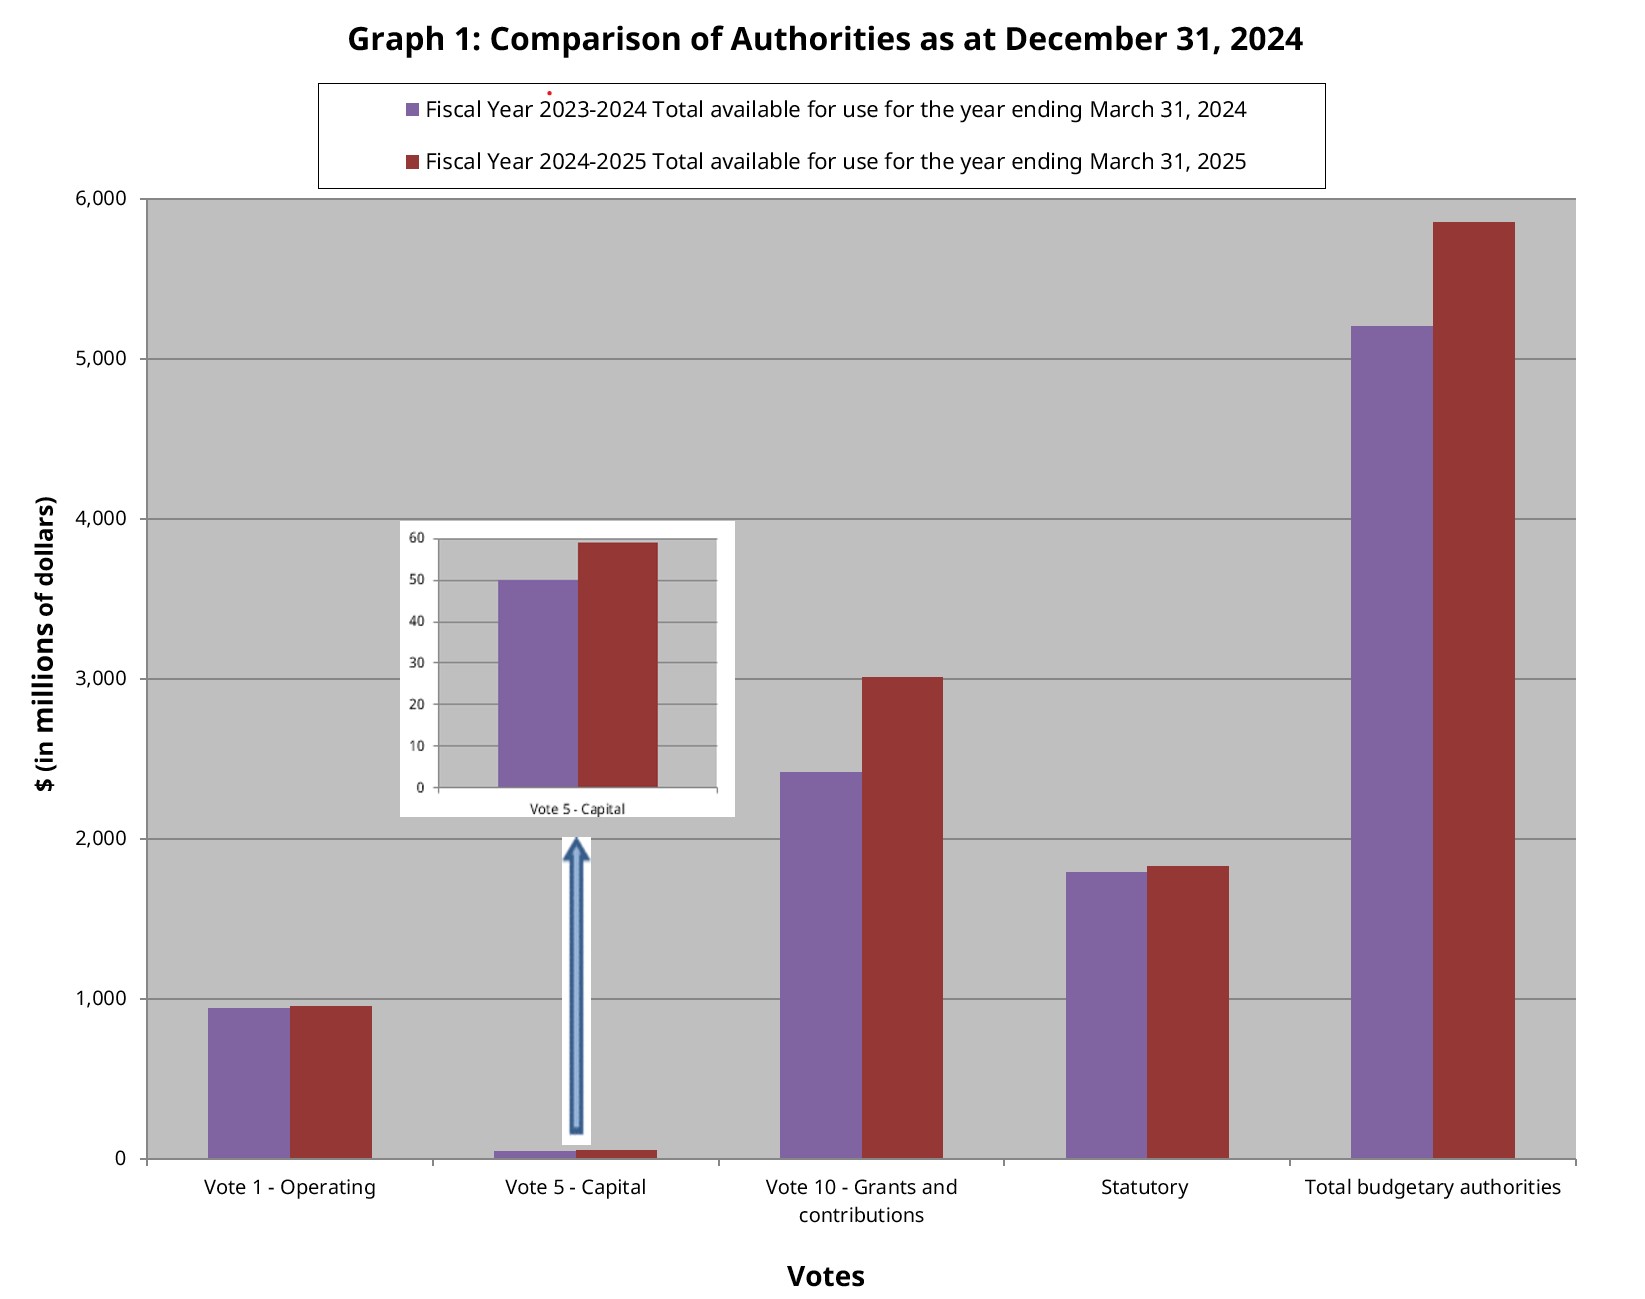
As per Table 1, presented at the end of this document, and on Graph 1 below, as at December 31, 2024, NRCan has authorities available for use of $5,860.2M compared to $5,207.9M in 2023-2024, for a net increase of $652.3M or 12.5%.
Text version
| (in millions of dollars) | Fiscal Year 2023-2024 Total available for use for the year ending March 31, 2024 |
Fiscal Year 2024-2025 Total available for use for the year ending March 31, 2025 |
|---|---|---|
| Vote 1 - Operating | 944 | 957 |
| Vote 5 - Capital | 50 | 59 |
| Vote 10 - Grants and contributions | 2,422 | 3,011 |
| Statutory | 1,792 | 1,832 |
| Total budgetary authorities | 5,208 | 5,860 |
The increase of $652.3M in authorities in 2024-2025 compared to 2023-2024 is mainly explained by the increase within the Vote 10 grants and contributions as well as the net effect of smaller fluctuations within Vote 1 operating expenditures, Vote 5 capital expenditures and Statutory authorities, as per the following:
| Total available for use for the year ending March 31, 2024 | 5,207,861 |
|---|---|
| Vote 1 - Operating | |
| The Sustainable Advancement of Canada's Forest Economy | 10,831 |
| UNCLOS - Extended Continental Shelf | 10,274 |
| B2023 Refocusing Government Spending | (28,304) |
| Natural Climate Solution Fund - 2 Billion Trees | (10,328) |
| Decrease in Collective Bargaining Agreements | (12,539) |
| All other net increases less than $10M individually | 42,819 |
| Sub-total Vote 1 - Operating | 12,753 |
| Vote 5 - Capital | |
| Polar Continental Shelf Program | (3,547) |
| All other net increases less than $3M individually | 12,628 |
| Sub-total Vote 5 - Capital | 9,081 |
| Vote 10 - Grants & Contributions | |
| Oil to Heat Pump Affordability Program | 131,429 |
| Natural Climate Solution Fund - 2 Billion Trees | 55,500 |
| Decarbonization of On-road Transportation - Deep Retrofit Accelerator | 42,000 |
| National Adaptation Strategy - Wildfire Resilient Futures Initiative | 36,900 |
| The Sustainable Advancement of Canada's Forest Economy | 33,663 |
| Emissions Reduction Plan (ERP) - Green Industrial Facilities and Manufacturing Program | 24,000 |
| Fighting and Managing Wildfires in a Changing Climate | 23,000 |
| Critical Minerals | 10,616 |
| Decarbonization of On-road Transportation - Zero-Emission Vehicle Infrastructure Program | (41,303) |
| Greener Homes | (48,376) |
| All other net increases less than $20M individually | 322,443 |
| Sub-total Vote 10 - Grants & Contributions | 589,872 |
| Statutory | |
| Newfoundland Offshore Petroleum Resources Revenue Fund (Forecasts are revised annually based on projected oil & natural gas production levels, prices, exchange rates and operator's costs) | 42,533 |
| All other net decreases | (1,952) |
| Sub-total Statutory | 40,581 |
| Total increase from previous year due to year-over-year changes | 652,287 |
| Total available for use for the year ending March 31, 2025 | 5,860,148 |
2.2 Budgetary Expenditures by Standard Object
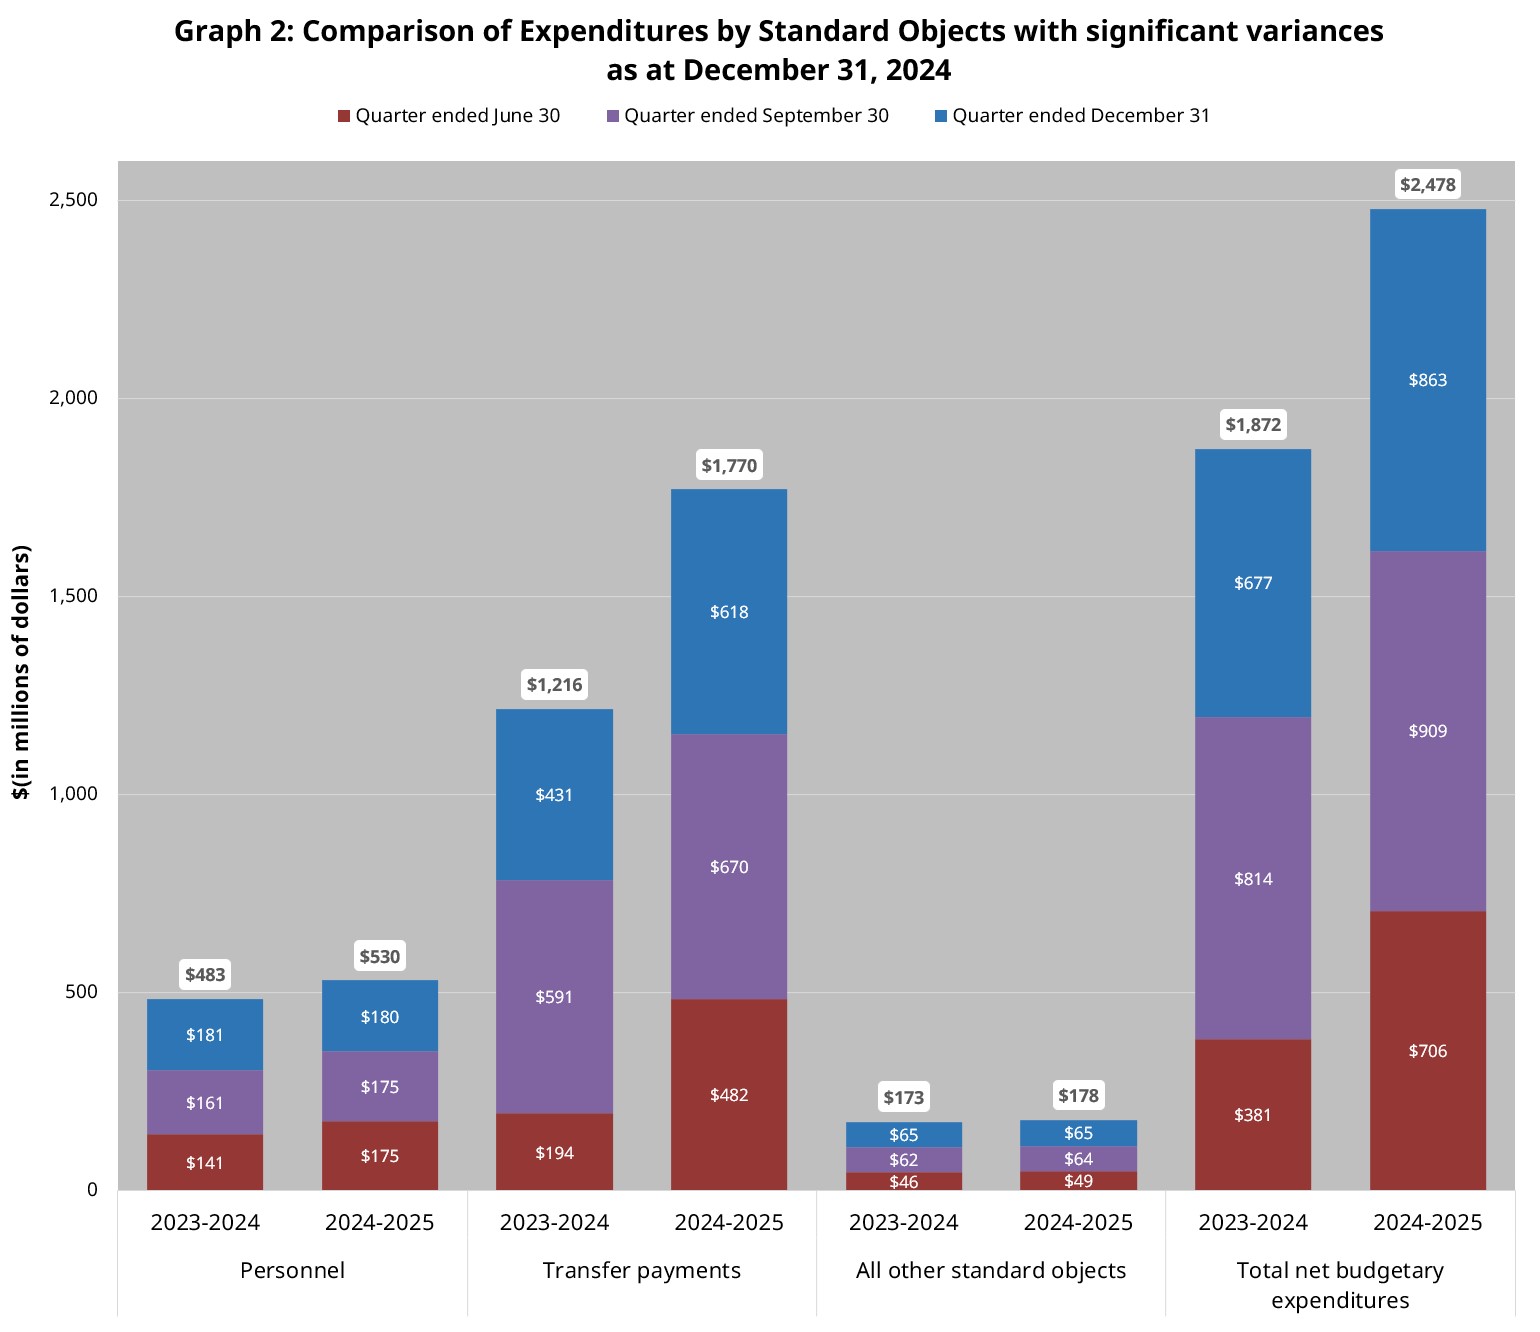
The spending for the quarter ending December 31, 2024 amounts to $863.3M or 14.7% of total funding available for the fiscal year, compared to $676.6M or 13.0% for the same quarter last year. The increase of $186.8M in spending is mainly related to an increase in expenditures for transfer payments and personnel in 2024-2025 compared to the same type of expenditures in 2023-2024. Year-to-date spending at the quarter ending December 31, 2024 amounts to $2,478.4M or 42.3% of total funding available for the fiscal year, compared to $1,872.2M or 36.0% for the same period last year. Further analysis has been done on standard objects with significant expenses, as noted in Graph 2 below. Table 2 at the end of this document presents the spending for all standard objects.
Text version
| (in millions of dollars) | Quarter ended June 30 | Quarter ended September 30 | Quarter ended December 31 | Spent YTD | ||
|---|---|---|---|---|---|---|
| Personnel | 2023 -2024 | 141 | 161 | 181 | 483 | |
| 2024-2025 | 175 | 175 | 180 | 530 | ||
| Transfer payments | 2023-2024 | 194 | 591 | 431 | 1,216 | |
| 2024-2025 | 482 | 670 | 618 | 1,770 | ||
| All other standard objects | 2023-2024 | 46 | 62 | 65 | 173 | |
| 2024-2025 | 49 | 64 | 65 | 178 | ||
| Total net budgetary expenditures | 2023-2024 | 381 | 814 | 677 | 1,872 | |
| 2024-2025 | 706 | 909 | 863 | 2,478 | ||
| (in $000s) | |||
|---|---|---|---|
| Standard Object | Explanation | Variance between 2024-2025 and 2023-2024 Q3 expenditures | Variance between 2024-2025 and 2023-2024 YTD expenditures |
| Personnel | The quarterly variance is mainly due to wage increases and retro payments from the collective bargaining settlements in Q3 last year. The YTD variance is mainly due to timing of OGD salary transfers occurring earlier this year and the programming growth and ramp up related to various initiatives such as Energy Innovation, Polar Continental Shelf Program, UNCLOS – Extended Continental Shelf, Critical Minerals, National Adaptation Strategy Wildfire Resilient Futures Initiative and Oil to Heat Pump Affordability. | (945) | 47,505 |
| Transfer Payments | The variance is mainly attributed to the increase in payments under Energy Innovation Program, Greener Homes (ramp up), Oil to Heat Pump Affordability as well as the timing of payments for the Forest Innovation, Investments in Forest Industry Transformation, and International Forest Model Network programs offset by a decrease in payments for the Smart Renewables Electrification Pathways program and transfers for offshore activity. | 186,772 | 554,461 |
| All Other Standard Objects | Minor increases and decreases within different standard objects. | 929 | 4,241 |
| Total Variance | 186,756 | 606,207 | |
3. Risks and Uncertainties
Canada’s natural resource sectors continue to contribute significantly to economic growth across the country by supporting vital natural resource-based jobs and fostering sustainable prosperity for Canadians. NRCan maintains its ongoing work to develop policies and programs that enhance the economic contribution of the natural resource sectors, while reducing emissions and other environmental impacts. NRCan continues to work with other government departments, provincial and territorial partners, and Indigenous groups to strengthen the economy for all Canadians. Additionally, Canada continues to support national and international actions to confront the impacts of climate change and extreme weather events that are becoming more prevalent.
The accelerating transition to net-zero has initiated a global race to attract investments in building clean economies. Canada must keep pace at the international level to meet the country's global commitments related to the sustainable development of natural resources while maintaining a focus on proactive risk management. As Canada transitions to a low-carbon economy, NRCan continues to advance cutting-edge research to inform decisions on the management of natural resources while ensuring that its programs, policies, and processes are inclusive by design and address systemic barriers. Advancing the principles of inclusion, diversity, equity, and accessibility along with utilizing Gender-based Analysis Plus, the Department will consider the impacts on vulnerable, marginalized, and underrepresented groups, and embed inclusive measures in policy and program design that support the transition to a clean energy future.
In addition, NRCan maintains its commitment to reconciliation by promoting an integrated and coordinated approach to Indigenous partnerships and economic reconciliation-focused initiatives in natural resources sectors. This will be achieved by advancing shared governance of Canada’s resources, implementation of the United Nations Declaration on the Rights of Indigenous Peoples Act (UNDA) legislation in operations, building meaningful relationships and collaborative partnerships with Indigenous organizations and communities, and developing a new National Benefits-Sharing Framework to ensure that Indigenous communities benefit from major resource projects taking place on or near to their traditional territories.
To adapt to the ever-evolving digital world, including hybrid work and growing cybersecurity risk, the Department will work to implement an integrated plan to respond to Canada’s Digital Ambition. By investing in the use of technology, research and innovation, cybersecurity, and upskilling staff, NRCan will continue to strengthen and modernize delivery of improved digital services. Given the high priority of enhanced cyber security, in response to increasingly sophisticated attacks, ensuring proper actions are taken to secure digital resources and information will increase NRCan’s ability to protect data assets while maintaining key programs and services for Canadians.
The global economy continues to face an elevated level of uncertainty due to ongoing events such as the conflicts in the Middle East, the war in Ukraine, supply chain disruptions, and natural disasters, as well as increasing geoeconomic fragmentation and protectionism. One of the biggest challenges of the Canadian natural resources sectors is the uncertainty surrounding commodity demand and prices, in the context of a global economic slowdown and growing geopolitical risks, tensions in the relationship with Canada’s biggest trading partner, and the transition to a low-carbon economy.
NRCan continues to strengthen its risk management capabilities and effectiveness, in support of delivering on its mandate and core responsibilities. The Department is moving forward with the integration of risk management with other departmental processes in support of priority setting and decision-making. This ensures mitigation actions are informed by regular assessment of risk information, serving to strengthen NRCan’s capacity to recognize and understand challenges.
As outlined in the 2023-2026 Corporate Risk Profile, the Department is monitoring the following six strategic risks and three operational risks:
Strategic Risks
- External Engagement
- Policy, Funding Authority
- Federal Alignment
- Regulatory Regime
- Reconciliation
- Inclusion, Diversity, Equity and Accessibility
Operational Risks
- Cyber Security
- Workplace Wellness
- Corporate Service Delivery
Strategic risks threaten the Department as a whole, and its ability to deliver expected outcomes and mandates. Concurrently, operational risks relate to the effectiveness and/or efficiencies of internal-facing activities. NRCan will monitor these key corporate risks closely and routinely to inform leadership on risk status and if further action is required, while continuing to support Canadians and the natural resource sectors in 2024-25.
4. Significant Changes in Relation to Operations, Personnel, Programs
No significant changes to report.
Original signed by:
Michael Vandergrift
Deputy Minister
Date signed
February 19, 2025
Ottawa, Canada
Original signed by:
Francis Brisson
Chief Financial Officer
Date signed
February 17, 2025
Ottawa, Canada
| (in thousands of dollars) | Fiscal Year 2024-2025 | Fiscal Year 2023-2024 | ||||
|---|---|---|---|---|---|---|
| Total available for use for the year ending March 31, 2025Footnote * | Expended during the quarter ended December 31, 2024 | Year-to-date used at quarter-end | Total available for use for the year ending March 31, 2024Footnote ** | Expended during the quarter ended December 31, 2023 | Year-to-date used at quarter-end | |
| Vote 1 - Net Operating Expenditures | 957,079 | 218,164 | 635,299 | 944,326 | 223,231 | 593,368 |
| Vote 5 - Capital Expenditures | 59,217 | 8,890 | 18,445 | 50,136 | 4,856 | 11,528 |
| Vote 10 - Grants and Contributions | 3,011,383 | 367,922 | 1,201,267 | 2,421,511 | 291,430 | 733,303 |
| Statutory Payments | ||||||
| Minister of Natural Resources – Salary and motor car allowance |
99 | 25 | 74 | 95 | 23 | 71 |
| Contributions to employee benefit plans | 74,496 | 18,168 | 54,504 | 78,159 | 17,229 | 51,689 |
| Contribution to the Canada/Newfoundland Offshore Petroleum Board | 12,915 | 3,507 | 10,000 | 11,805 | 3,229 | 9,008 |
| Contribution to the Canada/Nova Scotia Offshore Petroleum Board | 2,716 | 739 | 2,151 | 2,383 | - | 1,348 |
| Payments to the Nova Scotia Offshore Revenue Account | - | - | 14 | - | - | 41 |
| Payments to the Newfoundland Offshore Petroleum Resource Revenue Fund | 1,741,979 | 245,868 | 556,625 | 1,699,446 | 136,674 | 471,966 |
| Climate Action Support | - | (21) | (21) | - | (90) | (90) |
| Geomatics Canada Revolving Fund | 264 | - | - | - | - | - |
| Spending of amounts equivalent to proceeds from disposal of surplus moveable crown assets |
- | 76 | 81 | - | - | - |
| Total Statutory Payments | 1,832,469 | 268,362 | 623,428 | 1,791,888 | 157,065 | 534,033 |
| Total Budgetary Authorities | 5,860,148 | 863,338 | 2,478,439 | 5,207,861 | 676,582 | 1,872,232 |
| (in thousands of dollars) | Fiscal Year 2024-2025 | Fiscal Year 2023-2024 | ||||
|---|---|---|---|---|---|---|
| Total available for use for the year ending March 31, 2025Footnote * | Expended during the quarter ended December 31, 2024 | Year-to-date used at quarter-end | Total available for use for the year ending March 31, 2024Footnote ** | Expended during the quarter ended December 31, 2023 | Year-to-date used at quarter-end | |
| Budgetary Expenditures: | ||||||
| Personnel | 635,353 | 179,656 | 530,362 | 607,870 | 180,601 | 482,857 |
| Transportation and communication | 18,280 | 5,632 | 14,151 | 23,338 | 4,174 | 12,436 |
| Information | 30,727 | 6,167 | 12,883 | 34,414 | 3,862 | 7,219 |
| Professional and special services | 235,836 | 37,659 | 96,278 | 262,949 | 41,143 | 105,009 |
| Rentals | 44,088 | 3,248 | 12,921 | 30,381 | 4,484 | 19,988 |
| Repair and maintenance | 11,950 | 673 | 2,008 | 12,932 | 581 | 1,857 |
| Utilities, materials and supplies | 49,130 | 5,174 | 14,175 | 43,291 | 5,064 | 12,185 |
| Acquisition of land, buildings and works | 8,868 | 2,562 | 5,377 | 14,700 | 1,262 | 2,923 |
| Acquisition of machinery and equipment | 80,573 | 9,062 | 21,636 | 65,468 | 7,417 | 14,901 |
| Transfer payments | 4,768,993 | 618,015 | 1,770,036 | 4,135,144 | 431,243 | 1,215,576 |
| Other subsidies and payments | 13,191 | (1,062) | 10,929 | 15,755 | 1,418 | 9,991 |
| Total Budgetary Expenditures | 5,896,989 | 866,786 | 2,490,756 | 5,246,242 | 681,249 | 1,884,942 |
| Less: Total Revenues Netted Against Expenditures | 36,841 | 3,448 | 12,317 | 38,381 | 4,667 | 12,710 |
| Total Net Budgetary Expenditures | 5,860,148 | 863,338 | 2,478,439 | 5,207,861 | 676,582 | 1,872,232 |