
Drought
Drought is expected to become more frequent and severe in parts of Canada.
Drought is defined as a shortage of precipitation over an extended period, usually a season or more, resulting in insufficient water availability that adversely impacts vegetation, animals and people.
Areas of western Canada are already experiencing frequent and severe droughts. Scientists expect new areas across the country to be affected and drought to become even more frequent and severe. The consequences could have far-reaching impacts on Canada’s forests.
Why knowing about drought is important
Drought threatens Canada’s forests by limiting the available water that trees need to survive. When water is limited, trees become weakened. Weakened trees cannot grow at a normal rate, may not be able to regenerate, or could die. It is also difficult for trees to defend themselves against insects and diseases as they become stressed. Similarly, during wildland fires, weakened trees are at higher risk. For the Canadian forest industry, these issues directly affect the available wood supply.
Canadian Forest Service researchers have developed a measure of drought called the Climate Moisture Index (CMI). CMI is calculated as the difference between the annual amount of precipitation and the expected amount of water that evaporates each year and can be used to indicate the amount of moisture available in a given year.
Tracking drought helps forest managers anticipate and manage for a changing climate. For example, the SeedWhere program can be used to predict where similar climates will be located under a range of future climate scenarios and timeframes. Forest managers can use this tool to select the planting stock (e.g., species and provenance) that is best adapted to predicted drought conditions.
What has changed
Several regions of Canada experienced substantial droughts between 1951 and 2010, but with significant variability between decades. However, during the first decade of the 21st century (2001–2010), exceptional droughts were observed across the country – for example, the 2001–2002 drought in the Prairies (Figures 1 and 2), caused abnormally high aspen mortality (see Tree mortality).
Similar trends have been reported in forests around the world. With droughts expected to become more frequent and severe in most of Canada’s forests, there are growing concerns about the impact of drought on forest distribution, tree health and regeneration success.
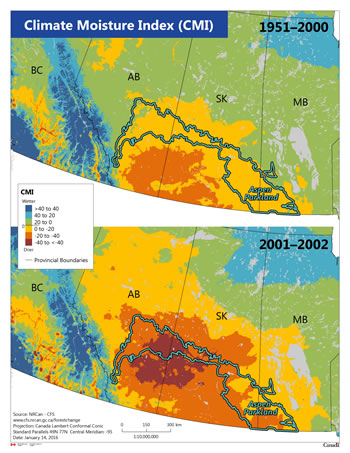
Figure 1 – Mean Climate Moisture Index (CMI) for 1951–2000 and the 2001–2002 drought in the aspen parkland
Larger image [282 Kb]
Figure 2 – Long-term changes in the Climate Moisture Index (CMI) in the aspen parkland
Larger image [56 Kb]
Figure 3 – Reference period (1981–2010) and projected mean annual Climate Moisture Index (CMI) for the short- (2011–2040), medium- (2041–2070), and long-term (2071–2100) under the Representative Concentration Pathway (RCP)Footnote * 8.5 (continued emissions increases) and, for the long-term (2071–2100), under RCP 2.6 (rapid emissions reductions) for Canada
Larger image [174 Kb]
Graph data
| Year | Climate Moisture Index (CMI) |
|---|---|
| 1891 | -8.2 |
| 1892 | -12.8 |
| 1893 | -12.7 |
| 1894 | -18.1 |
| 1895 | -18.6 |
| 1896 | -2.6 |
| 1897 | -13.7 |
| 1898 | -14.8 |
| 1899 | 0.7 |
| 1900 | 16.8 |
| 1901 | 22.4 |
| 1902 | 7.3 |
| 1903 | -2.9 |
| 1904 | 7.9 |
| 1905 | -15.0 |
| 1906 | -3.9 |
| 1907 | -1.6 |
| 1908 | 3.7 |
| 1909 | -2.7 |
| 1910 | -29.8 |
| 1911 | -4.6 |
| 1912 | -3.7 |
| 1913 | -3.8 |
| 1914 | -10.2 |
| 1915 | -6.8 |
| 1916 | -0.6 |
| 1917 | -11.9 |
| 1918 | -19.7 |
| 1919 | -30.0 |
| 1920 | 5.5 |
| 1921 | -0.1 |
| 1922 | -16.9 |
| 1923 | -5.8 |
| 1924 | -18.3 |
| 1925 | -8.5 |
| 1926 | -11.2 |
| 1927 | 13.4 |
| 1928 | -11.1 |
| 1929 | -21.9 |
| 1930 | -16.2 |
| 1931 | -11.0 |
| 1932 | -0.5 |
| 1933 | -9.5 |
| 1934 | -0.8 |
| 1935 | -4.4 |
| 1936 | -13.4 |
| 1937 | -15.1 |
| 1938 | -18.8 |
| 1939 | -5.9 |
| 1940 | -7.7 |
| 1941 | -24.0 |
| 1942 | 4.5 |
| 1943 | -2.3 |
| 1944 | -0.3 |
| 1945 | -15.1 |
| 1946 | -12.9 |
| 1947 | -14.5 |
| 1948 | 2.3 |
| 1949 | -19.4 |
| 1950 | -12.5 |
| 1951 | 4.9 |
| 1952 | -0.9 |
| 1953 | 1.5 |
| 1954 | 4.7 |
| 1955 | 10.3 |
| 1956 | 3.7 |
| 1957 | -18.1 |
| 1958 | -6.2 |
| 1959 | -13.9 |
| 1960 | 6.6 |
| 1961 | -11.2 |
| 1962 | -10.9 |
| 1963 | -9.1 |
| 1964 | -23.1 |
| 1965 | 13.7 |
| 1966 | -7.2 |
| 1967 | -7.5 |
| 1968 | -12.2 |
| 1969 | -3.6 |
| 1970 | 9.2 |
| 1971 | -5.6 |
| 1972 | -7.8 |
| 1973 | 3.0 |
| 1974 | 14.9 |
| 1975 | -0.2 |
| 1976 | -7.6 |
| 1977 | -9.7 |
| 1978 | 1.6 |
| 1979 | 4.4 |
| 1980 | -15.8 |
| 1981 | -5.0 |
| 1982 | -11.9 |
| 1983 | 1.2 |
| 1984 | -5.0 |
| 1985 | 1.4 |
| 1986 | 5.9 |
| 1987 | -7.2 |
| 1988 | -10.5 |
| 1989 | -6.9 |
| 1990 | -1.8 |
| 1991 | -6.9 |
| 1992 | -12.2 |
| 1993 | -3.3 |
| 1994 | 0.5 |
| 1995 | -13.3 |
| 1996 | 0.8 |
| 1997 | 1.8 |
| 1998 | -11.7 |
| 1999 | 2.6 |
| 2000 | -0.5 |
| 2001 | -15.1 |
| 2002 | -35.8 |
| 2003 | -5.8 |
| 2004 | -1.3 |
| 2005 | 4.5 |
| 2006 | -2.5 |
| 2007 | 1.3 |
| 2008 | -8.9 |
| 2009 | -18.1 |
| 2010 | -2.7 |
| 2011 | 8.6 |
| 2012 | -8.1 |
| 2013 | 5.3 |
| 2014 | 1.1 |
| 2015 | -15.0 |
| 2016 | -5.9 |
| 2017 | -1.3 |
| 2018 | -14.5 |
The outlook
Increases in drought could have far-reaching impacts on Canada’s forests, both directly, through impacts on tree growth and survival, and indirectly, through drought-related increases in the frequency of disturbances such as fire and insect outbreaks.
Drought is expected to become more frequent in several areas that are already relatively dry, such as the southern interior of British Columbia and the Prairie provinces (Figure 3).
Some areas that have not previously experienced frequent drought are also expected to become drier in the future. The current prairie conditions are expected to spread northwards into areas of the southern boreal forest. Such a shift would lead to significant changes in forest ecosystems.
Moist regions, such as the Pacific and Atlantic coastal areas, are expected to be less affected, with limited changes in annual climate moisture index (CMI) values over the next 100 years. However, these moist areas could become more prone to the impacts of seasonal droughts even if the annual CMI indices remain positive.
How drought and its indicators are defined
Drought differs from aridity, which is a defining climate feature in regions characterized by low precipitation, such as deserts.
Three indicators are used to understand drought:
- The Climate Moisture Index (CMI) - calculated as the difference between annual precipitation and potential evapotranspiration; the potential loss of water vapour from a landscape covered by vegetation (see references). Positive CMI values indicate wet or moist conditions and show that precipitation is sufficient to sustain a closed-canopy forest. Negative CMI values indicate dry conditions that, at best, can support discontinuous parkland-type forests. The CMI is best suited to evaluating moisture conditions in dry regions, such as the Prairies.
- The Soil Moisture Index (SMI) - calculated using daily or monthly weather records of precipitation and temperature, along with elevation and soil water-holding capacity (see references). Lower values indicate drier conditions. The SMI is designed to provide a direct measure of soil moisture changes within the rooting zone of trees. It is better suited than the CMI for representing seasonal droughts in regions with high winter precipitation, such as the Pacific coast and eastern Canada. However, as this indicator was developed quite recently, it is not as well-tested as the CMI, which was developed in 1997.
- The Palmer Drought Severity Index (PDSI) - calculated using precipitation, temperature, moisture-holding capacity of the soil, and local infiltration (see equations). Positive and negative values represent conditions that are wetter and drier, respectively, than the long-term (≥30-year) historical mean for a given location. This indicator is most commonly used in agriculture, but can be applied in forestry.
Sources and references for drought and its indicators
- Allen, C.D., Macalady, A.K., et al. 2010. A global overview of drought and heat-induced tree mortality reveals emerging climate change risks for forests. Forest Ecology and Management 259, 660–684.
- Allen, C.D., Breshears, D.D., et al. 2015. On underestimation of global vulnerability to tree mortality and forest die-off from hotter drought in the Anthropocene. Ecosphere 6, 1–55.
- Cook, E.R., Seager, R., et al. 2007. North American drought: reconstructions, causes, and consequences. Earth-Science Reviews 81, 93–134.
- Hogg, E.H. 1994. Climate and the southern limit of the western Canadian boreal forest. Canadian Journal of Forest Research 24, 1835–1845.
- Hogg, E.H. 1997. Temporal scaling of moisture and the forest-grassland boundary in western Canada. Agricultural and Forest Meteorology 84,115–122.
- Hogg, E.H., and Bernier, P.Y. 2005. Climate change impacts on drought-prone forests in western Canada. Forestry Chronicle 81, 675–682.
- Hogg, E.H., Brandt, J.P., et al. 2008. Impacts of a regional drought on the productivity, dieback and biomass of western Canadian aspen forests. Canadian Journal of Forest Research 38, 1373–1384.
- Hogg E.H., Barr A.G., et al. 2013. A simple Soil Moisture Index for representing multi-year drought impacts on aspen productivity in the western Canadian interior. Agricultural and Forest Meteorology 178–179, 173–182.
- Hogg, E.H., Michaelian, M., et al. 2017. Recent climatic drying leads to age‐independent growth reductions of white spruce stands in western Canada. Global change biology, 23 (12), 5297-5308.
- Intergovernmental Panel on Climate Change (IPCC). 2013. Climate change 2013: The physical science basis. Contribution of Working Group I to the Fifth Assessment Report of the Intergovernmental Panel on Climate Change. Cambridge University Press, Cambridge, UK, and New York, NY: Cambridge University Press.
- Michaelian, M., Hogg, E.H., et al. 2011. Massive mortality of aspen following severe drought along the southern edge of the Canadian boreal forest. Global Change Biology 17, 2084–2094.
- Wang, Y., Hogg, E.H., et al. 2014. Past and projected future changes in moisture conditions in the Canadian boreal forest. Forestry Chronicle 90, 678–691.
- Williams, A.P., Allen, C.D., et al. 2013. Temperature as a potent driver of regional forest drought stress and tree mortality. Nature Climate Change 3, 292–297.
Canadian Forest Service key contacts
Ted Hogg, Research Scientist, Vegetation Climate Interactions, Northern Forestry Centre
David Price, Research Scientist, Integrative Climate Change Impacts Modelling, Northern Forestry Centre
Adaptation tools and resources
Forest Change Toolkit – a list of tools and resources for climate change adaptation
- Aubin, I., Boisvert‐Marsh, L., et al. 2018. Tree vulnerability to climate change : Improving exposure-based assessments using traits as indicators of sensitivity. Ecosphere 9 (2).
- Boucher, D., Boulanger, Y., et al. 2018. Current and projected cumulative impacts of fire, drought, and insects on timber volumes across Canada. Ecological applications 28 (5), 1245-1259.
- Chang, K.H., Price, D.T., et al. 2014. Simulating impacts of water stress on woody biomass in the southern boreal region of western Canada using a dynamic vegetation model. Agricultural and Forest Meteorology 198, 142–154.
- Hember, R.A., Kurz, W.A., et al. 2017. Relationships between individual‐tree mortality and water‐balance variables indicate positive trends in water stress‐induced tree mortality across North America. Global change biology 23 (4), 1691-1710.
- Hogg E.H., Barr A.G., et al. 2013. A simple Soil Moisture Index for representing multi-year drought impacts on aspen productivity in the western Canadian interior. Agricultural and Forest Meteorology 178–179, 173–182.
- Hogg, E.H., Michaelian, M., et al. 2017. Recent climatic drying leads to age‐independent growth reductions of white spruce stands in western Canada. Global change biology 23 (12), 5297-5308.
- Housset, J.M., Girardin, M.P., et al. 2015. Unexpected warming‐induced growth decline in Thuja occidentalis at its northern limits in North America. Journal of Biogeography 42 (7), 1233-1245.
- Michaelian, M., Hogg, E.H., et al. 2011. Massive mortality of aspen following severe drought along the southern edge of the Canadian boreal forest. Global Change Biology 17, 2084–2094.
- Michaelian, M. 2015. Factors affecting fall down rates of dead aspen (Populus tremuloides) biomass following severe drought in west-central Canada. Global Change Biology 21, 1968–1979.
- Wang, Y., Hogg, E.H., et al. 2014. Past and projected future changes in moisture conditions in the Canadian boreal forest. Forestry Chronicle 90, 678–691.
Page details
- Date modified: