
Natural Resources Canada Quarterly Financial Report (Unaudited) for the Quarter Ended September 30, 2015
Statement outlining results, risks and significant changes in operations, personnel and programs
1. Introduction
This quarterly financial report should be read in conjunction with the Main Estimates and Supplementary Estimates (A), as well as Canada’s Economic Action Plan 2015 (Budget 2015). It has been prepared by management as required by section 65.1 of the Financial Administration Act and in the form and manner prescribed by Treasury Board. This quarterly financial report has not been subject to an external audit or review.
1.1 Authority, Mandate and Programs
Natural Resources Canada (NRCan) seeks to enhance the responsible development and use of Canada’s natural resources and the competitiveness of Canada’s natural resource sectors. The department is an established leader in science and technology in the fields of energy, forests, and minerals and metals, and applies its expertise in earth sciences to build and maintain an up-to-date knowledge base of Canada’s landmass. NRCan develops policies and programs that enhance the contribution of the natural resource sectors to the economy and improve the quality of life of CanadiansFootnote 1.
Further details on NRCan’s authority, mandate and programs can be found in Part II of the Main Estimates.
1.2 Basis of Presentation
This quarterly financial report has been prepared by management using an expenditure basis of accounting. The accompanying Statement of Authorities includes NRCan’s spending authorities granted by Parliament, and those used by NRCan are consistent with the Main Estimates and Supplementary Estimates (A) for the 2015-16 fiscal year. This quarterly report has been prepared using a special purpose financial reporting framework.
The authority of Parliament is required before monies can be spent by the Government. Approvals are given in the form of annually approved limits through appropriation acts or through legislation in the form of statutory spending authority for specific purposes.
As part of the Parliamentary business of supply, the Main Estimates must be tabled in Parliament on or before March 1 preceding the new fiscal year. As the Federal Budget is typically tabled around the same time as Main Estimates, measures announced in the Budget are not included in Main Estimates for either 2014-15 or 2015-16.
In fiscal year 2015-16, frozen allotments will be established by Treasury Board authority in departmental votes to prohibit the spending of funds identified as savings measures in Budget 2015. The changes to departmental authorities for future years will be implemented through the Annual Reference Level Update, as approved by Treasury Board, and reflected in the subsequent Main Estimates tabled in Parliament. The same approach was taken in 2014-15 for savings measures in Budget 2014.
NRCan uses the full accrual method of accounting to prepare and present its annual unaudited departmental financial statements, which are part of the Departmental Performance Report. However, the spending authorities voted by Parliament remain on an expenditure basis.
2. Highlights of Fiscal Quarter and Fiscal Year-to-Date Results
This quarterly financial report reflects the results as at September 30, 2015, including Main Estimates and Supplementary Estimates (A) for which full supply was released. The details presented in this report focus on and compare the second quarter results of 2015-16 with those of 2014-15.
Authorities
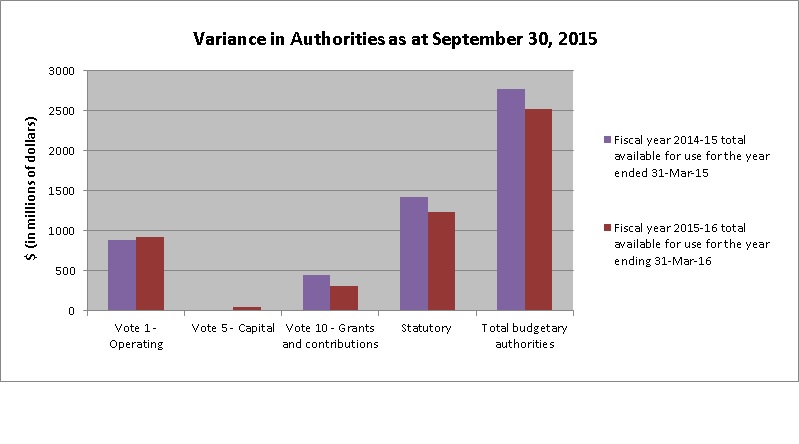
As per Table 1, presented at the end of this document, and on Graph 1 below, as at September 30, 2015, NRCan has authorities available for use of $2,523.2 million in 2015-16 compared to $2,773.6 million as of September 30, 2014, for a net decrease of $250.4 million or 9%.
Graph 1
Text Version
| Authority | Fiscal year 2014-15 total available for use for the year ended 31-Mar-15 |
Fiscal year 2015-16 total available for use for the year ending 31-Mar-16 |
|---|---|---|
| Vote 1 - Operating | 886 | 924 |
| Vote 5 - Capital | 16 | 54 |
| Vote 10 - Grants and contributions | 444 | 307 |
| Statutory | 1428 | 1239 |
| Total budgetary authorities | 2,774 | 2,523 |
The decrease of $250.4 million in authorities in 2015-16 compared to 2014-15 is explained by the net effect of both increases and decreases within Vote 1 operating expenditures, Vote 5 capital expenditures, Vote 10 grants and contributions, and statutory authorities, as per the following:
For Vote 1 operating expenditures, a net increase of $38 million between the authorities available for use at the end of the second quarters of 2015-16 ($923.7 million) and 2014-15 ($885.7 million) is explained mainly by the following year-over-year changes:
Increases:
- $36.3 million for the Nuclear Legacy Liabilities Program as part of a planned adjustment to the program financial profile;
- $19.5 million for the United Nations Convention on the Law of the Sea (UNCLOS) - Mapping of the North Pole Program, as this funding was approved in fiscal year 2014-15 through Supplementary Estimates (B); therefore funding was only available in the third quarter;
- $18.1 million for the Port Hope Area Initiative as part of a planned adjustment to the program financial profile;
- $5.3 million for the Federal Infrastructure Program, which is new in fiscal year 2015-16; and
- $4.3 million for the Geo-mapping for Energy and Minerals Program as part of a planned adjustment to the program financial profile.
Decreases:
- $20.3 million for the Stakeholder Engagement and Outreach Campaign to Build Prosperity for Canada - International Advertising Component, as the program sunsetted on March 31, 2015;
- $9.9 million for the Operating Budget Carry Forward (OBCF), as there was less authorities available to carry forward in 2015-16;
- $8.5 million for Advisory Services for the restructuring of Atomic Energy of Canada Limited, as part of a planned adjustment to the program financial profile; and
- $5.2 million for the transfers between Operating and Capital as part of an alignment exercise.
For Vote 5 capital expenditures, a net increase of $38.4 million between the authorities available for use at the end of the second quarters of 2015-16 ($54.3 million) and 2014-15 ($15.9 million) is explained mainly by the following year-over-year changes:
Increases:
- $38.6 million for the Federal Infrastructure Program, which is new in fiscal year 2015-16;
- $5.2 million for the transfers between Operating and Capital as part of an alignment exercise; and
- $1 million for the Targeted Geoscience Initiative, which was renewed in fiscal year 2015-16 through Supplementary Estimates (A).
Decreases:
- $4.2 million for the Revitalization of NRCan’s Satellite Station Facilities across Canada as the program sunsetted on March 31, 2015; and
- $3.1 million for the Capital Budget Carry Forward (CBCF), as there was less authorities available to carry forward in 2015-16.
For Vote 10 grants and contributions, a net decrease of $137.4 million between the authorities available for use at the end of the second quarters of 2015-16 ($306.6 million) and 2014-15 ($444 million) is explained mainly by the following year-over-year changes:
Increases:
- $21 million for the Investments in Forest Industry Transformation Program due to a planned adjustment to the program financial profile.
Decreases:
- $99 million for the ecoENERGY for Biofuels Producer Incentive due to a planned adjustment to the program financial profile;
- $25 million for the grant to Sustainable Development Technology Canada for the Next Generation Biofuels Fund as the appropriated portion of the program sunsetted on March 31, 2015;
- $9.4 million for the Clean Energy Fund as part of a planned adjustment to the program financial profile;
- $6.5 million for the Grant to Sustainable Development Technology Canada for the Sustainable Development Technology Fund due to a planned adjustment to the program financial profile;
- $5.4 million for the Wind Power Production Incentive Program. The decrease reflects a planned adjustment in the program financial profile; and
- $4.6 million for the ecoENERGY Innovation Initiative as part of a planned adjustment to the program financial profile.
For statutory items, a net decrease of $189.3 million between the authorities available for use at the end of the second quarters of 2015-16 ($1,238.7 million) and 2014-15 ($1,428 million) is explained mainly by:
Increases:
- $6.5 million in the Nova Scotia Offshore Revenue Account as expectations at the time of Main Estimates were that more revenue would be collected in 2015-16 than in 2014-15.
Decreases:
- $118.2 million in the Newfoundland Offshore Petroleum Resource Revenue Fund as expectations at the time of Main Estimates were that less revenue would be collected in 2015-16 than in 2014-15;
- $79.3 million for the Canada Foundation for Sustainable Development Technology - Next Generation Biofuels Fund – Statutory as the expectation at the time of Main Estimates was that no statutory funding would be disbursed; and
- $1.3 million pertaining to the Crown Share Adjustment Payments for Nova Scotia Offshore Petroleum Resources due to a planned adjustment to the program financial profile.
In addition to the above detail, other minor increases and decreases occurred within the appropriated funding and in other statutory departmental programs.
Budgetary Expenditures by Standard Object
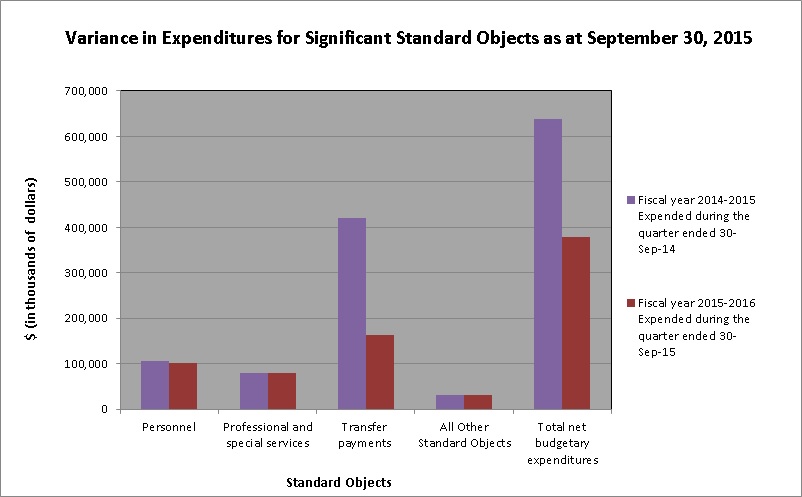
The spending for the quarter ending September 30, 2015, amounts to $378.4 million or 15% of total funding available for the fiscal year, compared to $638.9 million or 23% for the same quarter last year. This decrease is mainly related to a decrease in transfer payments in 2015-16 compared to payments in 2014-15. Further analysis has been done on standard objects with significant expenses, which is represented on Graph 2 below, and Table 2 at the end of this document presents the spending for all standard objects.
Graph 2
Text Version
| Authority | Fiscal year 2014-2015 Expended during the quarter ended 30-Sept-14 |
Fiscal year 2015-2016 Expended during the quarter ended 30-Sept-15 |
|---|---|---|
| Personnel | 106,767 | 102,485 |
| Professional and special services | 80,263 | 80,782 |
| Transfer payments | 420,943 | 164,183 |
| All Other Standard Objects | 30,911 | 30,952 |
| Total net budgetary expenditures | 638,884 | 378,402 |
In the second quarter of 2015-16, NRCan has $4.3 million less personnel expenditures ($102.5 million) as compared to 2014-15 ($106.8 million) mainly due to the timing of expenditures from one year to the next, with advances to other government departments being processed in the first quarter of 2015-16 instead of the second quarter, as was the case in 2014-15.
The net decrease of $2.3 million in personnel expenditures between the year-to-date expenditures at the end of the second quarters of 2015-16 ($207.4 million) and 2014-15 ($209.7 million) is related mainly to reduced staffing levels through attrition.
In the second quarter of 2015-16, expenditures for professional and special services ($80.8 million) are consistent with the expenditures for the same period of 2014-15 ($80.3 million).
The net decrease of $8.7 million in expenditures for professional and special services between the year-to-date expenditures at the end of the second quarters of 2015-16 ($112.8 million) and 2014-15 ($121.5 million) is mainly due to the timing of expenditures from one year to the next year for various programs.
In the second quarter of 2015-16, NRCan has $256.7 million less expenditures for transfer payments ($164.2 million) as compared to 2014-15 ($420.9 million) primarily due to:
Decreases:
- $230.9 million in statutory Atlantic offshore transfers resulting from the reduction in oil and natural gas prices; and,
- $21.5 million due to a reduction in incentive rates paid by the ecoENERGY Biofuels program as per program design.
The net decrease of $280.7 million in expenditures for transfer payments between the year-to-date expenditures at the end of the second quarter of 2015-16 ($227.9 million) and 2014-15 ($508.6 million) is mainly related to the same reasons as above.
In addition, the expenditures for “other subsidies and payments” in the second quarter of 2015-16 ($11.7 million) are consistent with the second quarter of 2014-15 ($11.8 million). However, the net decrease of $11.2 million in expenditures for “other subsidies and payments” between the year-to-date expenditures at the end of the second quarter of 2015-16 ($14.3 million) and 2014-15 ($25.5 million) is mainly due to a one-time transition payment of $12.3 million for implementing salary payment in arrears by the Government of Canada in 2014-15.
3. Risks and Uncertainties
NRCan recognizes that a solid understanding of its risk environment is fundamental in achieving its strategic outcomes and maintaining operational efficiency and effectiveness. Within the confines of its mandate and the authority at its disposition, NRCan endeavours to respond to uncertainties, including opportunities, in the global and domestic contexts and their potential impacts on Canada’s natural resource sectors.
Although recent global economic developments have increased short-term uncertainty and volatility, the medium-term global demand outlook for natural resources remains generally positive. For the Department, this means closely monitoring the impacts of these developments on the achievement of the government’s priorities in resource-related infrastructure, market development and environmental performance. It also means leveraging, to the extent possible, its policies and programs to help the natural resource sectors to mitigate short-term risks and address structural challenges.
In addition to being responsive to its external context, NRCan also manages uncertainties regarding its internal operations, including future funding level and spending. On the funding front, a number of its programs are sunsetting, which will impact both its grants and contributions programs and its operating and capital budgets. With regard to spending, the Department is working to mitigate the costs related to unfunded collective bargaining. The Department tracks its financial risks through scenario planning, monthly analysis of trends and forecasting in both salary and non-salary expenditures, and comprehensive quarterly reviews. NRCan has taken steps to stabilize the funding for its internal services, while providing flexibility to adjust them as the size of the department evolves. NRCan further mitigates its financial risks by following best practices that comply with the Financial Administration Act. Finally, NRCan continues to engage with central agencies to manage the financial uncertainty associated with the sunsetting of specific programs.
4. Significant Changes in Relation to Operations, Personnel, Programs
During the second quarter of 2015-16, as part of the completion of the Atomic Energy of Canada Limited restructuring process, the responsibility for the Nuclear Legacy Liabilities Program and the Historic Waste Program was transferred from Natural Resources Canada to Atomic Energy of Canada Limited.
The appointment of a new Assistant Deputy Minister for the Public Affairs and Portfolio Management Sector occurred in the second quarter of 2015-16.
No other significant changes in relation to operations, personnel or programs occurred during the second quarter of 2015-16.
Original signed by:
| Bob Hamilton Deputy Minister |
Kami Ramcharan, CMA Chief Financial Officer |
|
| November 26, 2015 Ottawa, Canada |
November 19, 2015 Ottawa, Canada |
| Fiscal year 2015-16 | Fiscal year 2014-15 | |||||
|---|---|---|---|---|---|---|
| Total available for use for the year ending March 31, 2016* |
Used during the quarter ended September 30, 2015 | Used year-to-date at quarter-end | Total available for use for the year ending March 31, 2015** |
Used during the quarter ended September 30, 2014 | Used year-to-date at quarter-end | |
| Vote 1 - Net Operating Expenditures | 923,658 | 194,288 | 324,712 | 885,669 | 201,200 | 349,486 |
| Vote 5 - Capital Expenditures | 54,302 | 5,828 | 6,823 | 15,880 | 2,920 | 5,112 |
| Vote 10 - Grants and Contributions | 306,609 | 50,920 | 75,236 | 444,039 | 76,780 | 98,722 |
| Statutory Payments | ||||||
| Minister of Natural Resources – Salary and motor car allowance |
82 | 20 | 41 | 80 | 20 | 40 |
| Contributions to employee benefit plans | 56,645 | 14,084 | 28,167 | 55,168 | 13,792 | 27,584 |
| Spending of amounts equivalent to proceeds from disposal of surplus crown assets | - | - | - | - | 8 | 8 |
| Canada Foundation for Sustainable Development Technology Grant |
- | - | - | 79,338 | - | - |
| Contribution to the Canada/Newfoundland Offshore Petroleum Board | 8,835 | 2,209 | 4,418 | 7,756 | 2,209 | 4,418 |
| Contribution to the Canada/Nova Scotia Offshore Petroleum Board |
3,965 | 1,118 | 2,121 | 3,550 | 1,045 | 1,983 |
| Payments to the Nova Scotia Offshore Revenue Account |
74,752 | 7,630 | 9,279 | 68,216 | 21,846 | 28,567 |
| Payments to the Newfoundland Offshore Petroleum Resource Revenue Fund |
1,081,331 | 89,984 | 124,481 | 1,199,509 | 319,064 | 374,914 |
| Crown Share Adjustment Payments for Nova Scotia Offshore Petroleum Resources |
13,055 | 12,322 | 12,322 | 14,394 | - | - |
| Total Statutory Payments | 1,238,666 | 127,367 | 180,829 | 1,428,011 | 357,984 | 437,514 |
| Total Budgetary Authorities | 2,523,235 | 378,402 | 587,600 | 2,773,599 | 638,884 | 890,834 |
* Total available for use includes only authorities available for use and granted by Parliament at quarter-end through the Main Estimates and Supplementary Estimates (A) and does not reflect measures announced in Budget 2015.
** Total available for use includes only authorities available for use and granted by Parliament at quarter-end through the Main Estimates and Supplementary Estimates (A) and does not reflect measures announced in Budget 2014.
|
Fiscal year 2015-16 |
Fiscal year 2014-15 |
|||||
|---|---|---|---|---|---|---|
| Planned expenditures for the year ending March 31, 2016* | Expended during the quarter ended September 30, 2015 | Year-to-date used at Quarter- end | Planned expenditures for the year ending March 31, 2015** | Expended during the quarter ended September 30, 2014 | Year-to-date used at Quarter- end | |
| Budgetary Expenditures: | ||||||
| Personnel | 394,827 | 102,485 | 207,421 | 390,814 | 106,767 | 209,724 |
| Transportation and communication | 15,926 | 3,753 | 6,439 | 25,856 | 4,424 | 5,671 |
| Information | 12,915 | 765 | 1,259 | 9,871 | 1,382 | 2,096 |
| Professional and special services | 523,576 | 80,782 | 112,784 | 471,140 | 80,263 | 121,465 |
| Rentals | 15,276 | 9,561 | 13,613 | 17,123 | 9,731 | 13,107 |
| Repair and maintenance | 9,832 | 2,213 | 2,635 | 5,705 | 494 | 813 |
| Utilities, materials and supplies | 33,329 | 4,299 | 6,405 | 28,537 | 4,233 | 6,056 |
| Acquisition of land, buildings and works | 7,071 | 465 | 465 | 6,713 | 74 | 226 |
| Acquisition of machinery and equipment | 51,483 | 2,377 | 3,262 | 28,000 | 3,328 | 6,361 |
| Transfer payments | 1,488,547 | 164,183 | 227,857 | 1,816,802 | 420,943 | 508,603 |
| Other subsidies and payments | 5,532 | 11,660 | 14,315 | 8,089 | 11,818 | 25,532 |
| Total Budgetary Expenditures | 2,558,313 | 382,542 | 596,454 | 2,808,650 | 643,457 | 899,655 |
| Less: | ||||||
| Total Revenues Netted Against Expenditures | 35,079 | 4,140 | 8,854 | 35,051 | 4,573 | 8,821 |
| Total Net Budgetary Expenditures | 2,523,235 | 378,402 | 587,600 | 2,773,599 | 638,884 | 890,834 |
* Planned expenditures do not reflect measures announced in Budget 2015.
** Planned expenditures do not reflect measures announced in Budget 2014.
Page details
- Date modified: