
The Historical Flood Events layer now includes new precipitation statistics
The Historical Flood Events layer has been updated with precipitation statistics, thanks to the efforts of Natural Resources Canada and Environment and Climate Change Canada. This upgrade affects 26% of the events in the data layer and provides a unique perspective on the amount of precipitation associated with specific floods.
For each heavy rainfall flood event that occurred after January 1, 1980, three new documents are now available:
- An analysis sheet showing the amount of precipitation received throughout the event in the form of a sum map and histogram (see image)
- An animated GIF illustrating the precipitation pattern during the event.
- A precipitation data file in JSON format that details the amount of precipitation per time interval for each location.
Adding these statistics allows any user to better understand the context and meteorological conditions that led to a flood.
The data used to generate these statistics come from 2 sources. For events from 1980 to 2018, the precipitation data is from Environment and Climate Change Canada's Regional Deterministic Reforecast System which is based on the Canadian Precipitation Analysis (CaPA-RDRS v2.1). For events after 2018, the precipitation data is from Environment and Climate Change Canada's Regional Deterministic Precipitation Analysis based on the Canadian Precipitation Analysis (CaPA-RDPA).
For more information, please email geoinfo@nrcan-rncan.gc.ca.
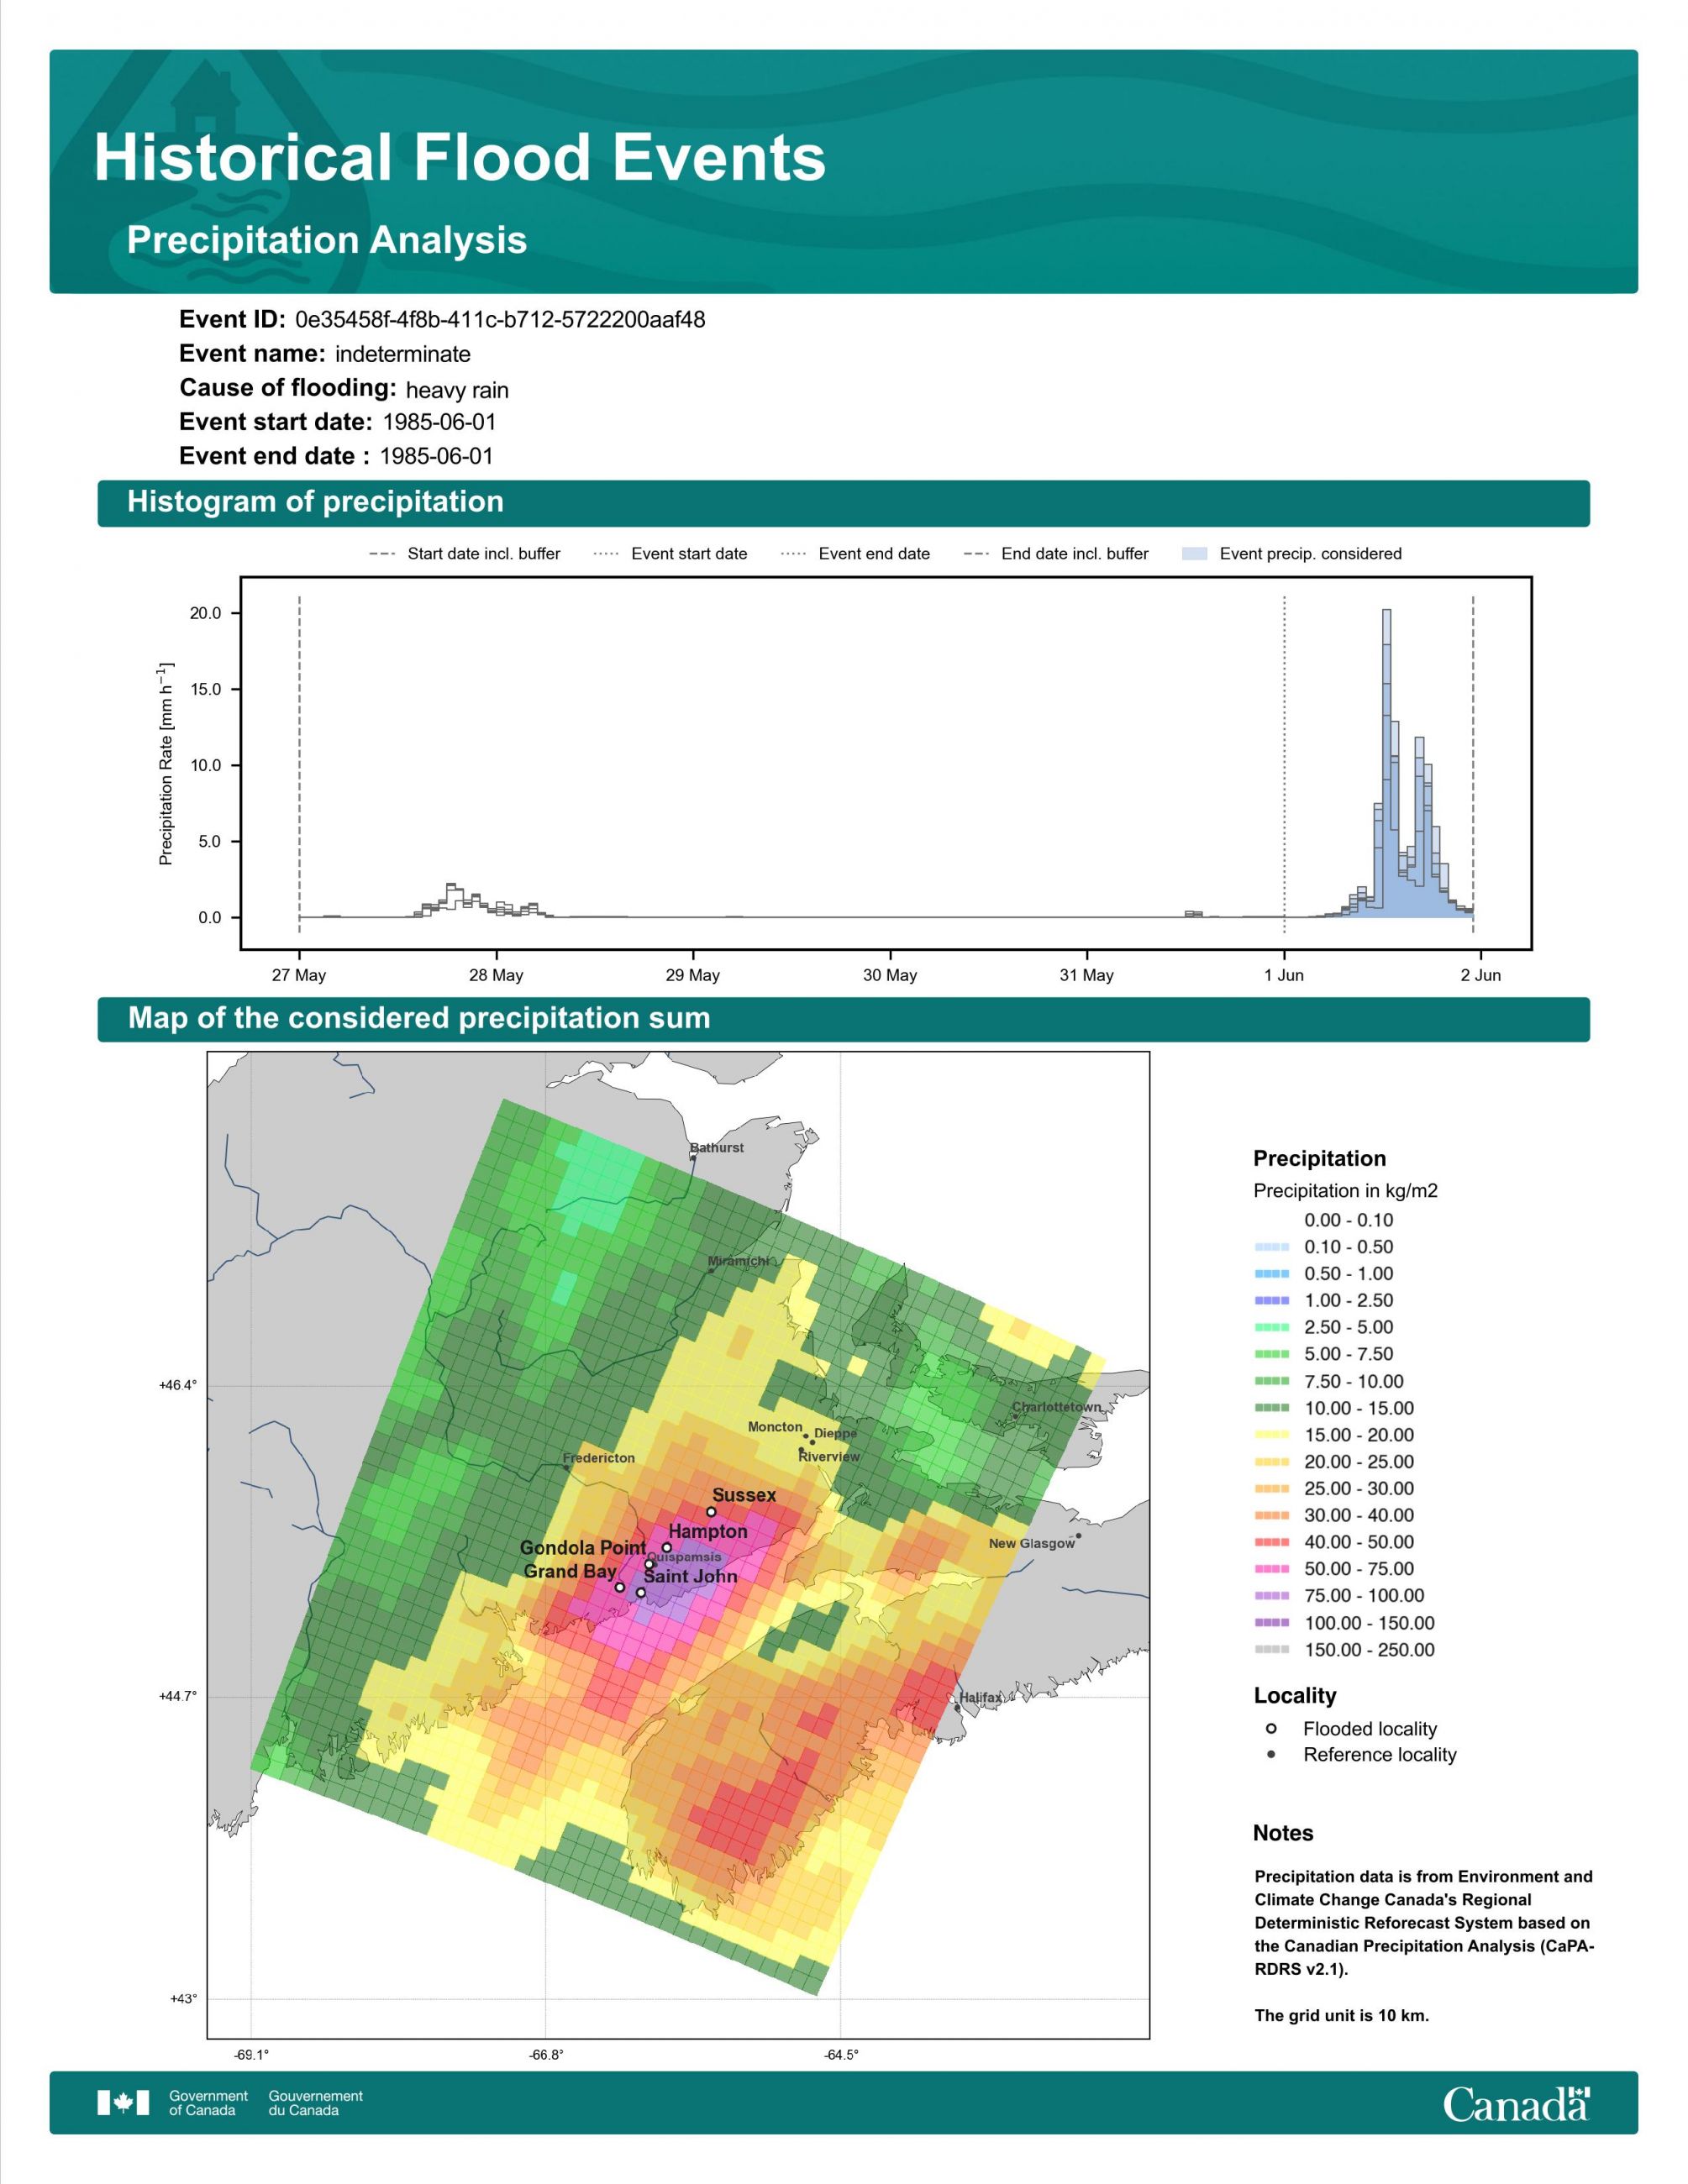
Analysis sheet showing details of a historical flood event. Includes a histogram graph and a map of the precipitation sum.
Page details
- Date modified: