The first studies funded by the Flood Hazard Identification and Mapping Program have been published!
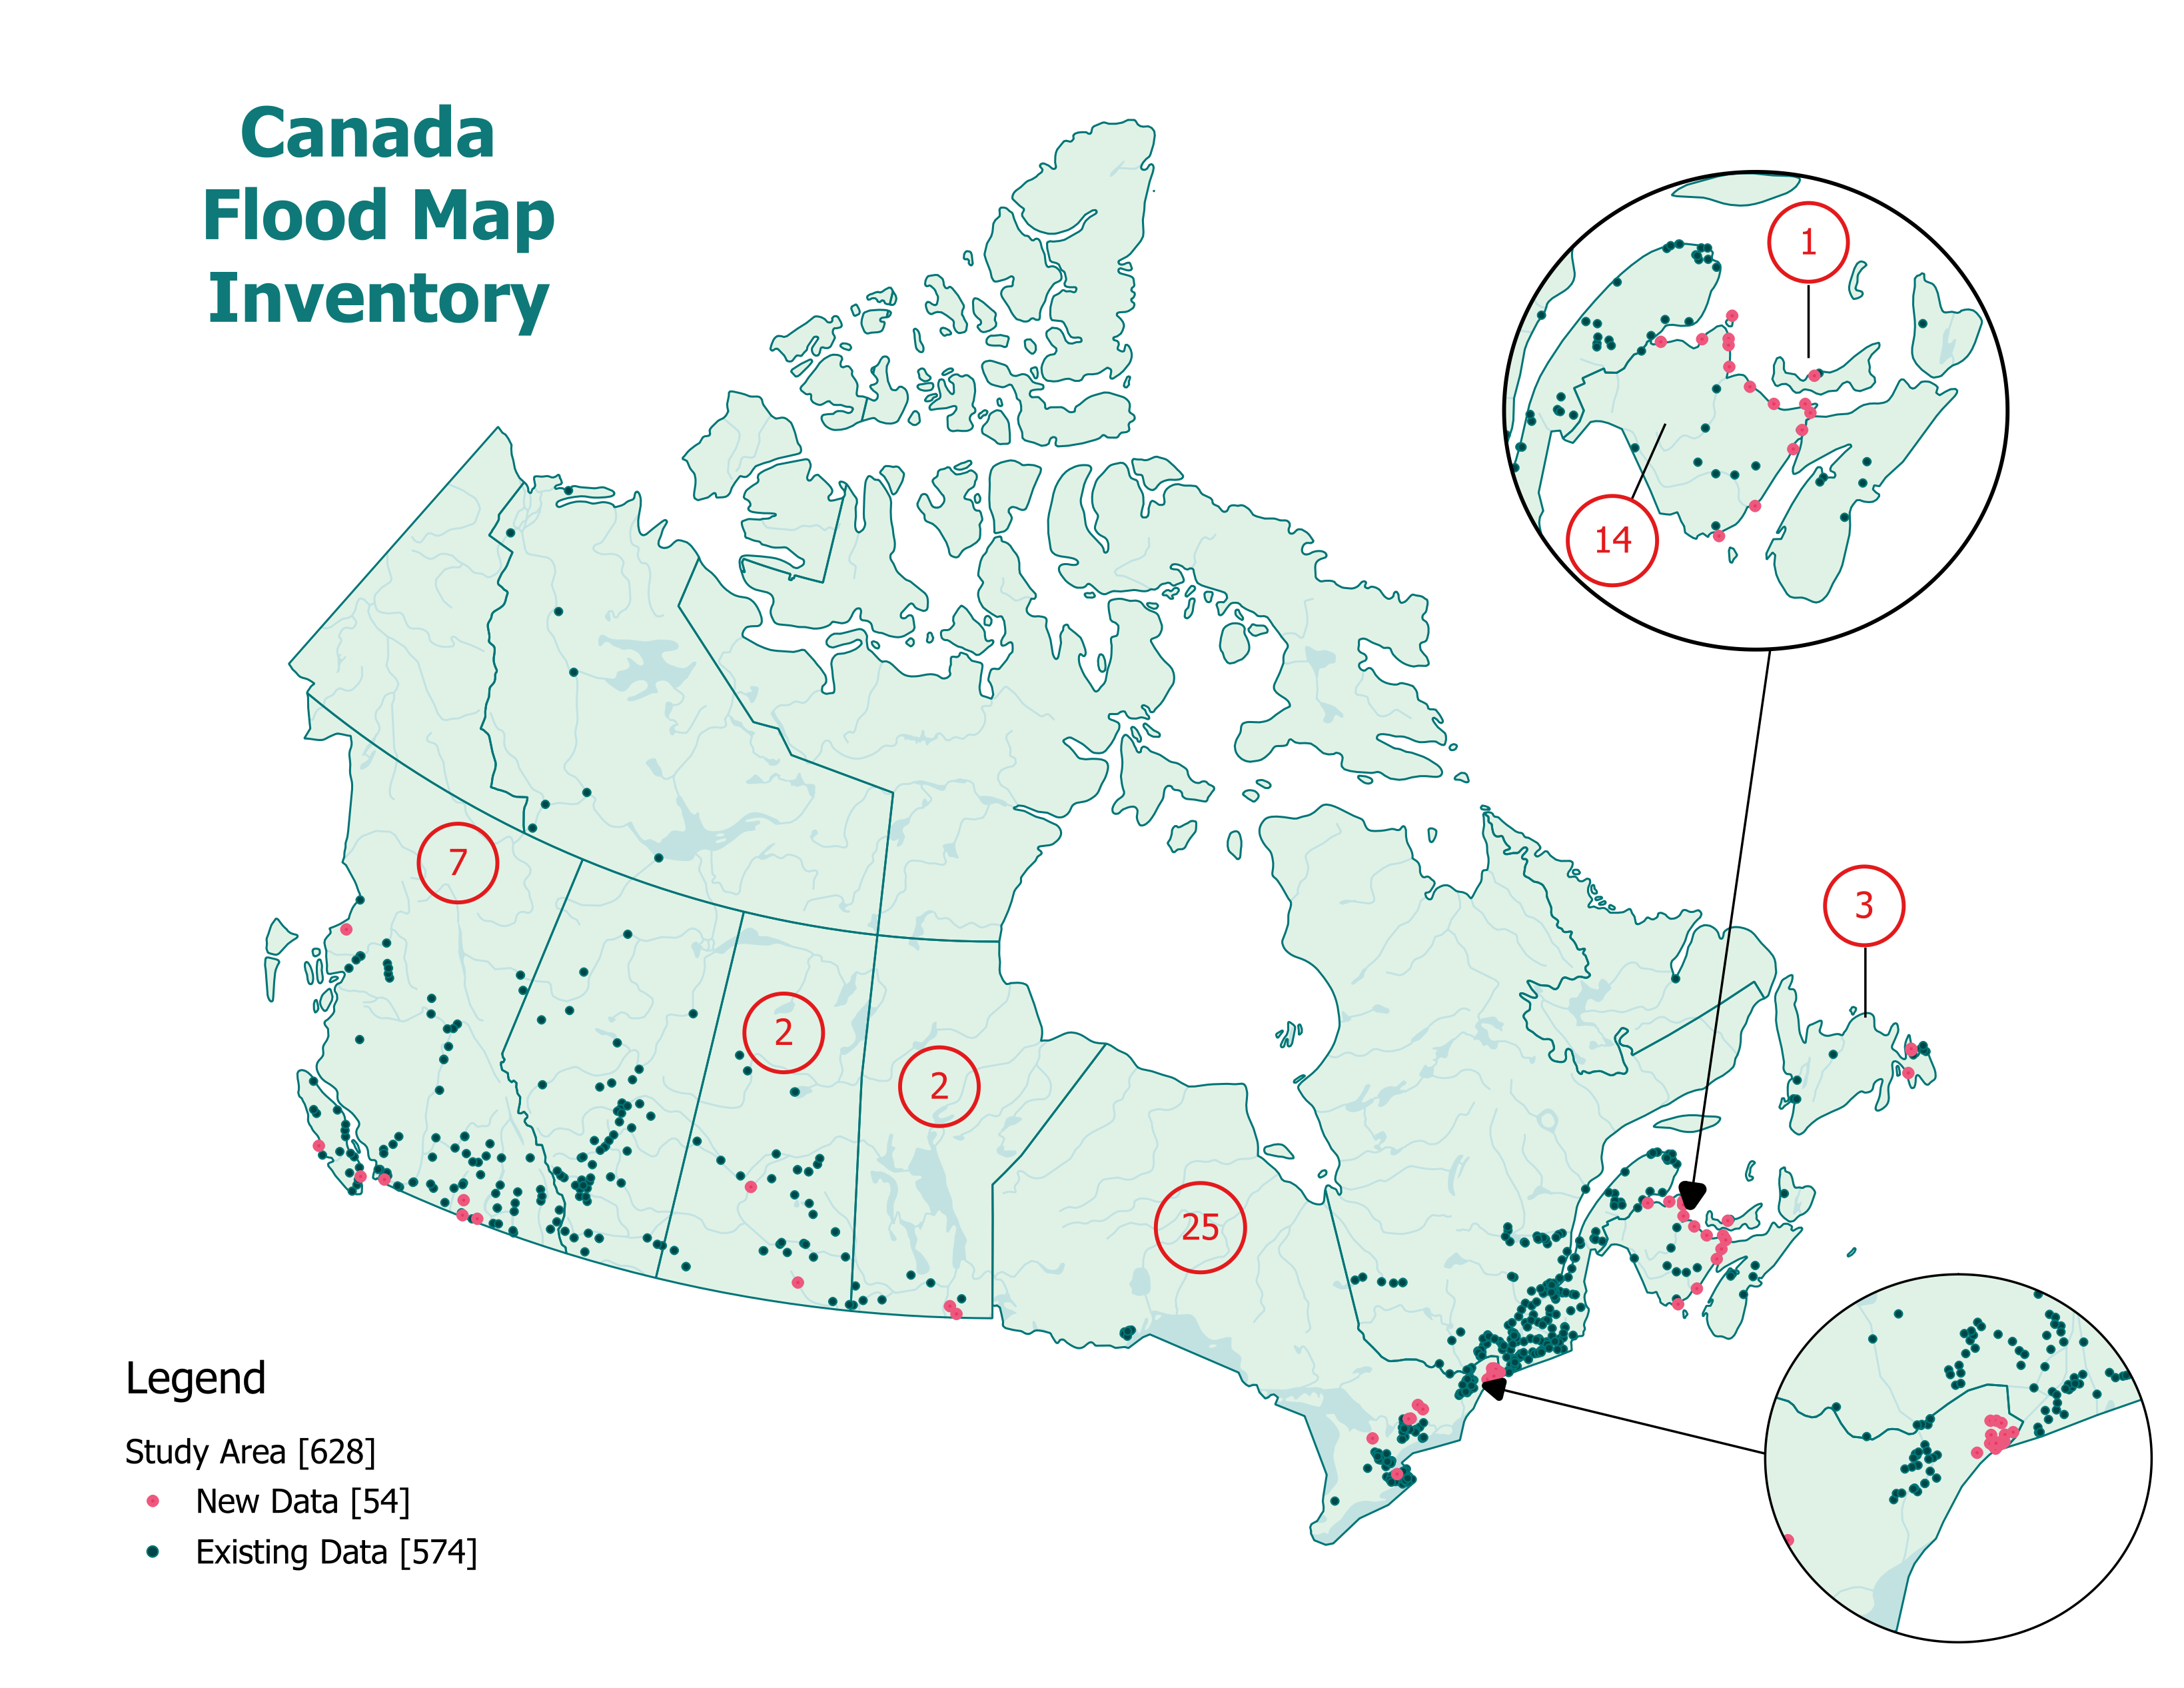
The Canada Flood Map Inventory (CFM) now contains the first 11 studies funded by the Flood Hazard Identification and Mapping Program (FHIMP). Additionally, it includes eight studies funded by the National Disaster Mitigation Program (NDMP), which concluded in 2022. The latest update to the inventory boasts a total of 33 new studies, covering 54 study areas. This layer identifies the owners of flood maps and contains references to official data.

Figure 1. Canada Flood Map Inventory. New data is represented by red dots, and existing data by green dots.
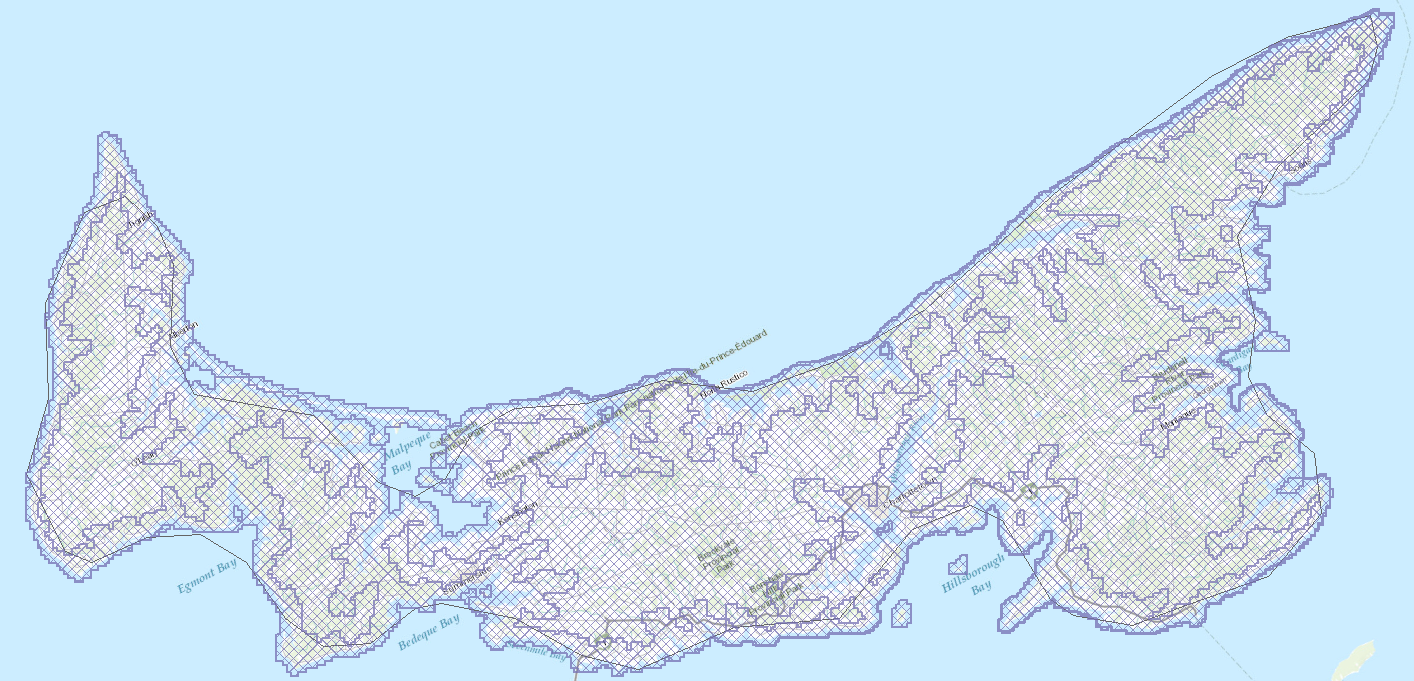
This update encompasses several major cities and communities, such as Charlottetown (PE), Saskatoon (SK), Nisga'a Nation (BC) and Langley (BC). An overview of Prince Edward Island's hazards is now mapped and available via the Climate Hazard and Risk Information System interactive mapping portal (CHRIS, Figure 2).

Figure 2. Flood map coverage for Prince Edward Island.
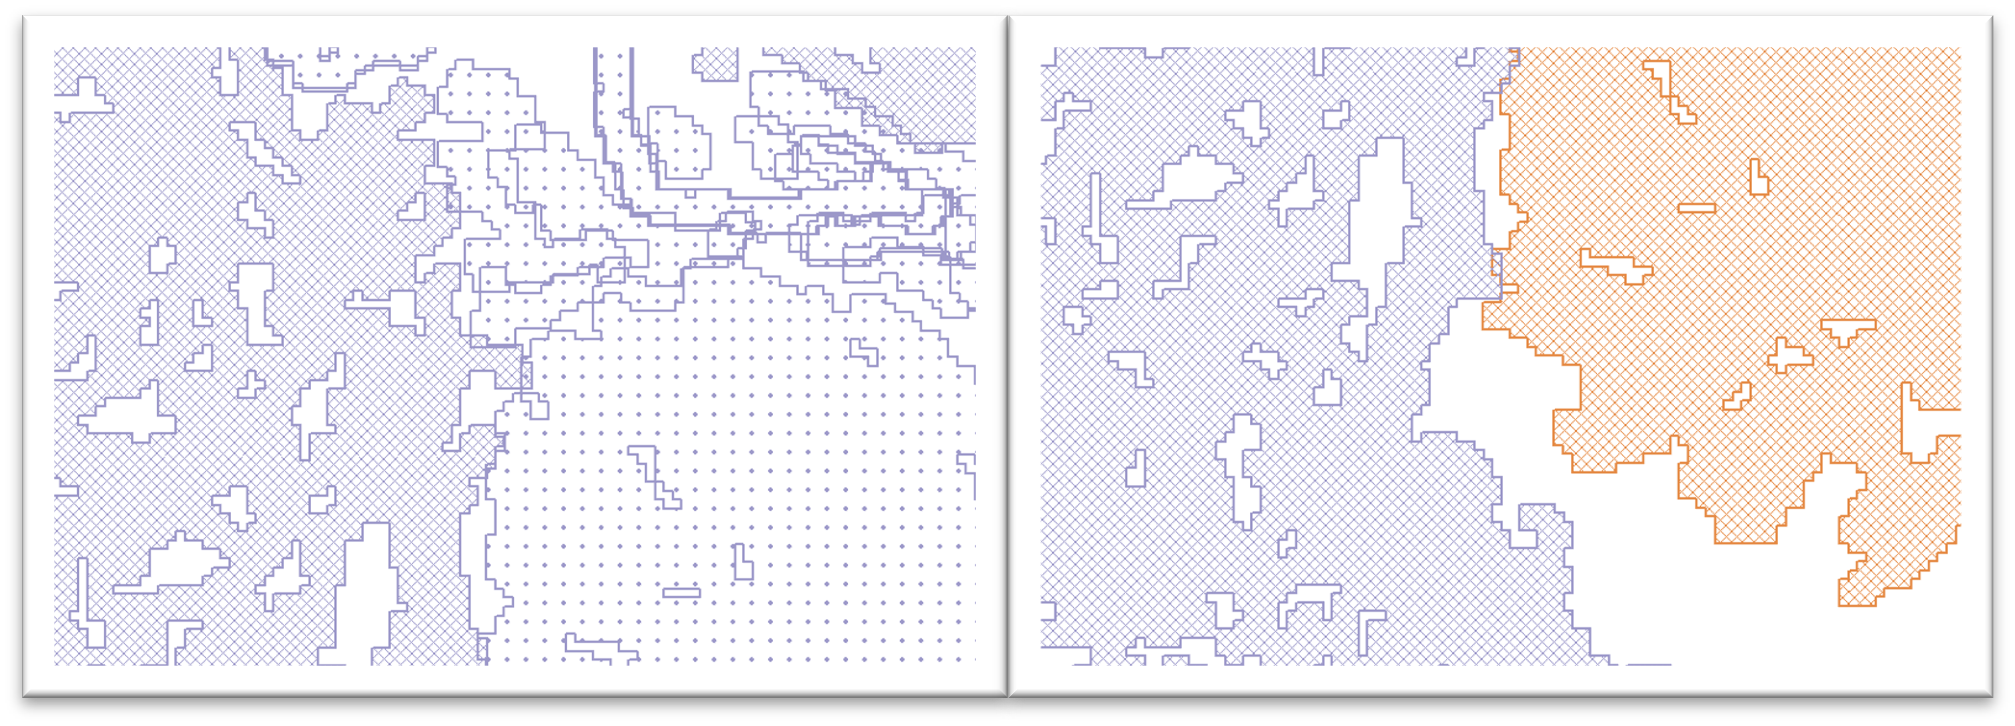
Data availability values have also been simplified. The updated version now features two statuses: fully or partially accessible to the public, and not accessible to the public. It is also now possible to see whether the study is finalized or under review. The study status and data availability were used for the symbology (Figure 3). The purple color indicates that the study status is final, while the orange color indicates that it is under review. The grid pattern represents data that is partially or fully accessible to the public, whereas the dotted lines indicate data that is not accessible to the public.

Figure 3. Difference in symbology between the final (mauve) or under review (orange) status of studies and the accessibility of partially or fully accessible data (grid) or not accessible data (dotted line) to the public.
The publication of these first studies marks a significant milestone for the FHIMP. By adding this data, the program enhances our understanding of flood hazards across Canada, thus contributing to better prevention and mitigation strategies. As more studies are completed and added to the inventory, the program will continue to play a crucial role in safeguarding Canadians against flood hazards.
For more information, please email geoinfo@nrcan-rncan.gc.ca.
Page details
- Date modified: