
Platinum facts

The platinum group metals (PGM) are six metallic elements that have similar physical and chemical properties and that tend to occur together in the same mineral deposits. They are:
- platinum
- palladium
- rhodium
- ruthenium
- osmium
- iridium
Key facts
- Canada is a significant global producer of PGMs, ranking third in palladium production and fourth in platinum production.
- Canada’s PGMs mine production was approximately 710,000 troy ounces in 2022 and is concentrated in Ontario, Quebec and Manitoba.
- Recycling accounts for a notable portion of the global supply of PGMs.
Learn more about platinum group metals
 Uses
Uses
PGMs have strong catalytic properties – meaning they can accelerate or trigger a chemical process without themselves being permanently changed or consumed. Manufacturing of catalytic converters for use in exhaust systems in internal combustion vehicles is the largest use of these metals.
Both platinum and palladium are used in autocatalysts to reduce tailpipe emissions from light vehicles, buses, and medium- and heavy-duty trucks – helping to improve air quality.
Industrial uses of platinum include chemicals, glass, electronics, medical and biomedical, petroleum refining, and jewellery. The end uses of palladium are predominately industrial uses such as chemicals, electronics and dental.
Platinum and palladium are also used for investment purposes, but to a limited extent.
Rhodium is added to three-way (platinum-palladium-rhodium) catalysts for light-duty gasoline vehicles to reduce emissions of nitrogen oxides (NOx).
Iridium and ruthenium end uses include chemical, electronic, and electrochemical uses. Iridium and ruthenium use is expected to grow in hydrogen production and fuel cells.
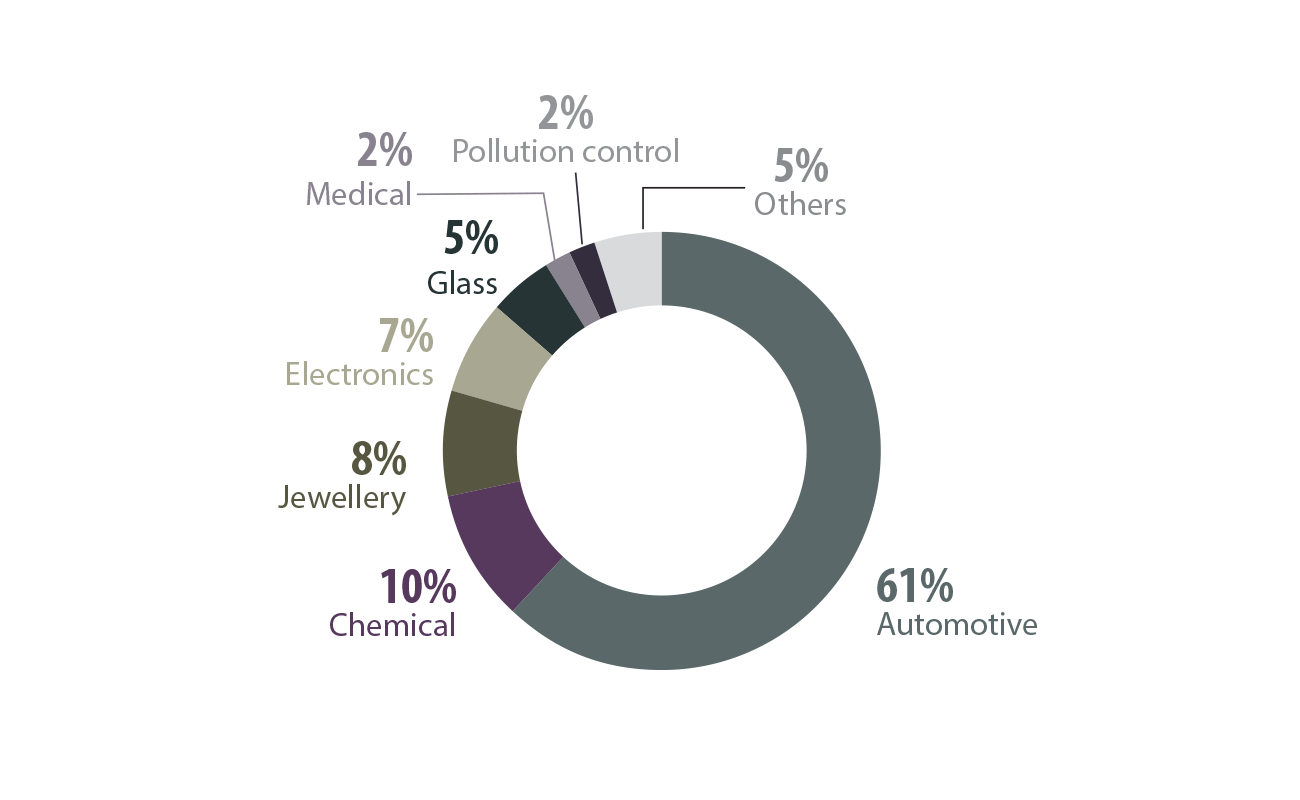
Platinum group metals, global uses, 2022
Text version
This circular chart shows the major industrial uses of PGMs in 2022. The largest use was for automotive (66%) followed by chemical (11%), jewellery (8%), electronics (6%), glass (3%) medical (2%), pollution control (2%), and other uses (2%).
 Production
Canadian mines produced 710,000 troy ounces of PGMs and shipped 705,000 troy ounces of PGMs in 2022. Most of the production occurred in Ontario (78%), with the remainder of production occurring in Quebec, Manitoba, and Newfoundland and Labrador.
Canada has one dedicated PGM mine in western Ontario near Thunder Bay. However, PGMs are also recovered as co-products at many Canadian primary nickel mines. There are currently three advanced exploration projects in northern Ontario that are focused on PGMs as the primary commodities.
Consult a map of producing Canadian mines
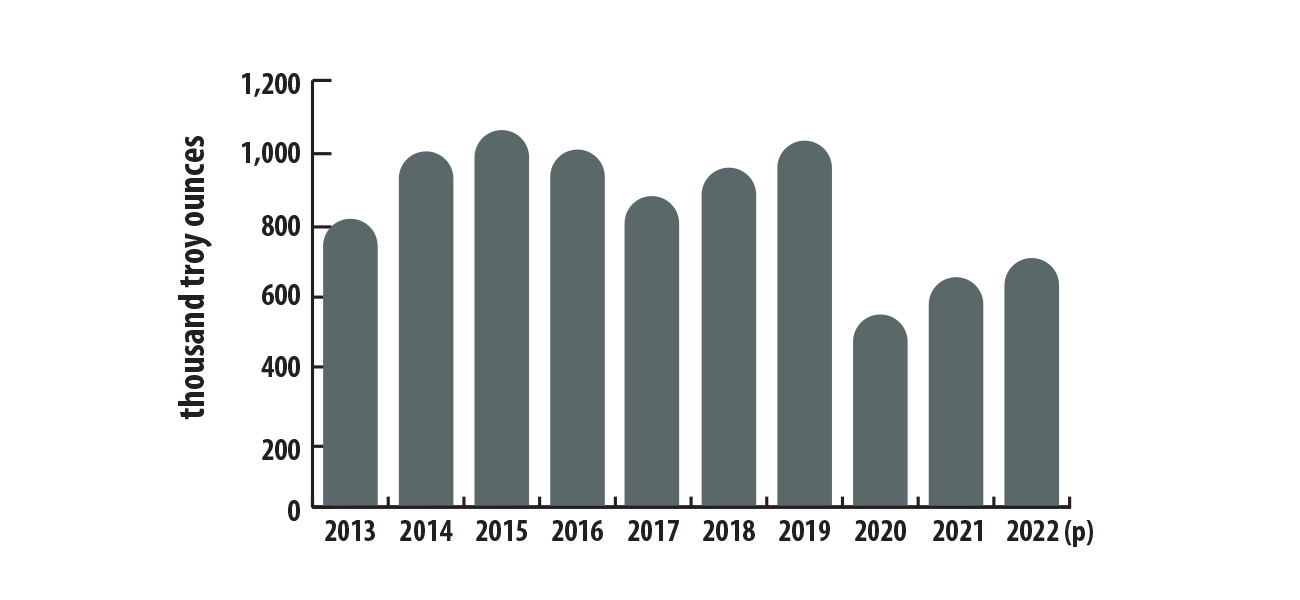
Canadian mine production of platinum group metals, 2013–2022 (p)
Text version
This bar graph shows Canada's annual mine production of PGMs from 2013 to 2022. Production was at 819,000 troy ounces in 2013. Production then increased toward a peak of 1.07 million troy ounces in 2015 before declining to 879,000 troy ounces in 2017. Production increased to 1.04 million troy ounces in 2019 and then decreased to 541,000 troy ounces in 2020. It increased 21% in 2021 to 655,000 troy ounces and 8% in 2022 to 710,000 troy ounces.
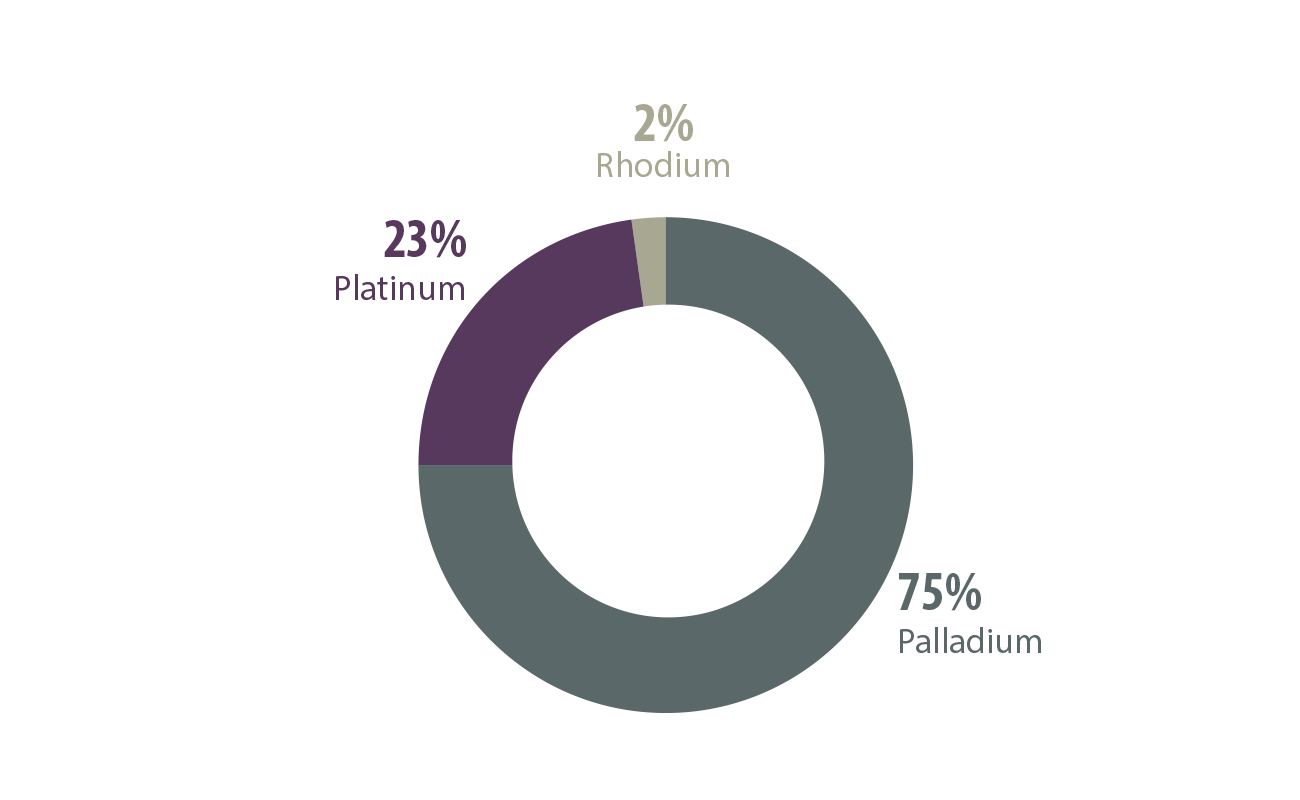
Canadian mine production of platinum group metals, by element, 2022 (p)
Text version
This circular chart shows Canadian mine production of PGMs by percentage by element in 2022: palladium (75%), platinum (23%), and rhodium (2%).
 International context
Canada is the fourth-largest producer of mined PGMs in the world, accounting for approximately 5.5% of global production. An estimated 17.4 million troy ounces of PGMs were supplied globally in 2022, 72% of which was from mined sources, and the balance was from recycling and scrap sources.
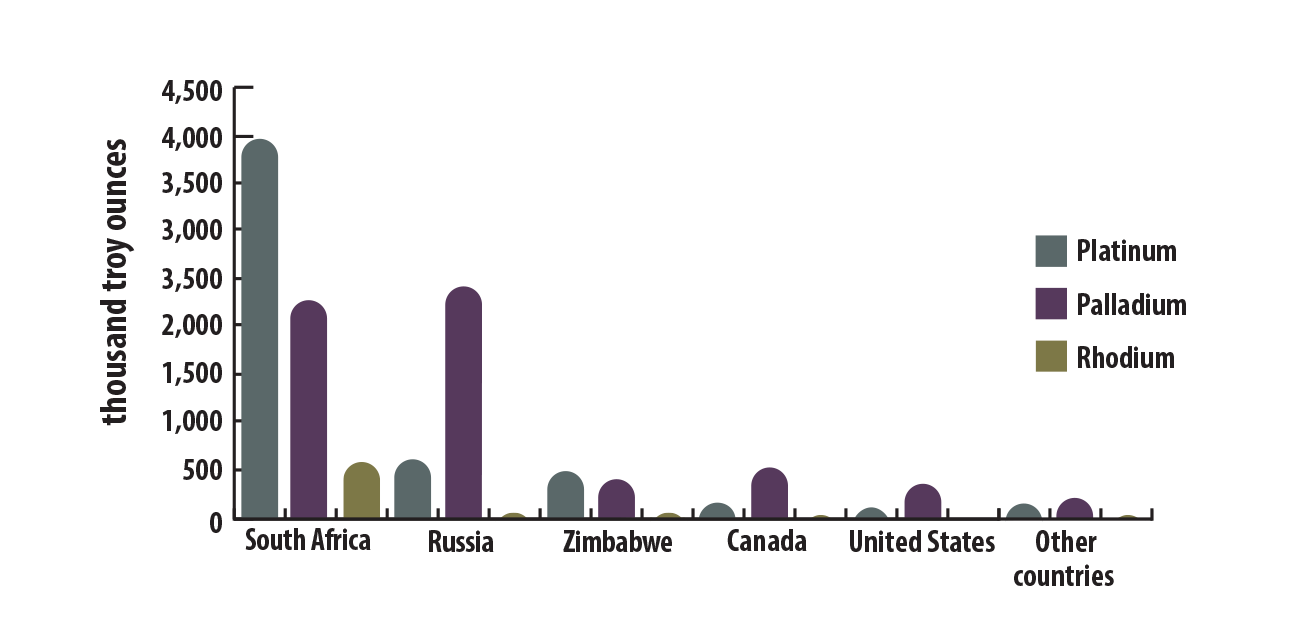
World mine production of platinum group metals, by country, 2022 (p)
Text version
This bar graph shows the world's estimated production in thousands of troy ounces of platinum, palladium, and rhodium, by country, in 2022. The leading producing countries are:
- South Africa (platinum, 3,965,000 oz.; palladium, 2,276,000 oz.; rhodium, 570,000 oz.)
- Russia (platinum, 600,000 oz.; palladium, 2,600,000 oz.; rhodium, 58,000 oz.)
- Zimbabwe (platinum, 488,000 oz.; palladium, 409,000 oz.; rhodium, 43,000 oz.)
- Canada (platinum, 155,000 oz.; palladium, 518,000 oz.; rhodium, 14,000 oz.)
- United States (platinum, 106,000 oz.; palladium, 354,000 oz.)
- other countries (platinum, 216,000 oz.; palladium, 150,000 oz.; rhodium, 10,000 oz.)
| Rank | Country | Palladium (kg) | Platinum (kg) | Total |
|---|---|---|---|---|
| 1 | South Africa | 80,000 | 140,000 | 220,000 |
| 2 | Russia | 88,000 | 20,000 | 108,000 |
| 3 | Zimbabwe | 12,000 | 15,000 | 27,000 |
| 4 | Canada | 16,100 | 4,800 | 20,900 |
| 5 | United States | 11,000 | 3,300 | 14,300 |
| - | Other countries | 2,500 | 4,200 | 6,700 |
| Total | - | 209,600 | 187,300 | 396,900 |
World production of platinum group metals, including recycling, 2013–2022 (p)
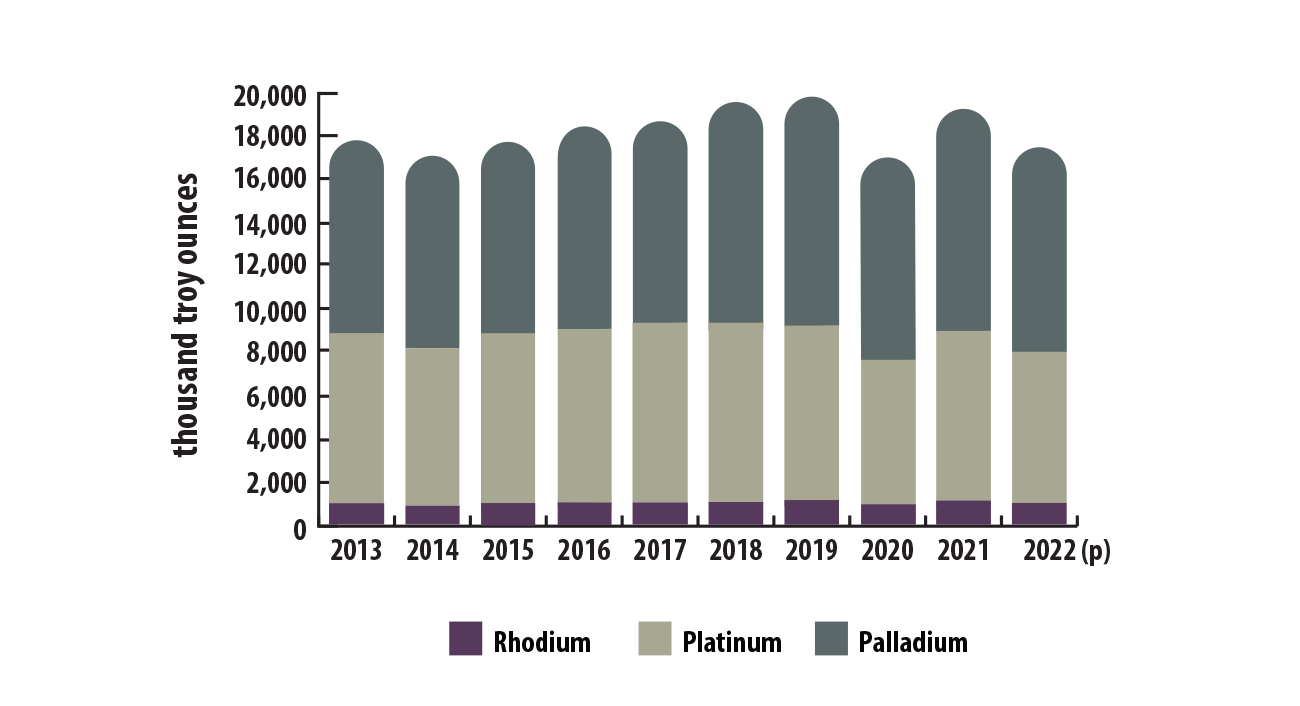
Text version
This bar graph shows the world's annual production of PGMs from 2013 to 2022 (preliminary) consisting of platinum, palladium and rhodium. Production was 17.8 million troy ounces in 2013 and fluctuated between 17.0 and 18.0 million troy ounces until 2015. In 2016, production increased to 18.3 million troy ounces and reached a peak of 19.8 million troy ounces in 2019. Production declined to 16.9 million troy ounces in 2020 because of supply chain disruption during the COVID-19 pandemic. Production increased 13% in 2021 to 19.2 million troy ounces before declining 9% in 2022 to 17.4 million troy ounces.
In 2022, estimates of global proven reserves of PGMs were 70,910 tonnes or 2.3 billion troy ounces and are mostly in South Africa. Canada ranks fifth for known PGM reserves globally at 310 tonnes or approximately 10 million troy ounces.
| Rank | Country | Tonnes | Percentage of total |
|---|---|---|---|
| 1 | South Africa | 63,000 | 88.8% |
| 2 | Russia | 5,500 | 7.8% |
| 3 | Zimbabwe | 1,200 | 1.7% |
| 4 | United States | 900 | 1.3% |
| 5 | Canada | 310 | 0.4% |
| - | Other countries | N/A | N/A |
| Total | - | 70,910 | 100.0% |
 Trade
Trade
Exports
In 2022, Canada’s domestic exports of refined (Stage 2) and semi-fabricated (Stage 3) PGM products totaled 7,076 kg and were worth $507 million, which is a 22% decrease in value and a 3% decrease in volume from 2021. Of those products, 86% were palladium-based, 14% were platinum-based, and 0.2% were rhodium-based, representing 91%, 9%, and 0.1% of the value of domestic exports, respectively.
- Products destined for the United States accounted for 77% of the total value of domestic exports of unwrought, powder or semi-manufactured PGMs. Switzerland accounted for 22%, and five other countries account for the remaining 1%.
- Quebec exported 89% of the value of Canadian domestic exports of these products, worth $454 million, and Ontario exported 10%, worth $53 million.
Imports
In 2022, Canada’s imports of refined (Stage 2) and semi-fabricated (Stage 3) PGM products totaled 23,540 kg worth $2.8 billion, which is a 1% increase in value and a 16% increase in volume from 2021. Of those products, 78.9% were palladium-based, 12.8% were platinum-based, 7.5% were rhodium-based, and the remaining 0.8% were iridium-, osmium- and ruthenium-based, measured by volume, representing 69.2%, 3.5%, 27.2%, and 0.1% of the value of imports, respectively.
- Most of the import value came from South Africa (40%), the United States (27%), Belgium (12%), Italy (8%), South Korea (6%), and Germany (4%).
 Prices
Platinum prices experienced a moderate increase in the first quarter of 2022, peaking at an average of US$1,049 per troy ounce in February 2022. The price then decreased to US$869 per troy ounce by July 2022, before increasing to US$1,011 by December 2022. Prices were impacted by a combination of factors in 2022, which resulted in an overall decline in both supply and demand.
- On the supply side: South Africa, the largest global producer of platinum, reduced its production because of operational challenges at some mining and smelting operations. Additionally, the supply of secondary PGMs from autocatalyst recycling decreased because of soaring used car prices, which resulted in fewer older vehicles being scrapped for materials.
- On the demand side: Increased platinum demand in the automotive and industrial (chemical and fibreglass) sectors were offset by decreased demand in the jewellry fabrication and the investment markets.
The price of palladium rose sharply in first quarter of 2022, reaching a peak of US$2,583 in March. The rise was caused by concerns about potential disruptions in the Russian supply of palladium and about consumers stockpiling palladium following the Russian invasion of Ukraine. However, the supply improved as the year progressed, so the price of gradually declined to US$1,830 by December 2022.
Because rhodium became expensive, manufacturers found less expensive substitutes for the rhodium content in equipment used in fibreglass production. Consequently, the non-automotive demand for rhodium reached a 30-year low.
Platinum, monthly average prices, 2013–2022
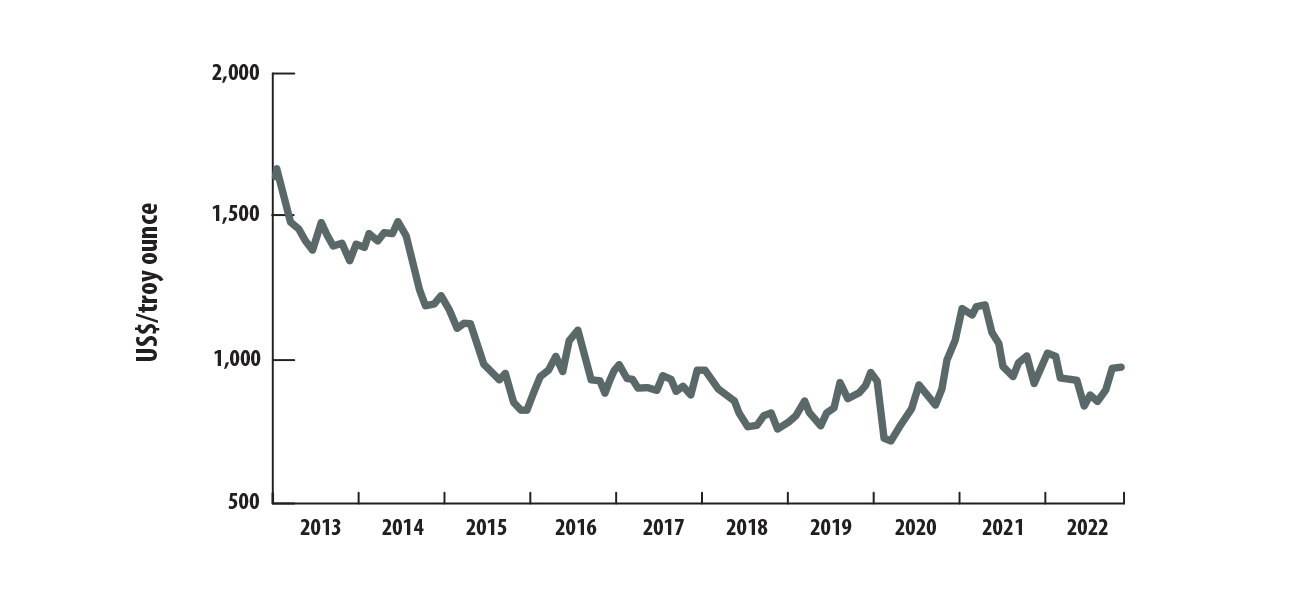
Text version
This line graph shows the monthly average price in American dollars per troy ounce of platinum from 2013 to 2022. The average annual price of platinum was $1,487 per troy ounce in 2013. Prices fluctuated between 2013 and 2016 but decreased overall in that time. Between 2016 and 2020, prices flattened, moving between $700 per troy ounce to just over $1,000 per troy ounce. In 2021, the average annual price was $1,091 per troy ounce. Prices increased to a peak of $1,049 per troy ounce in the first quarter of 2022, then decreased to $869 per troy ounce by July 2022, before increasing again to $1,011 per troy ounce by December 2022. The annual average was lower than the previous year at $962 per troy ounce for 2022.
Palladium, monthly average prices, 2013–2022
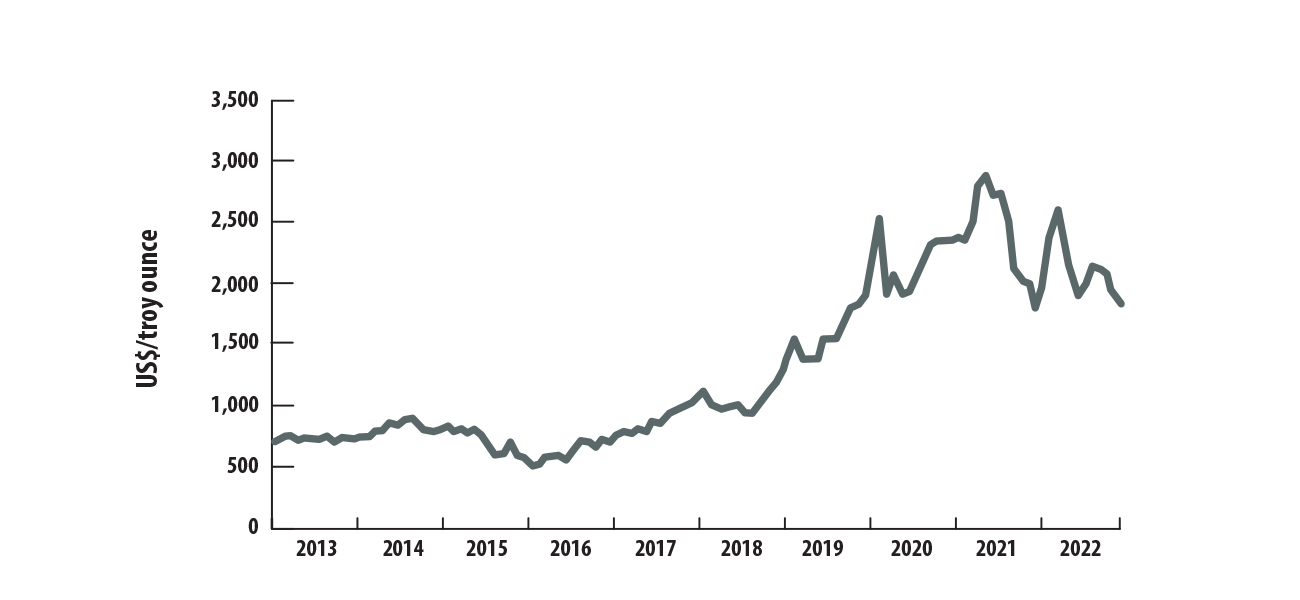
Text version
This line graph shows the monthly average price in American dollars per troy ounce of palladium from 2013 to 2022. The average annual price of palladium was $725 per troy ounce in 2013. Prices were relatively stable from 2013 to 2016, with average monthly prices ranging between $498 and $876 per troy ounce.
Palladium prices increased after 2016, with average annual prices per troy ounce of $869 in 2017, $1,036 in 2018 and $1,572 in 2019. In 2020, the price peaked at $2,525 early in the year before the COVID-19 pandemic, then dropped to a low of $1,902 by May 2020. The price of palladium was marked by extreme volatility from 2020 to 2022, with average monthly prices ranging between $1,789 and $2,870. The average annual prices per troy ounce were $2,177 in 2020, $2,397 in 2021, and $2,108 in 2022.
 Recycling
In 2022, 4.9 million troy ounces of PGMs were recovered from the recycling of products such as autocatalytic converters, electrical scrap and jewellery. Recycling accounted for 28% of the total global supply of PGMs in 2022, with the balance coming from mining. The high values of PGMs and their high concentrations in recyclable materials contribute to the elevated levels of PGM recycling.
World supply of platinum group metals, by source, 2022
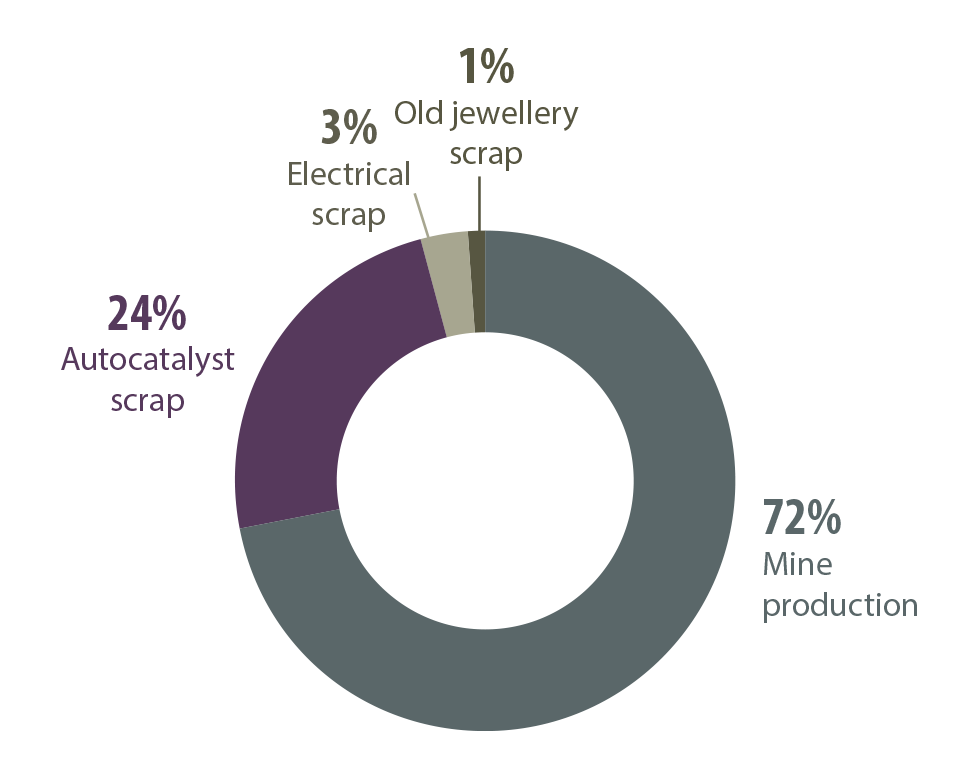
Text version
This pie chart shows the world supply of platinum group metals as a percentage, by source in 2022. The largest source was mine production (72%), followed by recycling sources including autocatalyst scrap (24%), electrical scrap (3%), and old jewellery scrap (1%). Recycled sources together accounted for 28% of production.
Notes and sources
(p) preliminary
Totals may be different because of rounding.
All dollars are Canadian unless indicated otherwise.
Uses
- Platinum group metals, global uses, 2022
- Johnson Matthey, PGM market report, May 2023
Production
- Canadian mine production of platinum group metals, 2013–2022 (p)
- Natural Resources Canada
- Canadian mine production of platinum group metals, by element, 2022 (p)
- Johnson Matthey, PGM market report, May 2023
- United States Geological Survey; Mineral Commodity Summaries 2023
International context
- World mine production of platinum group metals, by country, 2022 (p)
- Johnson Matthey, PGM market report, May 2023
- World mine production of platinum and palladium, by country, 2022 (p)
- United States Geological Survey; Mineral Commodity Summaries 2023
- World production of platinum group metals, including recycling, 2013–2022 (p)
- Johnson Matthey, PGM market report, May 2023
- World reserves of platinum group metals, by country, 2022 (p)
- U.S. Geological Survey
Trade
- Natural Resources Canada
- Mineral trade includes unwrought, powders, and semi-fabricated mineral products (HS codes: 711011, 711019, 711021, 711029, 711031, 711039, 711041, 711049).
Prices
- Johnson Matthey, PGM market report, May 2023
- Platinum, monthly average prices, 2013–2022
- World Bank
- Palladium, monthly average prices, 2013–2022
- London Metal Exchange
Recycling
- World supply of platinum group metals, by source, 2022
- Johnson Matthey PGM market report, May 2023
Page details
- Date modified: