Clearcutting in the forest
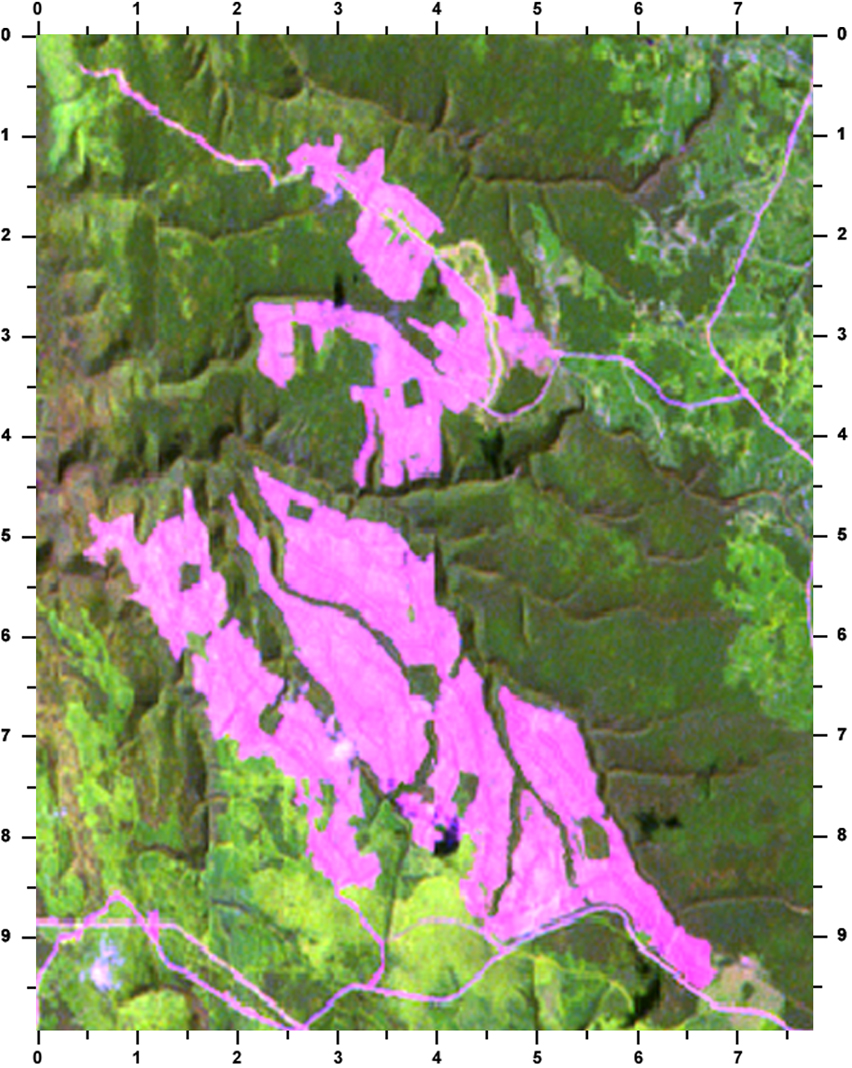
In the satellite image below, we use those bands of the electromagnetic spectrum which best show the forest types in this area, as well as the clearcutting that has taken place and the forest re-growth that is occurring. "Clearcutting" means that all of the trees in an area are cut, not just selected trees. The standing forest of coniferous trees is shown as dark green, the bare ground (areas that have been recently cut) shows as pink, and the newly growing trees (and grasses and bushes) are yellow in colour. Notice also, that the logging roads (used by the logging trucks) are pink; where they cross the clearcut areas, they are a darker pink. A number of river valleys crisscross this area, and of course, extend into some of the clearcuts.

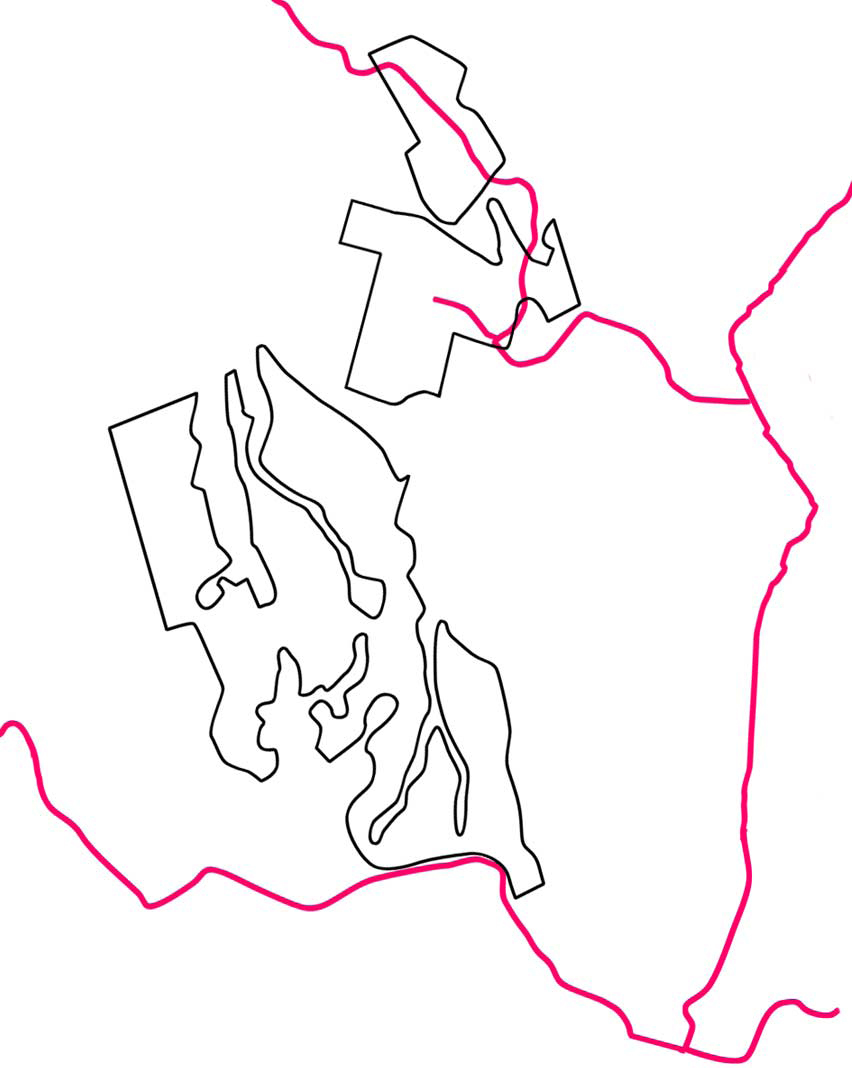
Below, you will find a map. The red lines show some of the roads that you can also see on the satellite image. The black outlines on the map indicate where the logging company was allowed to cut the trees last year.
Map of "Allowable Cuts"
Black lines: outlines of areas that may be cut
Red lines: roads

| Step A |
| Find in the satellite image: standing forest, clearcut areas, logging roads, forest re-growth areas, river valleys. |
| Step B |
| Trace the lines on the map onto a sheet of acetate. Use a different colour for roads and for the "allowable cut" area outlines. |
| Step C |
| Place the acetate (with the lines you've traced) onto the satellite image. Fit the two together by matching the road lines from the acetate, to the roads as seen on the satellite image. Remember that while the satellite image shows all of the existing roads, only some of them are on the map. Only match the roads; don't try to match the clearcut areas. |
| Step D |
| Once the roads are matched between the acetate and the satellite image, check how the "allowable cut" areas on the acetate match the actual clearcuts on the satellite image. Can you find some areas where the company was allowed to cut but didn't? Can you find some areas where the company wasn't allowed to cut but did? Identify them (non-permitted cuts only) by giving the coordinates of the middle of each such area, using the number grid on the edges of the image. Answer: (___, ___) (___, ___) (___, ___) |
| Step E |
| How many square kilometres were cut outside the "allowable cut" areas? Use the dot grid technique in Appendix A to measure those areas. Each five dots that you count, will represent 1 square kilometre. Answer: ________________ sq. km. |
Page details
- Date modified: