
Oceans applications
SAR images can be used to detect and monitor a range of physical processes and phenomena, both natural and man-made that modulate the ocean surface roughness. Surface winds are the most important factor affecting ocean surface roughness. Rough surfaces typically have higher backscatter compared to smoother surfaces. The ocean surface roughness can be related to a number of atmospheric phenomena such as convective cells, atmospheric fronts, rain cells (Figure 9-49) and atmospheric gravity waves to name a few; and oceanic phenomena associated with currents, e.g., oceanic eddies, internal waves, water mass boundaries, and surface gravity waves. Other ocean surface features are related to either biogenic and/or anthropogenic ocean surface films, which damp small scale surface waves leading to a lower backscatter than that from surrounding areas.
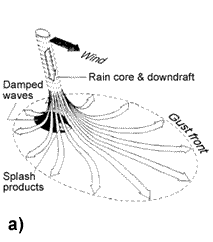
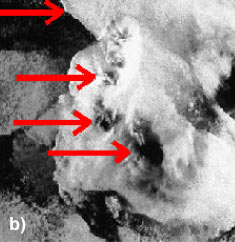
Figure 9-49. a) Schematic sketch of the downdraft of a rain cell, spreading over the sea and causing roughening of the sea surface ![]() , b) Rain cells imaged by ERS-1, showing gust fronts (high backscatter) and areas where bragg waves are damped (low backscatter) by the ocean surface layer turbulence generated by heavy rainfall, (Source : http://www.ifm.uni-hamburg.de/en/search.html?q=ERS%2FSAR).
, b) Rain cells imaged by ERS-1, showing gust fronts (high backscatter) and areas where bragg waves are damped (low backscatter) by the ocean surface layer turbulence generated by heavy rainfall, (Source : http://www.ifm.uni-hamburg.de/en/search.html?q=ERS%2FSAR).
The following sections will illustrate how multi-polarization and polarimetric SAR data and analyses can help with ocean applications.
Study of marine winds
SAR images of the ocean surface often show the impact of atmospheric phenomena due to the interaction of the near surface wind field and the ocean surface roughness. In general, the higher the near surface wind speed the rougher the ocean surface becomes, resulting in increased radar backscatter and brighter image tones. This relationship is key to deriving wind information from SAR data.
The microwave signatures for ocean surface roughness with scales on the order of the radar wavelength are due mainly to Bragg scattering. Due to the increased sensitivity of the backscatter to the surface capillary waves, VV polarization is preferred for wind speed estimation when compared to HH. However, imagery obtained with HH polarization may be more suitable for monitoring other oceanic phenomena such as internal waves, currents, and bathymetry (as illustrated in Figure 9-50).
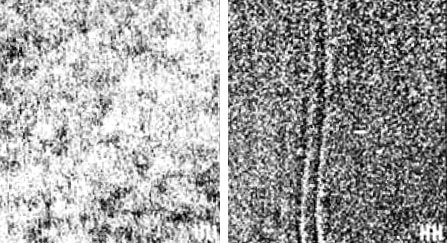
Figure 9-50. An illustration of polarization sensitivity to atmospheric and oceanic phenomena from real aperture radar data acquired at 13.3 GHz. a) This VV polarization image is dominated by atmospheric signatures, in this case wind speed variability and convective cells; b) Meanwhile, this simultaneously acquired HH polarization image shows evidence of oceanic phenomena, in this case internal waves (from ![]() ).
).
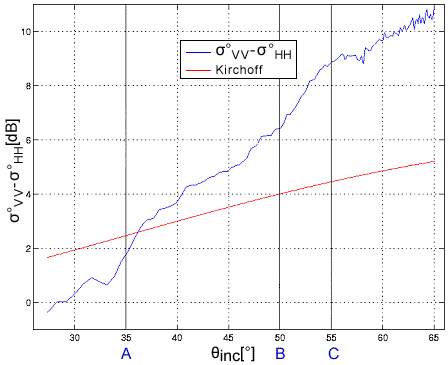
In general, for estimating information on winds and waves, the signal obtained in cross-polarized imagery is very low. This may result in the signal being close to or below the noise floor for spaceborne SAR systems, thus making the cross-polarized channel of little use for observation of marine phenomena. However, the potential of using imagery at HH and VV synergistically for wind and wave estimation has been demonstrated using C-SAR data from the CV-580 (Figure 9-51), as well as for estimation of the C-band co-polarization ratio, (Figure 9-52). The differences in the structures of the wave number spectra from the VV and HH channels, especially along the range wavenumber axis, illustrates the potential for improving ocean information estimation using imagery acquired at two polarizations. These studies showed that the C-VV and C-HH model functions are in reasonable agreement over the RADARSAT-2 incident angle range and that the Kirchoff-based C-band co-polarization ratio agrees well with observations. Thus, the dual channel, like polarization RADARSAT-2 mode may be attractive for ocean surface observation.
| Interlook cross-spectrum of HH image | Interlook cross-spectrum of VV image |
|
|
|
CV580,L3P3,27June2000-16:31,Lake Superior,Polarization Ratio,AziLines 2049:4096
A = boresight - 20° B = Far Edge of Nominal Swath C = CV580 boresight
Figure 9-52. Plot of C-band co-polarization ratio from C-SAR data acquired by the CV-580 over a NOAA buoy on Lake Superior in June 2000, along with a Kirchoff-based scattering C-band co-polarization ratio (courtesy CCRS).
Oil slick detection
The SAR signal is sensitive to the roughness of the sea surface, which is modulated by wind speed and direction; imagery acquired at VV polarization is the most sensitive to wind speed variability. The suppression of the capillary waves by oil from either anthropogenic sources, such as an oil spill, or from natural biological slicks, reduces the surface roughness resulting in less radar backscatter and darker image tones. The detection of oil slicks has been found to be best in moderate wind conditions in the range of 3 to 10 m/s. Oil spill images are available from both HH (Figure 9-53) and VV polarization systems (Figure 9-54); examples are provided below.
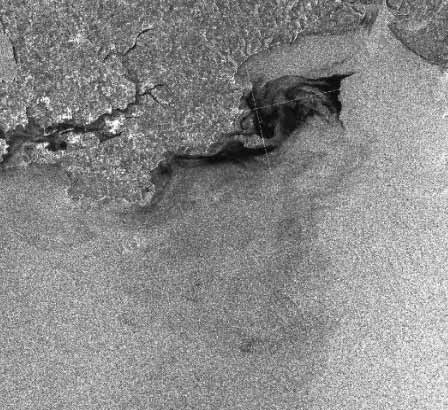
Figure 9-53. RADARSAT-1 C-HH image of an oil slick off the coast of Wales (United Kingdom), from February 1996. Source: CEOS 2000
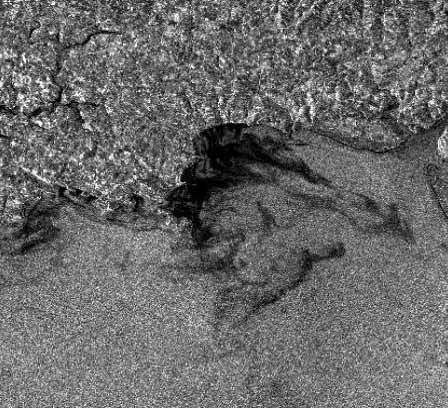
Figure 9-54. ERS-1 C_VV image of the same oil slick off the coast of Wales (United Kingdom) from February 1996. Source: CEOS 2000
Although imagery in both VV and HH polarizations can be used for slick detection, the VVimagery is preferred as, in general, it offers a better signal to clutter ratio than other polarization choices (i.e., HH, VH, or HV). This is summarized in Table 9-3. Although VV is more sensitive than HH for slick detection, there may not be any advantage to using the co-polarized or cross-polarized signatures as oil-free and oil-covered surfaces tend to have similar contrast and polarization ratios (Figure 9-55) in these two cases. Slick thickness and the inability to differentiate oil slicks from "look-alikes" such as areas of low-wind, grease ice, or biological surfactants remain problematic.
| Polarization | Water | Oil-covered Water | SAR noise floor | Contrast |
|---|---|---|---|---|
| VV | -20 dB | -28 dB | -30 dB | 8 dB |
| HH | -24 dB | -32 dB | -30 dB | 6 dB |
| HV | -30 dB | -38 dB | -30 dB | 0 dB |
Table 9-3. Hypothetical radar backscatter values for water, oil-covered water, and the SAR noise floor illustrating the improved contrast at VV polarization for oil slick detection. (CCRS, Polarimetry Tutorial, IGARSS'02).
|
Co-pol Response |
Cross-pol Response |
|---|---|
|
Co-pol Response |
Cross-pol Response |
|
|
|
 = Normalized
  = Ellipticity Angle
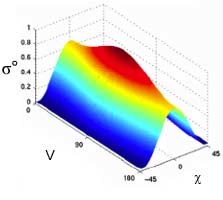
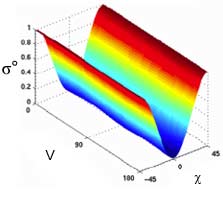
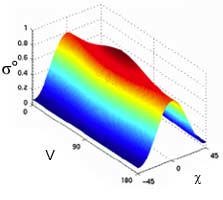
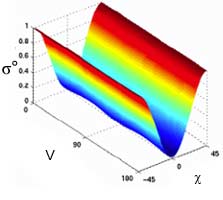
Figure 9-55. C-band co-and cross-polarization signatures from SIR-C data acquired over an oil spill off the coast of Japan on April 16, 1994 showing little difference in slick-covered water (bottom) and open water (top), as suggested from polarization sensitivity analyses (CCRS, Polarimetry Tutorial, IGARSS'02).
Ship detection
It has been demonstrated that RADARSAT-1 data in combination with an automated target detection system can provide operational detection reliability (up to 95%) using those beams that are best suited to ship detection. Ship detection using SAR relies either on the detection of the ship itself or detection of the ship wake. C band imagery in HH polarization is preferred for detecting the ship because the ship-sea contrast is usually higher for HH polarizations due to the increased scatter at VV by the surface capillary waves. This results in lower background clutter at HH polarization. Conversely VV is preferred for wake detection as the lower backscatter at HH decreases rapidly with increasing incidence angle, resulting in ship wakes rarely being seen in HH polarized images. Figure 9-56 illustrates this using RADARSAT-1 and ERS-1 SAR imagery.
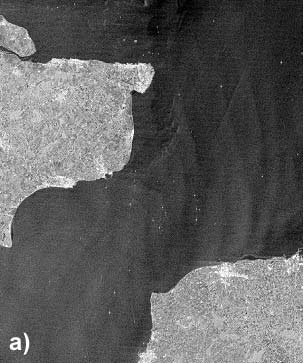
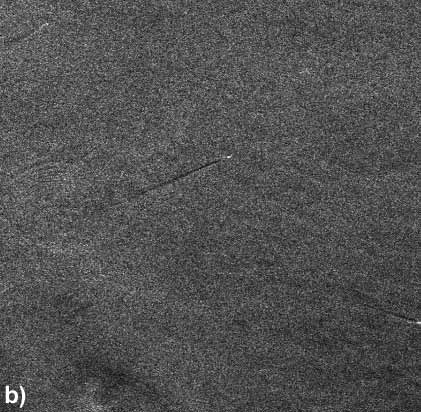
Figure 9-56(a & b). a) RADARSAT-1 C-HH image and b) ERS-1 C-VV image showing enhance ship detection at HH and better wake detection at VV ![]() .
.
Multi-polarization and polarimetric data are expected to allow the user to exploit various polarization combinations to optimize ship detection applications. For example for ship surveillance a VV and VH combination would be optimal as the VH channel provides point target information against a very dark clutter background. At the same time the VV polarization will provide adequate ocean surface backscatter to allow for wake analyses. Since the interaction mechanism between ship and sea is double bounce scattering it is expected that RR, or right-right circular polarization will also be a good polarization for ship signature enhancement.
Polarimetric data are expected to improve ship target detection and possibly classification. However it will only be suitable for ship tracking or perhaps surveillance in certain regions limited in size and strategically or commercially important for ship traffic, due to limited swath coverage. Polarimetric decomposition and classification by scattering mechanism is an exciting application of polarimetric data for ship detection. Polarization entropy is particularly promising, especially for incidence angles less than 60° where ships are only weakly visible in HH polarization images. This is clearly illustrated in HH and Polarization entropy images that show the enhanced ship-sea contrast in Figure 9-57. Since the incidence angles for the RADARSAT-2 sensor are less than 60°, the polarization entropy followed by circular polarization (RR), cross polarization (HV/VH), and HH polarization will provide the best opportunities for ship detection (Figure 9-58).
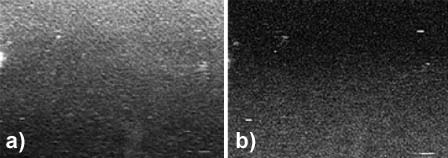
Figure 9-57. a) C-HH image and b) corresponding polarization entropy image of an area off the coast of Nova Scotia showing improved ship detection using the polarization entropy. Data from C-SAR on Canadian CV-580 ![]()
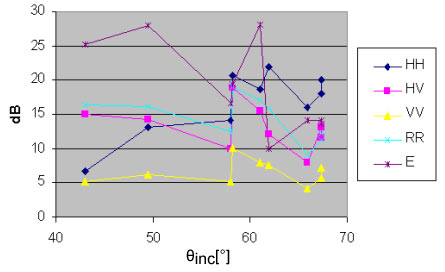
Figure 9-58. Ship-sea contrast as a function of incidence angle for all linear polarization, RR polarization and polarization entropy (van der Sanden and Ross, [61]). ![]()
Page details
- Date modified: