
Forestry Applications
There is an ongoing need to understand and quantify the state and dynamics of forests both regionally and globally. Required information includes forest type mapping, identification of clear cuts, and recent burns, and the extraction of a variety of biophysical parameters such as total biomass and tree age.
Use of polarimetric data is anticipated to improve the detection of structural differences between forest canopies and thus to help in forest type mapping and provision of additional information for other forest management applications. Figure 9-26, a multi-polarization false color composite of an area east of Ottawa, illustrates the increased information content for forest identification.
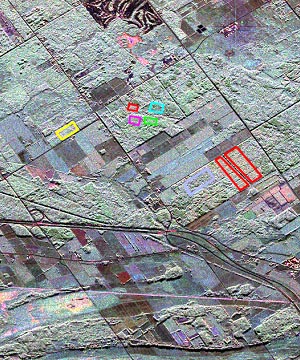
Figure 9-26. . False colour composite image of the Mer Bleue study site near Ottawa , showing six forest areas with different species composition (C-SAR data, Red: HH, Green: HV and Blue: VV).Courtesy of CCRS.
Frequency dependence
The usefulness of SAR data for the extraction of biophysical parameters is most dependent on frequency. Microwaves at lower frequencies such as L-band (2.0-1.0 GHz) and P-band (1.0-0.3 GHz) are better able to penetrate the canopy and interact more extensively with its structural components (leaves, branches, trunks). Microwaves at higher frequencies (C-band, 3.8 - 7.5GHz) tend to interact primarily with the upper portion of the canopy. The sensors at higher frequency therefore have a more limited potential use in the discrimination of variations in dry biomass whereas it is expected that L-band data and P-Band data can be used to discriminate increasing biomass variations.
9.3.2 Polarization Dependence
Le Toan et al., 1992 ![]() showed that the dynamic range of backscatter over uniform pine stands had a strong variation with polarization e.g., the dynamic range for such data obtained at P-band for the HV polarization was approximately 15 dB, at HH approximately 11 dB, and at VV approximately 4.8 dB. At L-band, the dynamic range was reduced , with a dynamic range of approximately 8.6 dB at HV, approximately 5.3 dB at HH and approximately 4.6 dB at VV. At C-band the dynamic range was significantly lower, with data for the HV polarization showing the greatest range (approximately 4 dB) and those in HH and VV polarizations showing a dynamic range of only 2dB.
showed that the dynamic range of backscatter over uniform pine stands had a strong variation with polarization e.g., the dynamic range for such data obtained at P-band for the HV polarization was approximately 15 dB, at HH approximately 11 dB, and at VV approximately 4.8 dB. At L-band, the dynamic range was reduced , with a dynamic range of approximately 8.6 dB at HV, approximately 5.3 dB at HH and approximately 4.6 dB at VV. At C-band the dynamic range was significantly lower, with data for the HV polarization showing the greatest range (approximately 4 dB) and those in HH and VV polarizations showing a dynamic range of only 2dB.
It is believed that the backscatter for the HV polarization at longer wavelengths can be more effectively used to characterize forest biomass as shown in the work of Dobson et al.![]() (e.g. Figure 9-27.)
(e.g. Figure 9-27.)
C-Band
L-Band
Figure 9-27. Calibrated C-band and L-band backscatter as a function of total above ground biomass (tons/ha) of maritime pine and loblolly pine plotted on a logarithmic scale (from ![]() ).
).
Polarimetric parameters
9.3.3.1 Co-polarization Signatures
Polarimetric data may provide unique information on forest canopies related in particular to canopy architecture and the consequent scattering mechanisms. Backscatter mechanisms include direct backscatter from branches (single bounce/volume scattering), backscatter from trunks (single bounce), scattering from branch-ground interaction (double bounce), scattering from trunk-ground interaction (double bounce), and direct backscatter from the ground (surface scattering). The relative contribution of each of these depend on the nature of the canopy and imaging parameters such as incidence angle and frequency. Components within the canopy (leaves and twigs) may play a significant role in the scattering and attenuation interactions depending on frequency. It is expected that use of polarimetric data analysis will help understand the nature of scattering within a canopy.
An example modelled co-polarization signature representative of a hardwood forest at L-band shows that backscatter from a heavy forest cover at HH and VV polarizations is similar with that at VV being slightly lower, suggesting the dominance of multiple branch scattering combined with a weak double bounce component (Figure 9-28a). The pedestal height indicates a large unpolarized component in the backscatter return indicative of multiple scattering ![]() .
.
Modelling of the same canopy with a branch density that is an order of magnitude lower results in a polarization signature that is characteristic of a dihedral corner reflector (double bounce) (Figure 9-28b), suggesting the dominance of trunk-ground scattering mechanisms for this forest with fewer branches. The lower branch density also results in a significantly lower pedestal height due to a lower unpolarized component, indicating a smaller amount of volume scattering
P = Normalized Power
Figure 9-28. Co-polarization signature at L-band of, a) a hardwood forest and b) a hardwood forest with a branch density that is of an order of magnitude less than (a) (from ![]() ).
).
Figure 9-29 shows the modelled co-polarization signatures for a forested area and a clear cut area. The clear cut area has a lower pedestal height indicative of a lower unpolarized component due to greater direct return from the ground surface and a smaller amount of volume scattering. The stronger return in the VV case compared to that at HH is indicative of surface scattering.
P = Normalized Power
Figure 9-29. Co-polarization signature for, a) forested area and b) clear cut (from ![]() ).
).
9.3.3.2 Polarization Phase Difference
The Co-polarization Phase Difference can be useful in understanding the scattering mechanisms for a particular target. Single bounce scatterers generally result in a phase difference close to 0o whereas ideal double bounce scatterers have a phase difference of ![]() 180°. In the example from the work of LeToan et al.
180°. In the example from the work of LeToan et al. ![]() for a forest canopy the Co-polarization Phase Difference has been correlated with stand age (Figure 9-30), and to a lesser extent with forest stand height, and trunk biomass In this case, the mean Co-polarization Phase Difference obtained for the clear cut area (
for a forest canopy the Co-polarization Phase Difference has been correlated with stand age (Figure 9-30), and to a lesser extent with forest stand height, and trunk biomass In this case, the mean Co-polarization Phase Difference obtained for the clear cut area (![]() = 6.8°) indicates that the backscatter is largely a function of surface scattering from the ground. The mean value for the mature forest stand is much higher (approximately 66°) and has a larger standard deviation (90°) than that obtained for the clear cut area (70°). This is indicative of volume scattering.
= 6.8°) indicates that the backscatter is largely a function of surface scattering from the ground. The mean value for the mature forest stand is much higher (approximately 66°) and has a larger standard deviation (90°) than that obtained for the clear cut area (70°). This is indicative of volume scattering.
F = Frequency of occurence (%), D = Polarization phase difference (Deg)
Figure 9-30. Histograms of P-band Copolarization Phase Differences between HH and VV polarizations (![]() ) for (I) a clear cut area and (II) a 46 year old pine forest plantation (
) for (I) a clear cut area and (II) a 46 year old pine forest plantation (![]() ).
).
Page details
- Date modified: